We’re starting this Litepaper with a bit o’ technical analysis. I usually reserve this for the end, but I think it’s extremely important to get an idea of how badly Bitcoin ($BTC.X) has fallen off the fail tree and hit every single limb, branch, and twig on the way down.
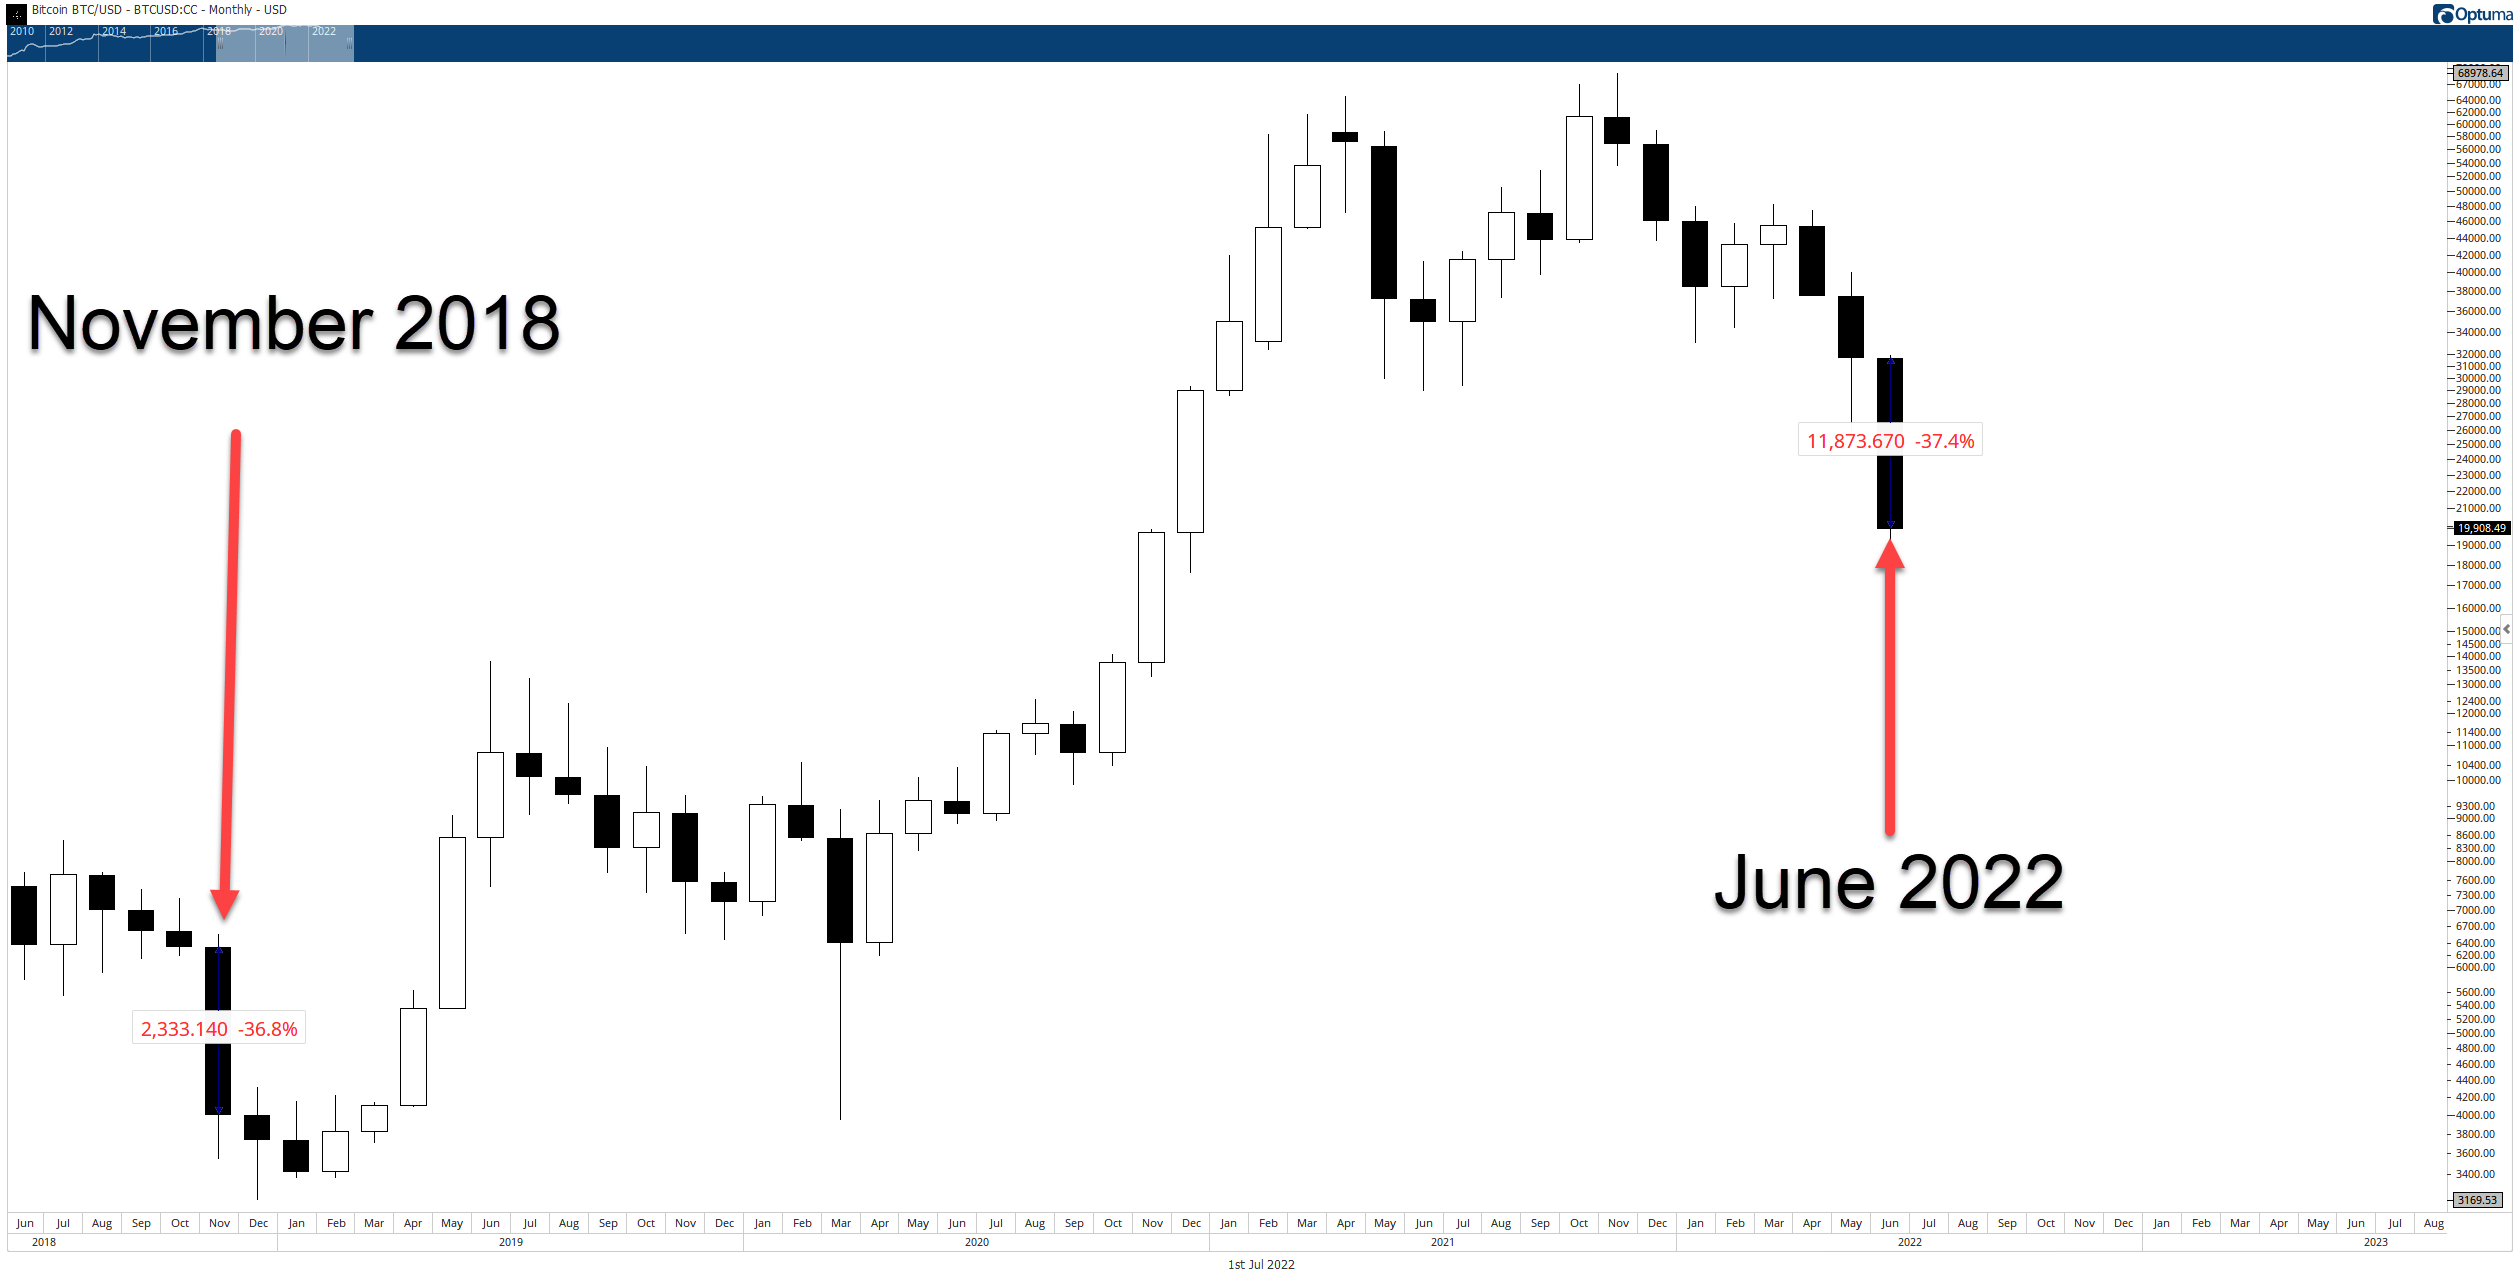
Above is Bitcoin’s monthly candlestick chart, which shows June 2022 was officially the worst-performing month for Bitcoin in 11 years. And the third-worst in its history. The prior record-holder was November 2018, with a 36.8% loss. That compares to June 2022’s 37.4% loss, which is pretty much the same if you ask me.
Yes, there have been wider price ranges on a percentage basis, but as a measure of where Bitcoin started and ended the month, June 2022 was one of the worst ever.
Likewise, the monthly RSI (Relative Strength Index) has hit new all-time lows – and right against a very, very interesting location.
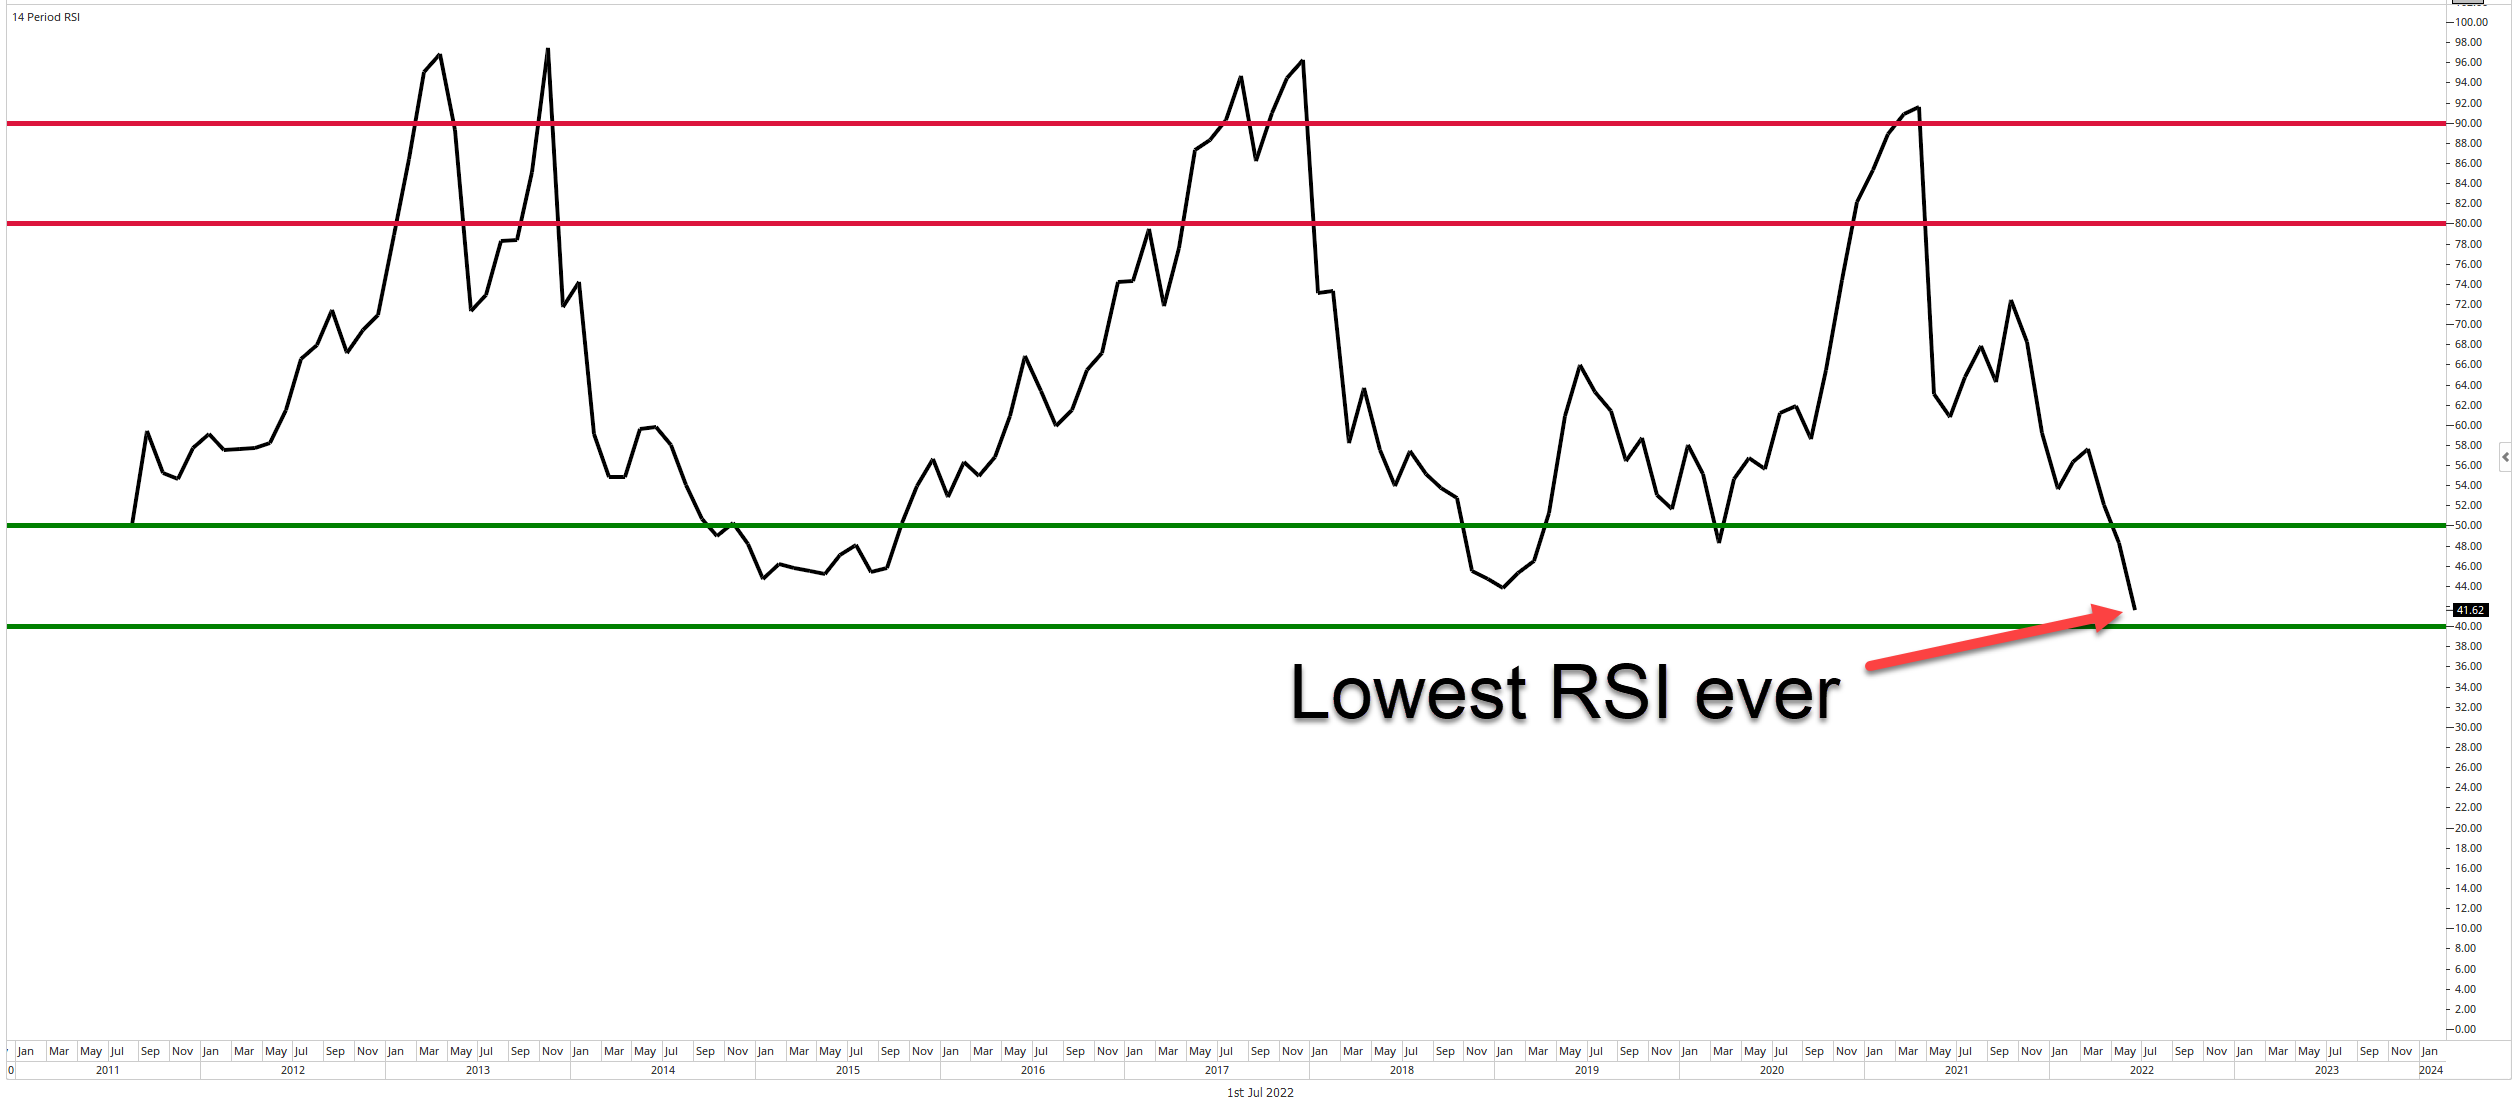
The image above shows the monthly RSI with two red lines and two green lines. In Connie Brown’s Technical Analysis for the Trading Professional, she identified changes to the RSI that should be made. Depending on whether an instrument is in a bull market or a bear market, the new method of using the RSI has different overbought and oversold levels. In a bull market, overbought is 80 and 90, while oversold is 50 and 40.
For the TL;DR explanation: the RSI has hit a powerful support level. That means there is a high probability, not a certainty, but a high likelihood that some form of a significant bounce can occur for Bitcoin. Like a dead cat bounce.
But not like a Tabby cat, more like that 1,000 lb lion-tiger crossbreed feline from hell.
But we’re not done with the nerdfest yet. Like a fireworks display that you don’t want to end, there is one more truly exciting and heart-pounding action-filled piece of technical analysis: time cycles.
If you want to journey into nerd town, scroll to the last article in this edition. It’s the final part of the Litepaper before I open a cold one before the long weekend. 🎇