Welcome to the Technically Speaking section of today’s Litepaper. Wednesday’s Litepaper will highlight detailed and in-depth technical analysis, and it’s broken down into three categories: Beginners, People Who Know Some Stuffs, and Full Blown Nerd Mode.
And if you just want a quick summary of what that all means, there is a lovely TL;DR (Too Long; Didn’t Read) at the end.
Today’s focus is on Ethereum ($ETH.X)
Beginner’s Technical Analysis
We’re going to look at two Ethereum charts here – the daily and the weekly, with the 200-period moving average. The 200-period moving average is a common technical analysis tool used by analysts to give a general view of whether an instrument is in a bear market or a bull market. Above the 200-period moving average, analysts are bullish; below, they are bearish.
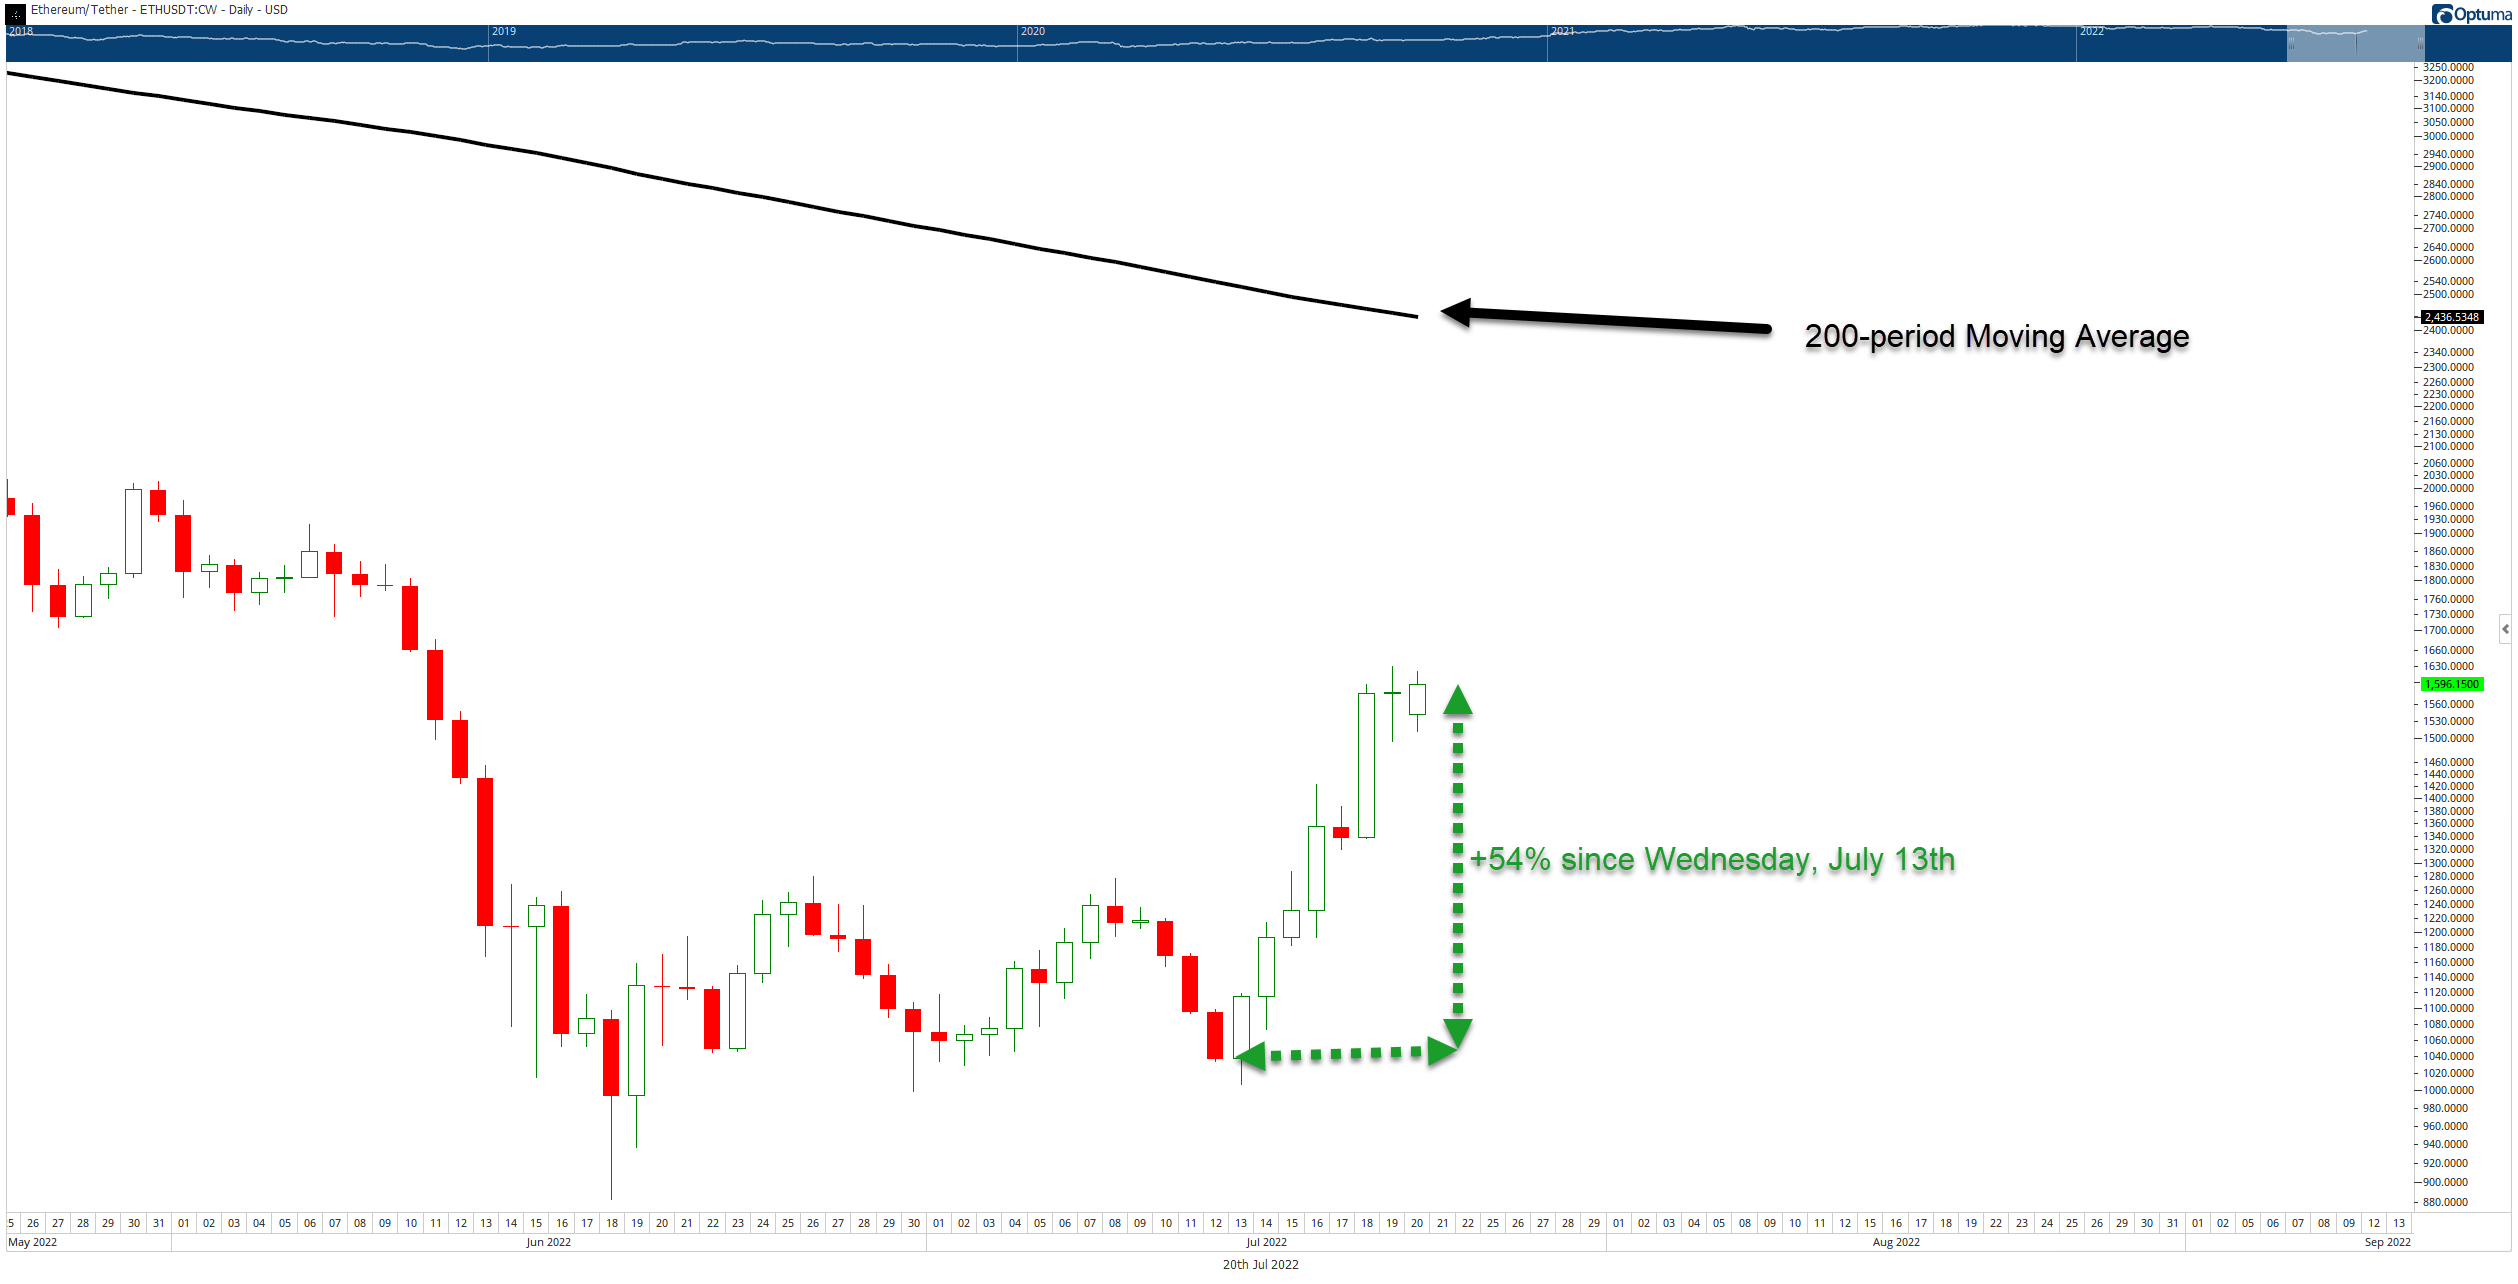
On Ethereum’s daily chart (above), price remains below the 200-period moving average. Even though Ethereum has moved higher by nearly 55% in seven days, it is still considered weak by analysts.
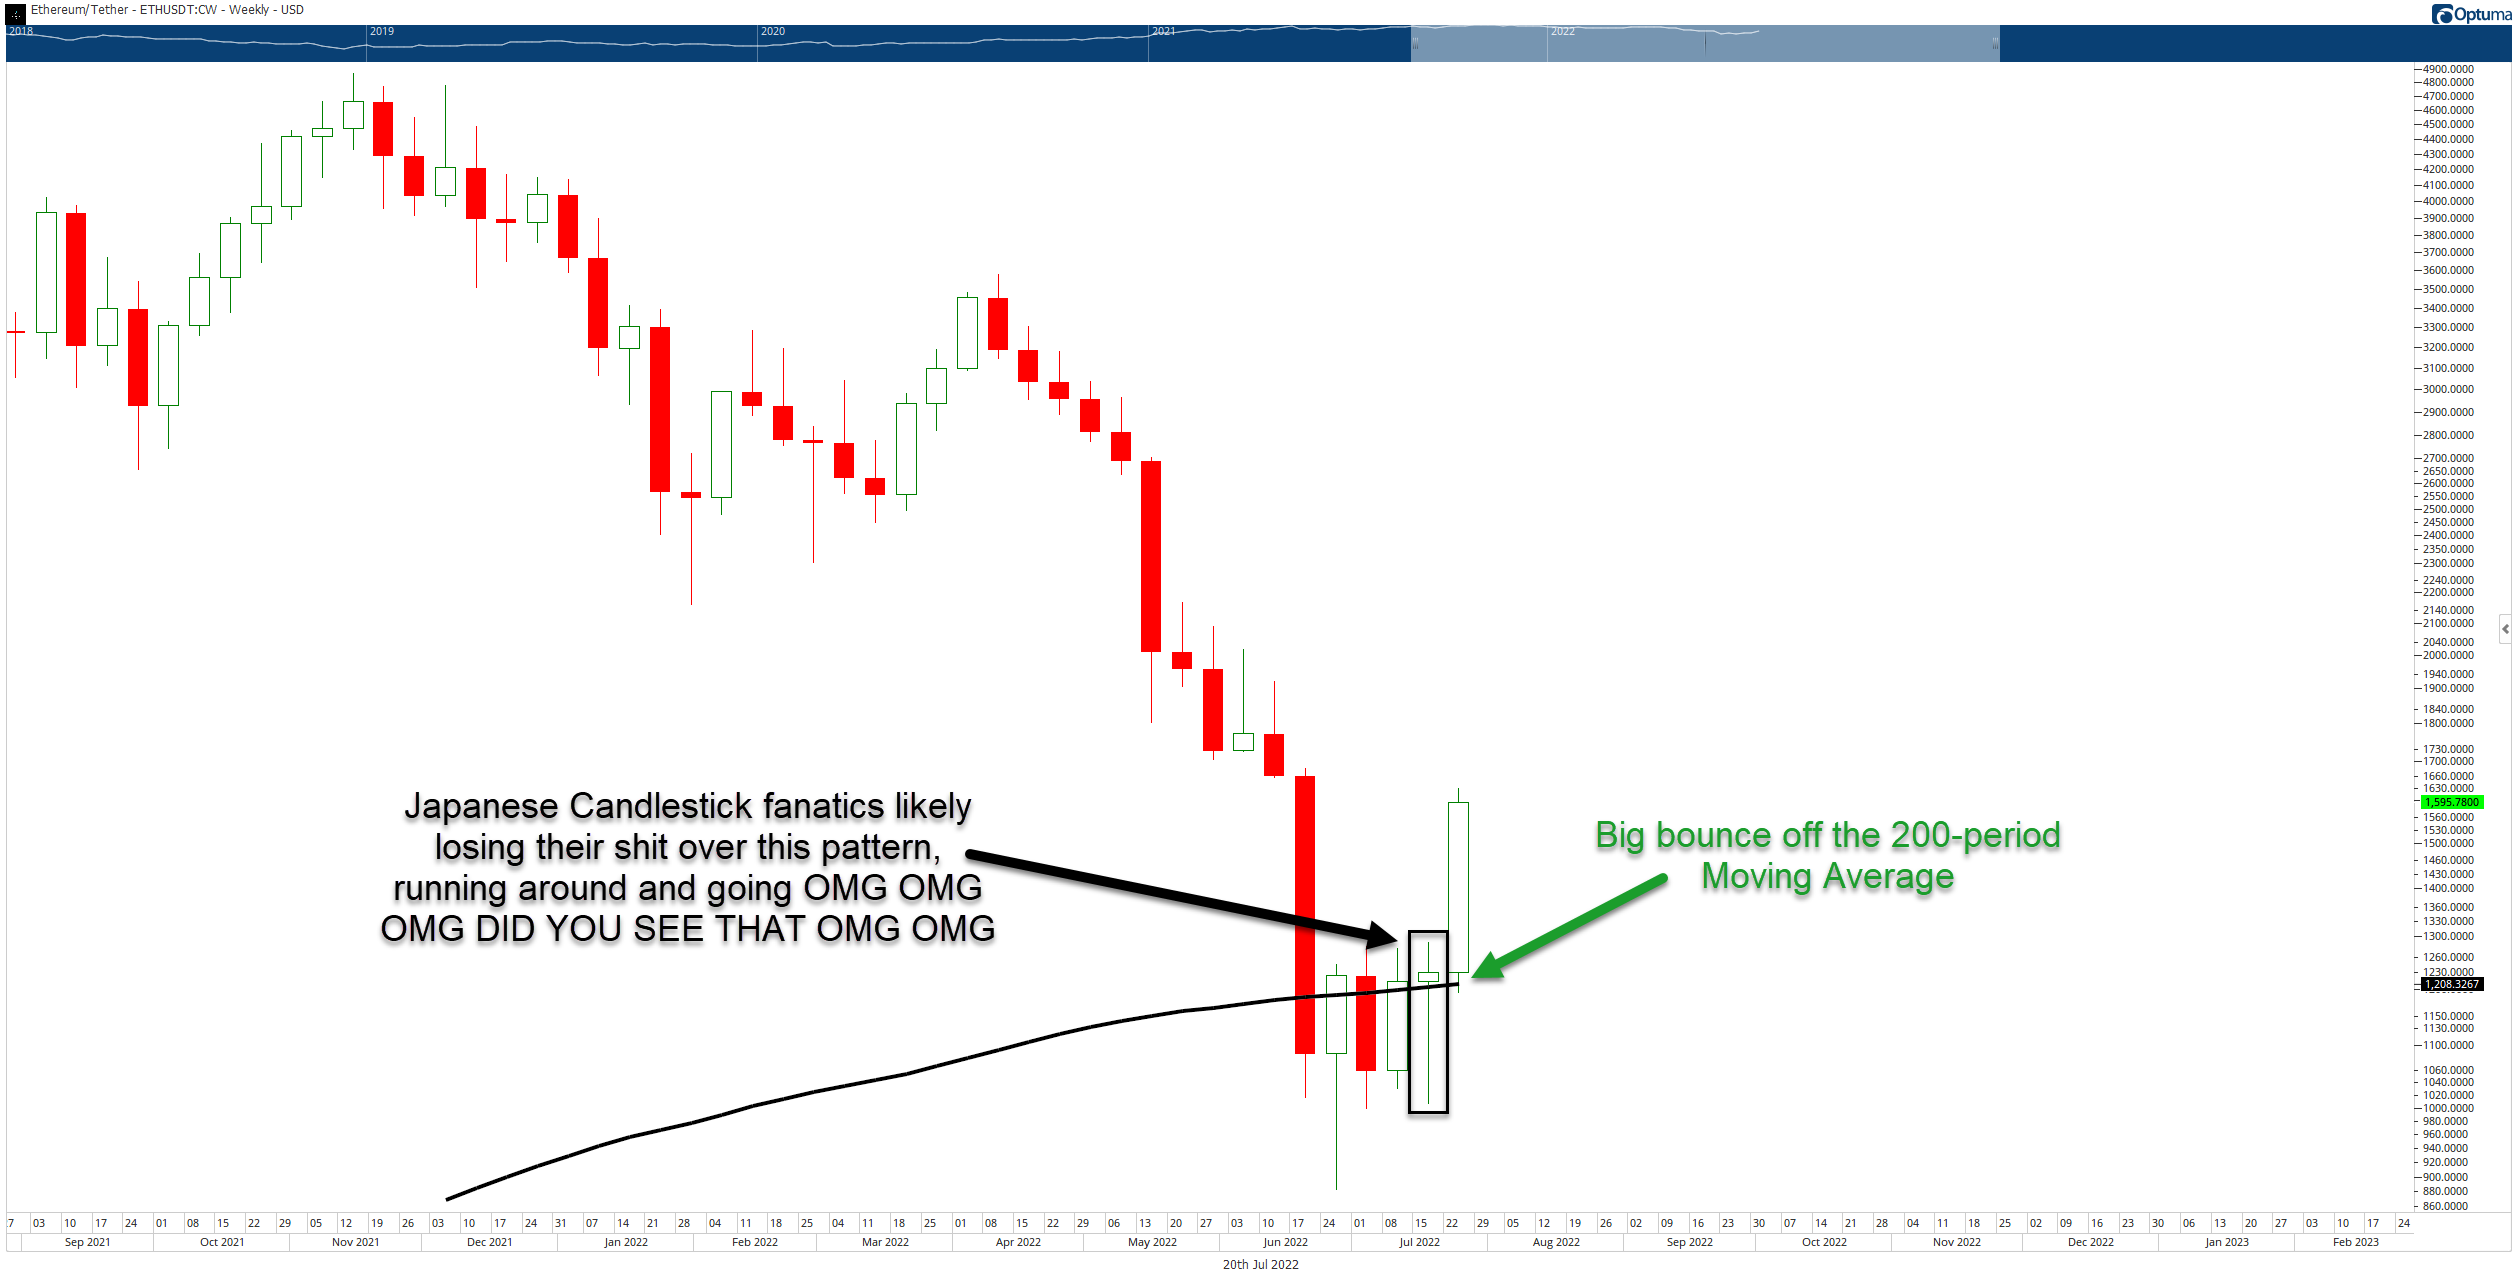
Compare that with the weekly chart (above), and you see a different story. On Ethereum’s weekly chart, price has ping-ponged above and below the 200-period moving average for nearly five weeks.
Last week’s candlestick pattern could be interpreted as two different, but both bullish, patterns: a Bullish Hammer or a Dragonfly Doji*. The Bullish Hammer and the Dragonfly Doji, especially the Dragonfly Doji, are two candlesticks that Japanese Candlestick fanatics are probably frothing at the mouth over. The current weekly candlestick is a clear example of how bulls are in control this week.
Most important on the weekly chart, however, is the strong bounce off the 200-period moving average. Analysts will be watching where Ethereum ends the week to determine if the moves this week are honest bullish drives higher or if they’re fakeouts with more downside movement ahead.
But there’s always the question: if the daily chart shows Ethereum is still bearish, but the weekly is bullish, which is right? That’s up to each person to decide and often depends on your time frame. But analysts and investors weigh the longer time frames as the more important. In other words, what happens on the weekly chart is more important than what happens on the daily chart.
People Who Know Some Stuffs Analysis
Continuing with our deep dive into Ethereum’s technicals, we’re adding a Fibonacci retracement and the Relative Strength Index (RSI) oscillator.
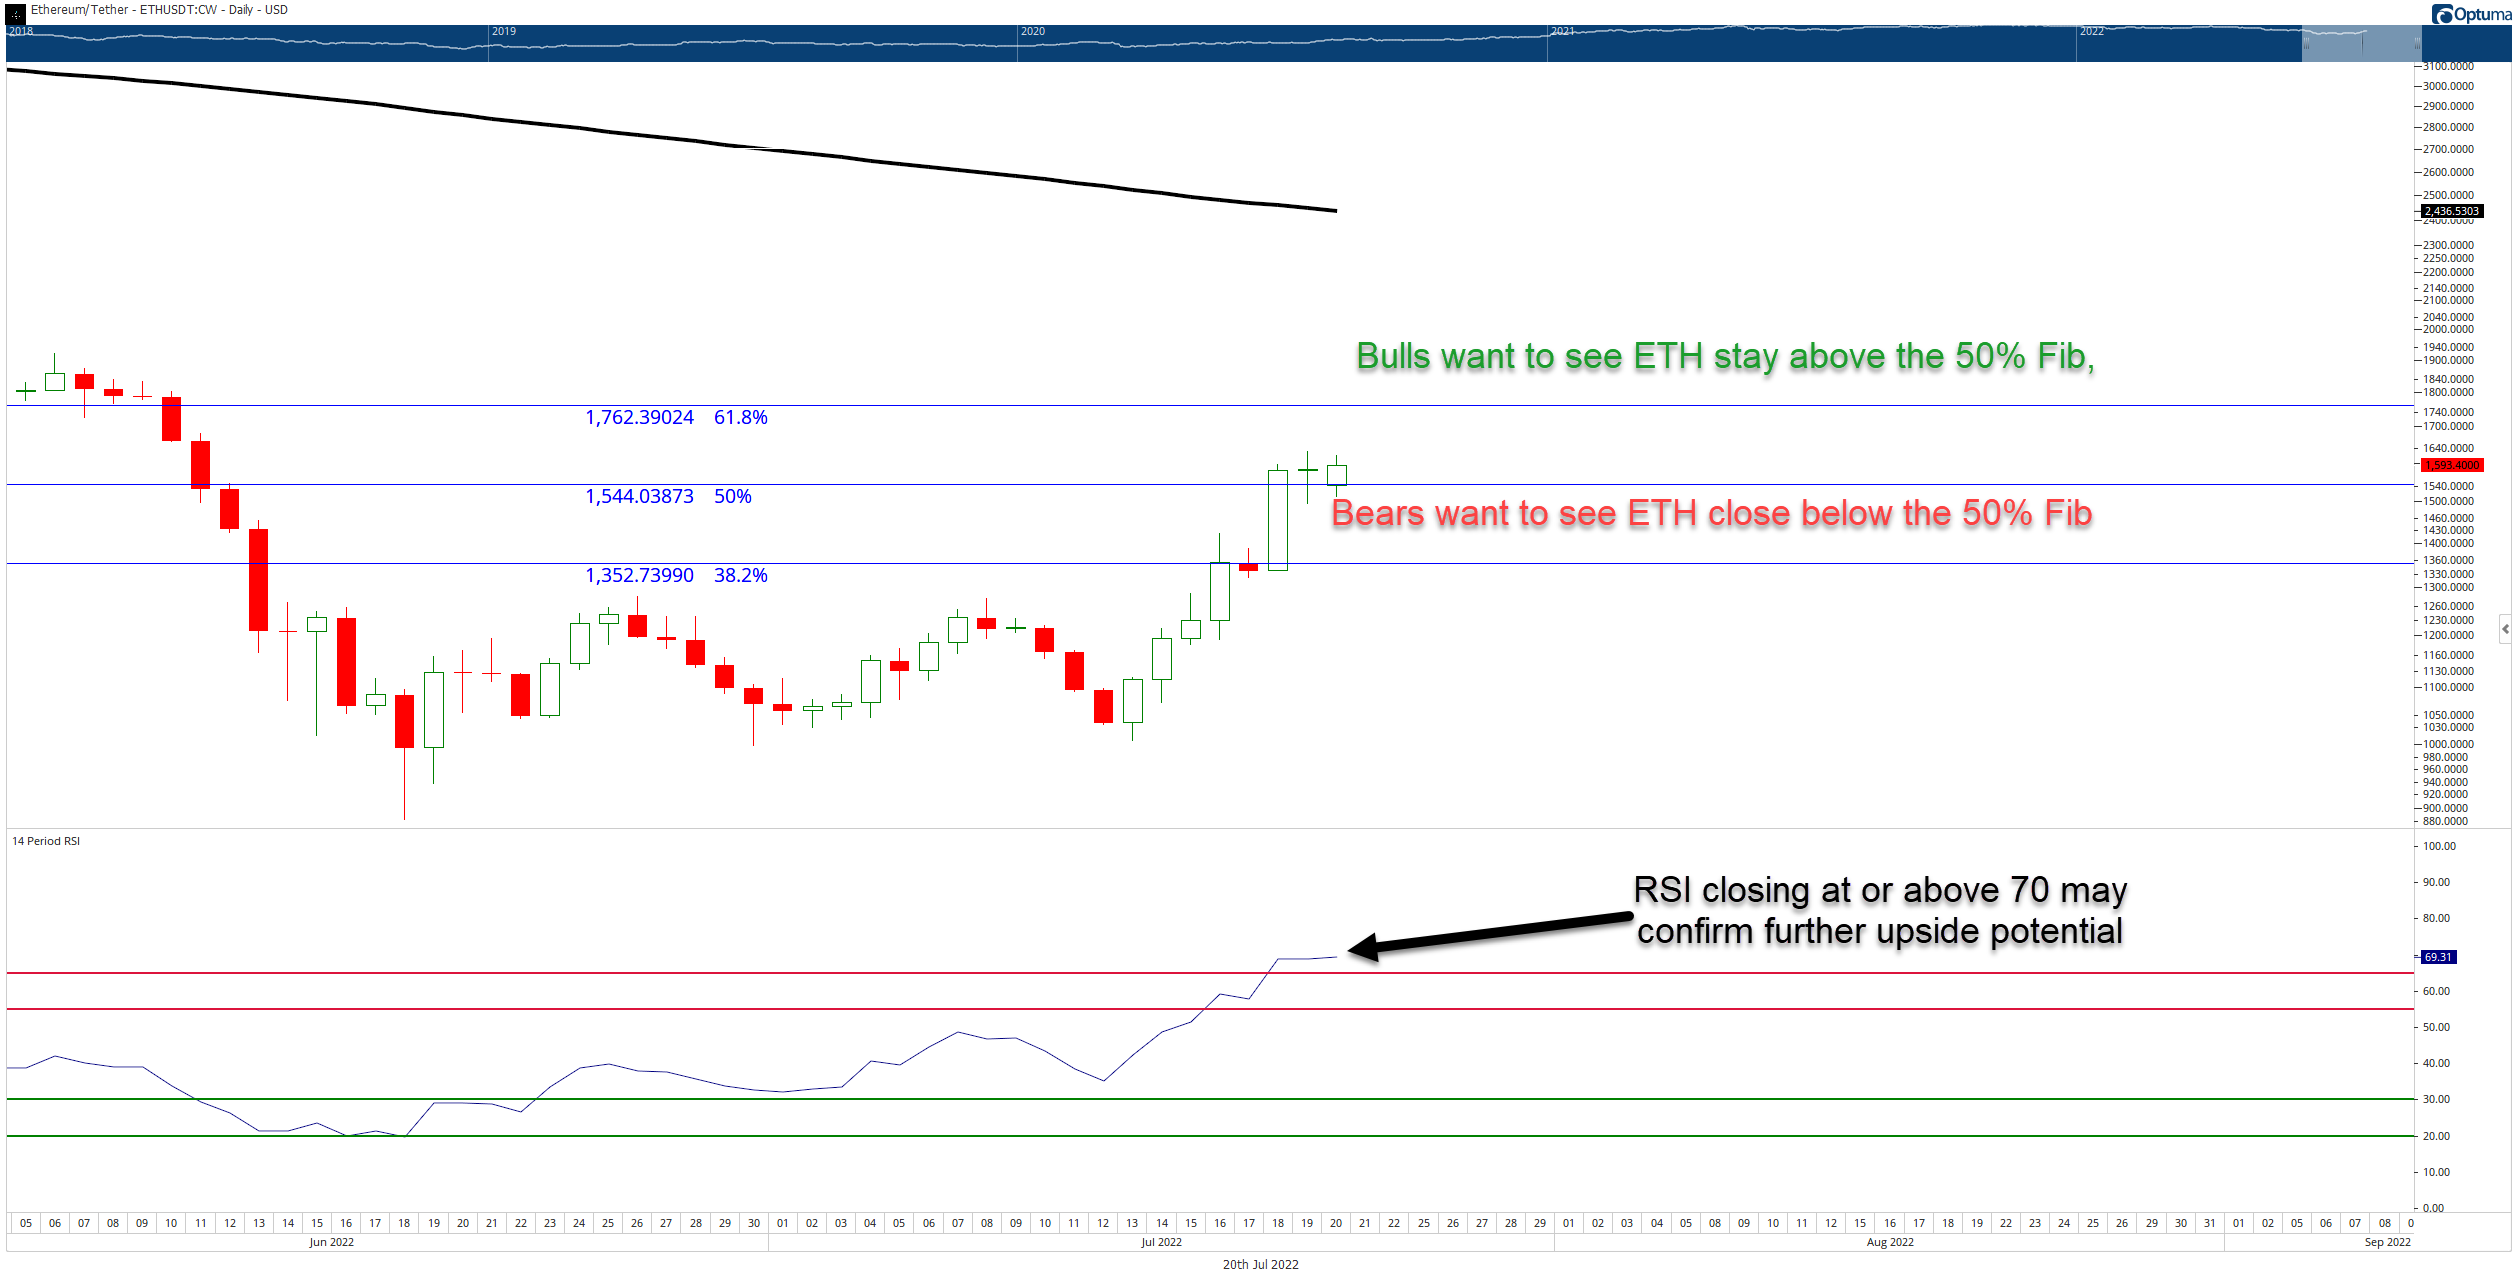
The chart above is Ethereum’s daily chart. It is currently between two critical Fibonacci levels: the 50% and 61.8%. Bulls want to see Ethereum move and stay above the 61.8% Fibonacci retracement at $1,762, but it’s most important for them (bulls) to remain above the 50% Fibonacci retracement at $1,544.
The Relative Strenght Index is in an interesting position. The RSI is set up for bear market conditions, so the oversold levels are 20 and 30 while the overbought levels are 55 and 65. Ethereum’s daily RSI is above both overbought levels – but that’s where there’s danger.
Until the RSI can close at or above 70 (currently at 69.31), it will remain in bear market territory. Bears would likely begin howling for joy if ETH dips and the RSI falls back below 65 – that’s the kind of price action analysts and traders look for when selling pressure may begin in earnest.
But let’s look at Ethereum’s monthly chart.
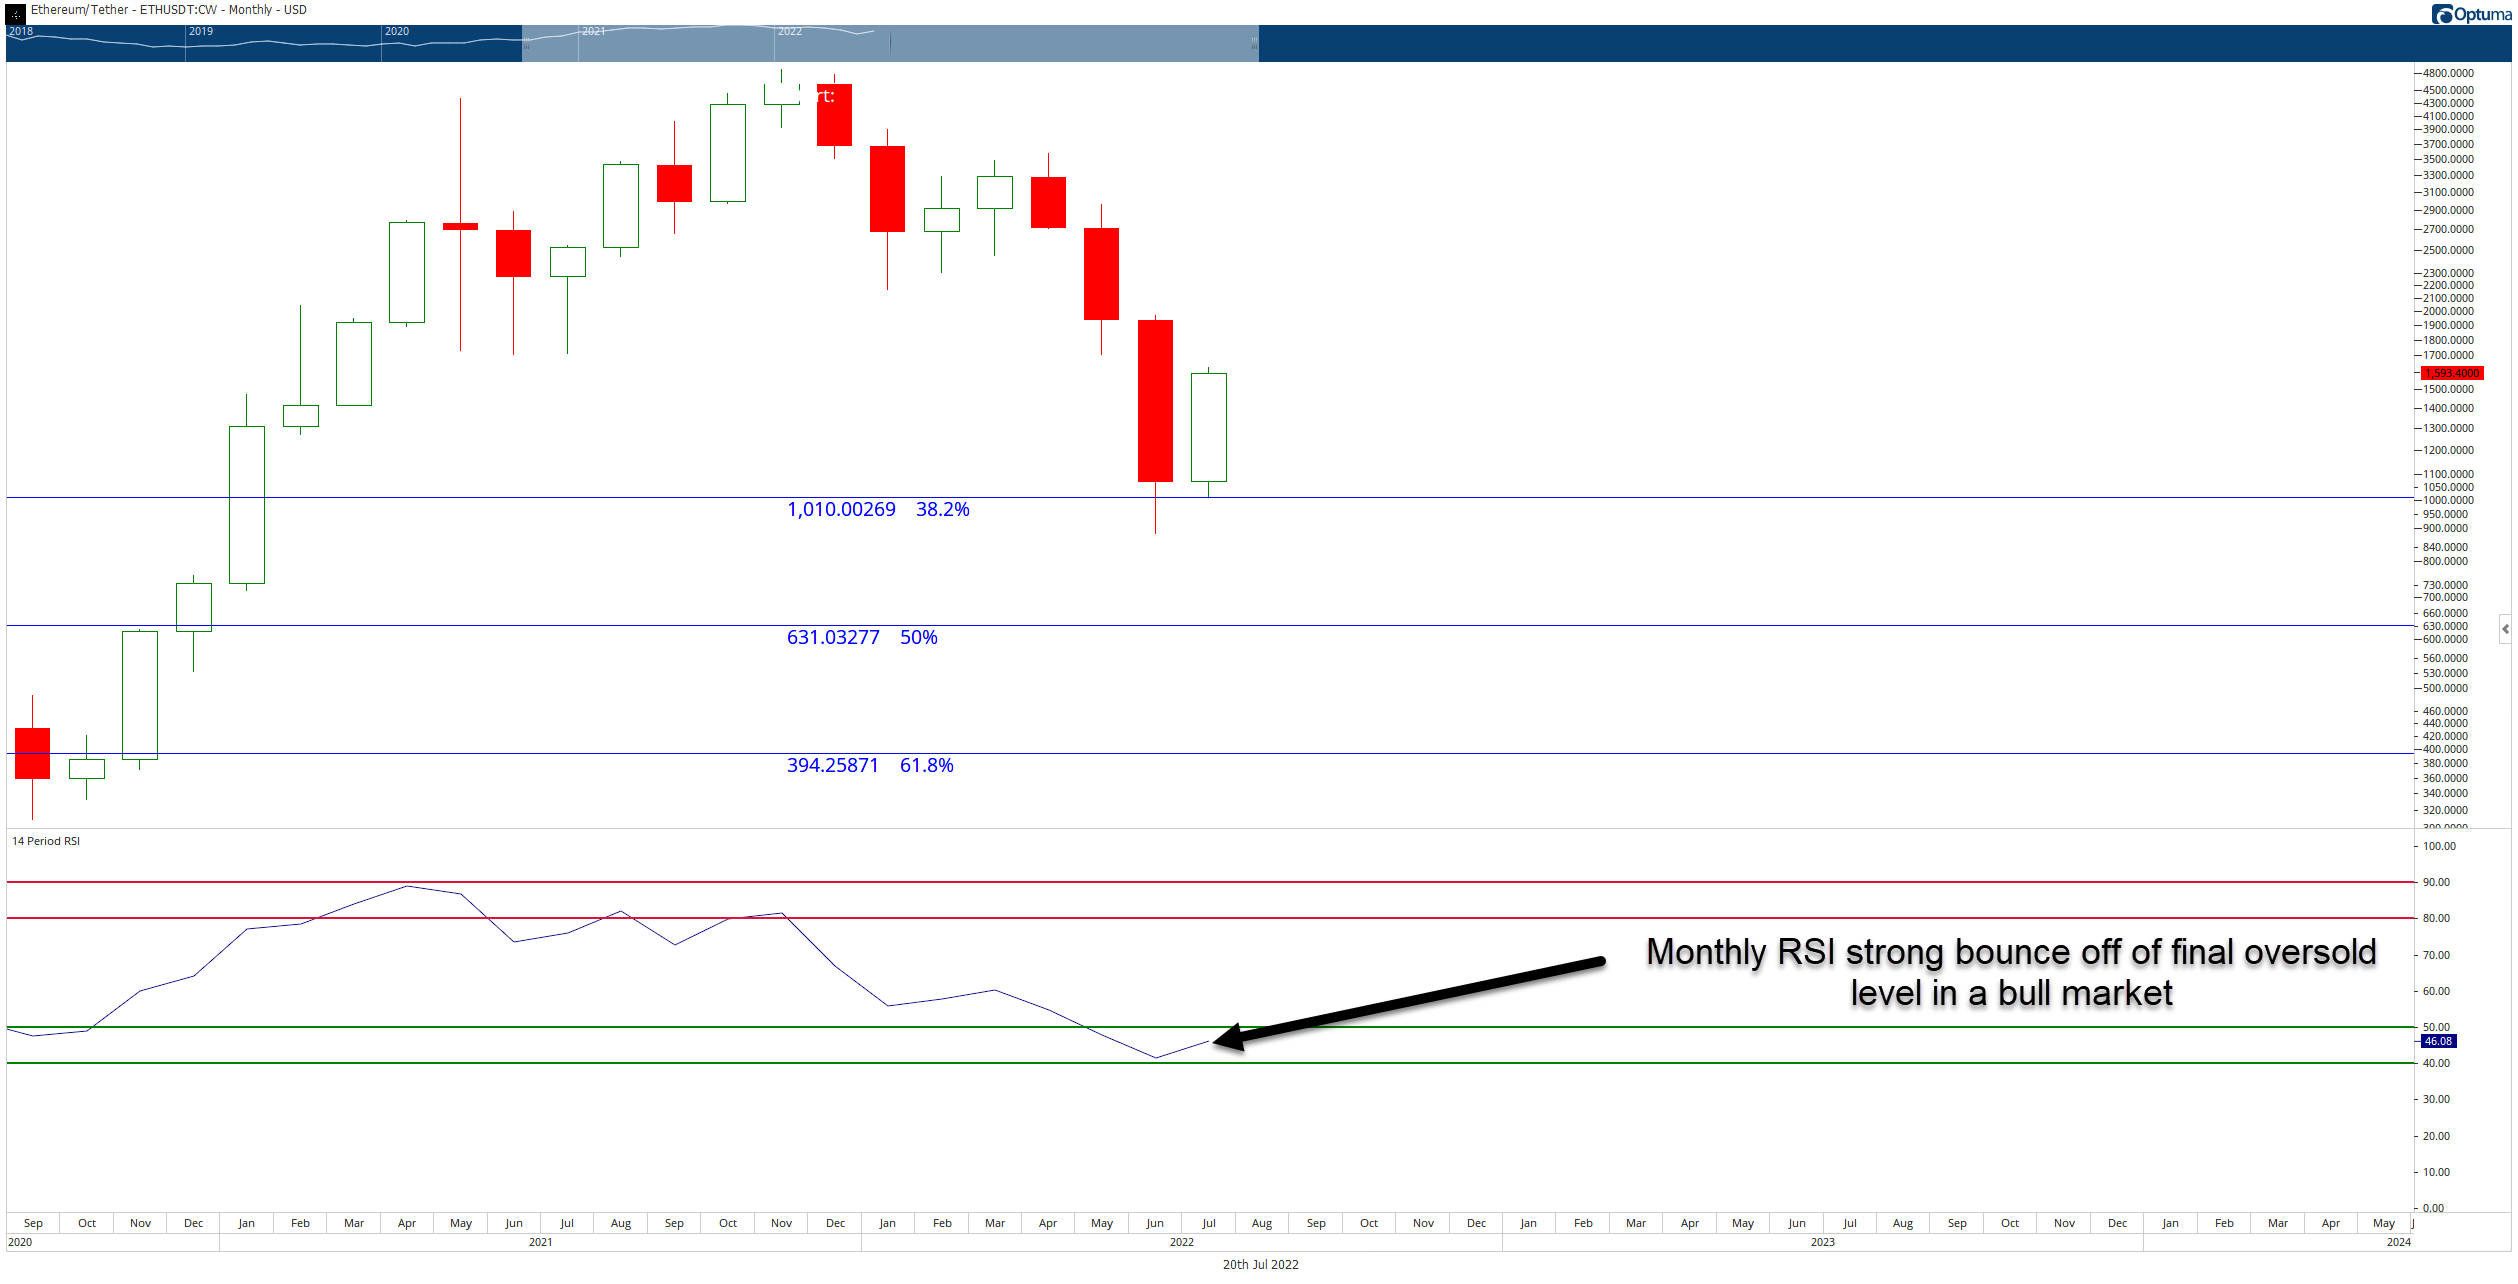
On Ethereum’s monthly candlestick chart (above), you can see that June’s candlestick close above the 38.2% Fibonacci retracement – a very supportive event. Additionally, the current monthly candlestick continues to bounce heavily off the 38.2% Fibonacci retracement.
But take a look at the monthly RSI. Whereas the daily chart’s RSI was set up for bear market conditions, the monthly RSI is still in bull market conditions – which means that the overbought levels are 80 and 90, with oversold at 50 and 40.
There are still ten more days left in July, but if Ethereum were to close around its present value area ($1,600), analysts believe a case for a sustained bullish advance is increasingly possible.
Nerd Mode Analysis Engaged
For the final part of Technically Speaking, we’ll be focusing on the Ichimoku Kinko Hyo system. On Ethereum’s daily Ichimoku chart (above), you can see its inside the Cloud (Kumo in Japanese).
Now for those unfamiliar with the Ichimoku system, f you can take away one thing from today’s Technically Speaking: Inside the Cloud is bad. The Cloud represents indecision, volatility, and broken hearts.
The Cloud is where Covid-19 was probably developed; monkeypox comes from, watered-down coffee is made – everything bad in the world is because of the Cloud.
On the daily chart, there are several pieces of technical data that analysts could interpret as ‘top heavy’ – in other words, a pause in higher prices or even a pullback occurring.
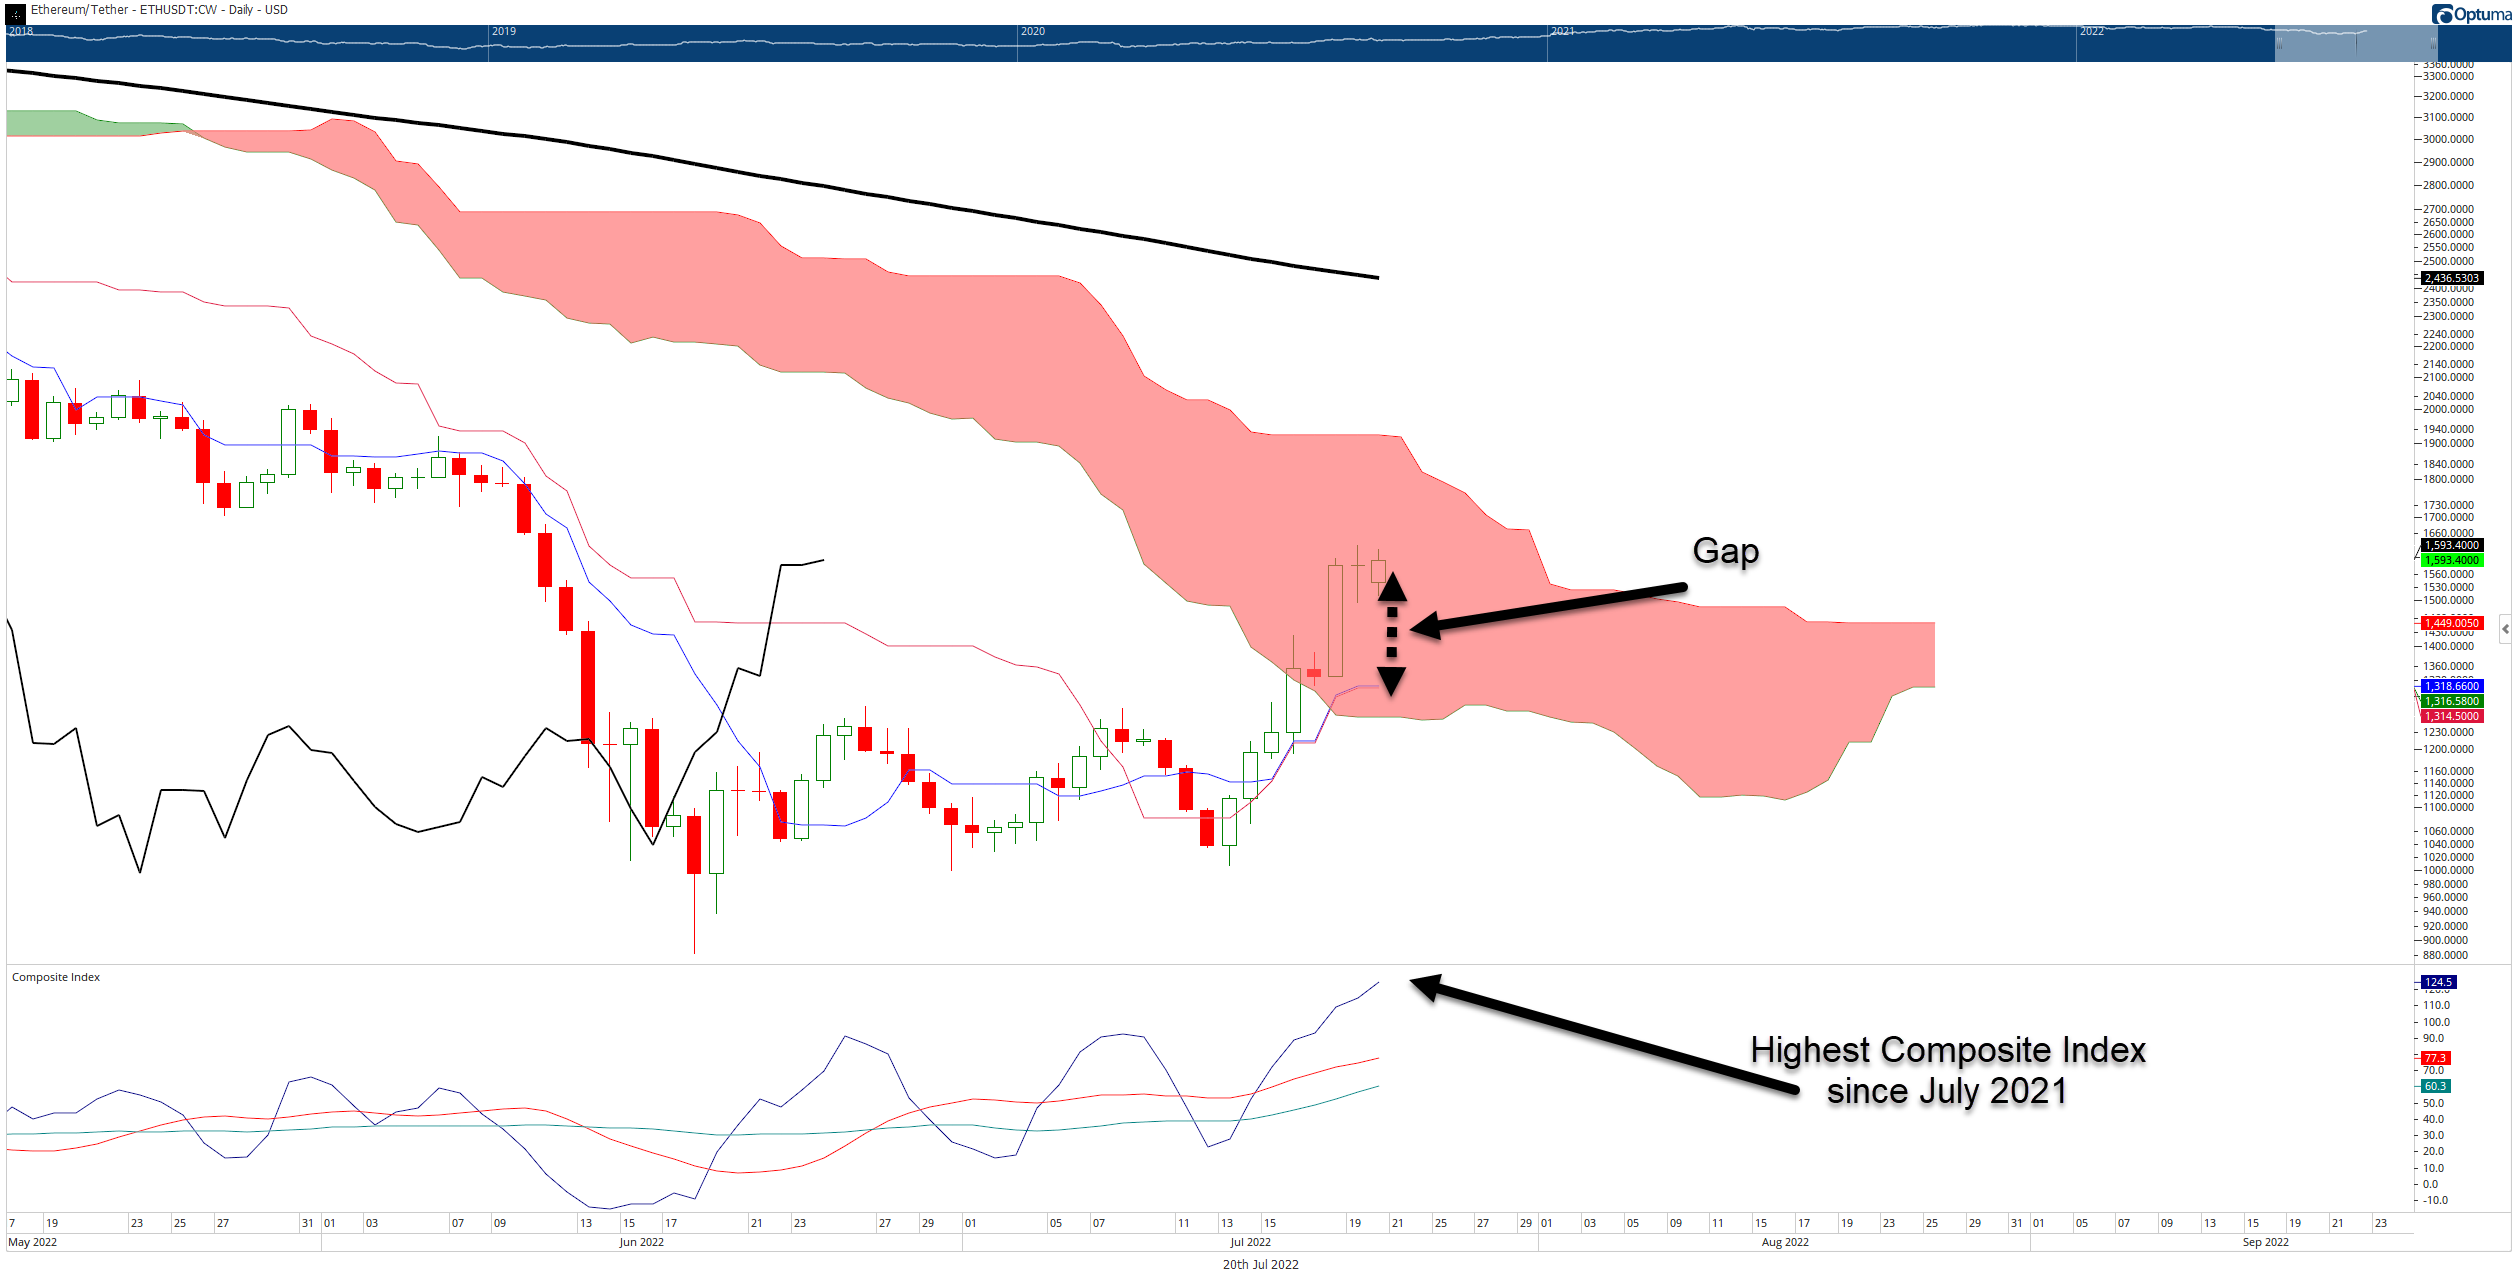
The Tenkan-Sen (blue moving average) and price like to stick together. They’re like an unhealthy co-dependent couple; they freak out when they’re too far apart and can’t stand being apart for too long.
When noticeable and sizeable ‘gaps’ between the bodies of the candlesticks and the Tenkan-Sen appear, that’s often when the codependency problems occur: “omg, like, why are you walking away from me?! Do you not need me anymore? Is that what you’re saying?!”
The gaps are often resolved quickly and return to equilibrium, and the codependency crisis becomes resolved: “OMG, I didn’t mean anything by it. I love you so much; I’ll never leave you.”
The Composite Index is another piece of data on the daily chart that warns of a temporary top. The great Connie Brown developed the Composite Index. In a nutshell, it is the RSI with a momentum indicator. It is an unbounded oscillator that catches divergences that the RSI cannot detect.
The Composite Index is at a historic high. Not since July 2021 has the Ethereum’s daily Composite Index for this high. A high Composite Index reading is not indicative of an overbought market. Given the gap between the Tenkan-Sen and price, analysts may look for a pullback to retest the prior resistance support at $1,325.
TL:DR Summary For Bulls
Given the continued oversold nature on the weekly and monthly charts, analysts feel there is a strong probability that Ethereum and the broader cryptocurrency market will continue higher, but with a small pullback occurring soon. The RSI levels on the monthly chart and the strong bounce off the 38.2% Fibonacci retracement on the monthly chart give a strong case for some sustained bullish movement.
TL:DR Summar For Bears
Major signs of Ethereum getting fairly top-heavy should be watched, especially if the RSI is rejected at 70 and falls below 65. However, given prior time cycles and the current technicals on the weekly and monthly charts, analysts with a bearish bias are watching for any hints that Ethereum would consolidate here instead of pulling back. 🚧