The CPI data released this morning has given all risk-on markets a strong injection of happiness. Bitcoin ($BTC.X) recaptured the $24k level, Ethereum ($ETH.X) went beyond $1,800, and the Total Market Cap hit $1.127 trillion. As long as the crypto market stays around the 1.15 trillion level, it will be the highest close in 60 days.
Technical analysts are likely paying special attention Total Crypto Market Cap daily candlestick chart. When writing this article, the daily Total Market Cap chart shows a Bullish Engulfing candlestick pattern. But that can change very quickly, especially near the end of the day.
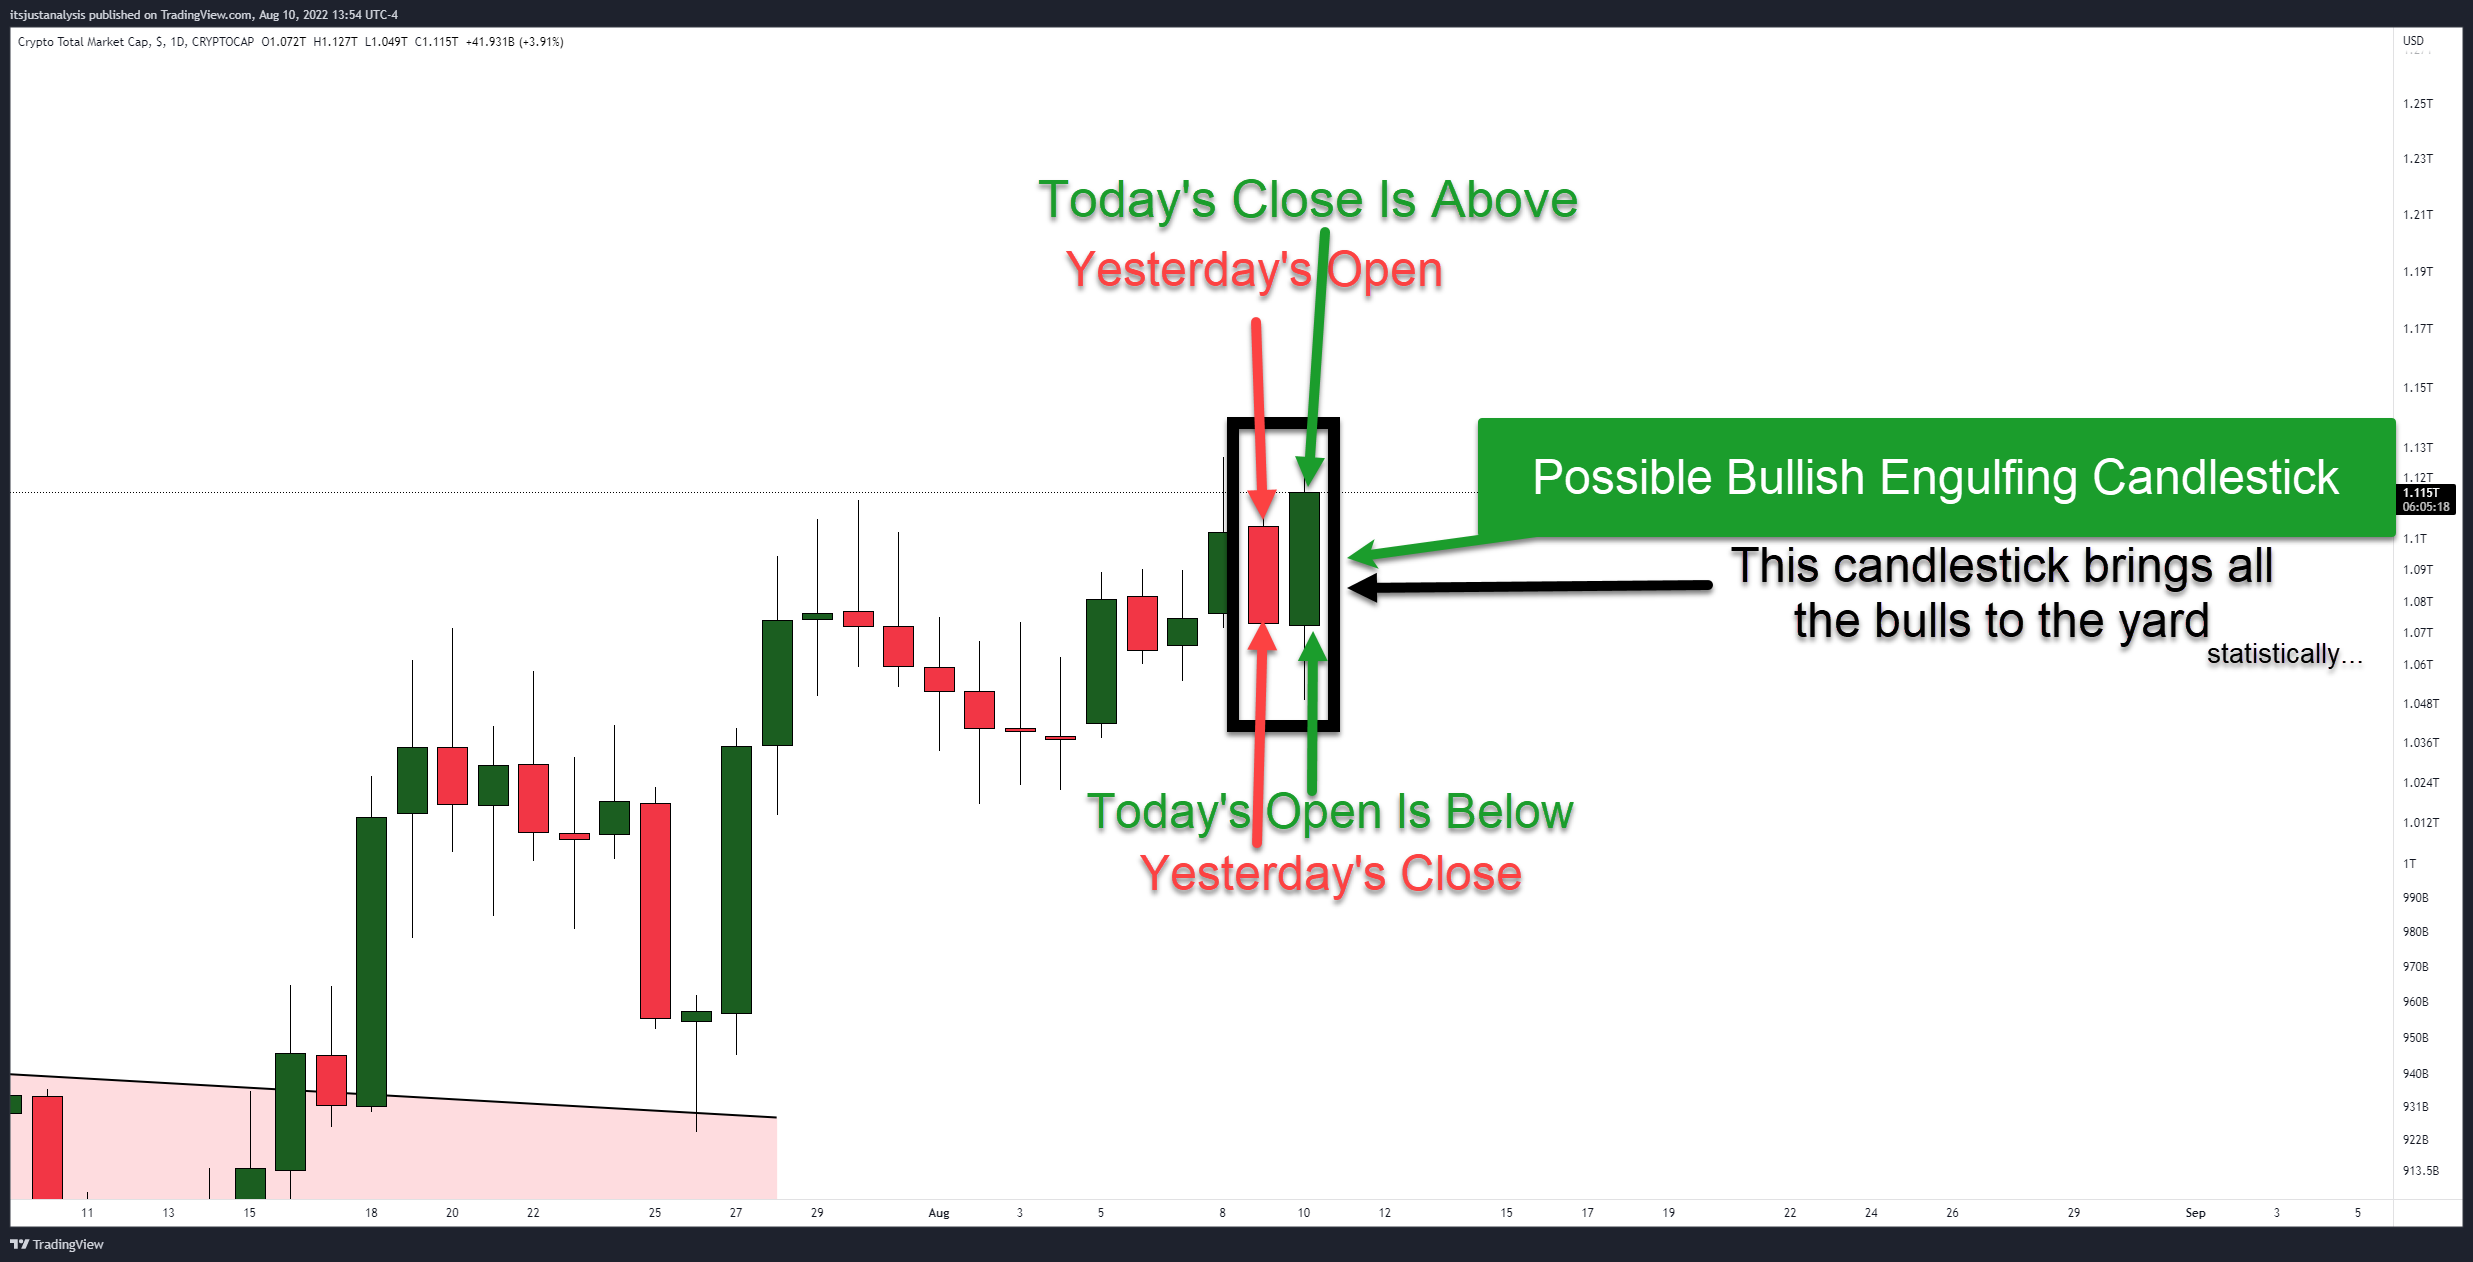
Few of the 230+ Japanese candlestick patterns are as bullish and sought after as the bullish engulfing candlestick. The TL;DR definition of this candlestick pattern is the body of the candlestick ‘engulfs’ the prior candlestick.
In other words, the current open is below the previous close, and the current close is above the previous open (slight variations are allowed in markets like crypto and forex).
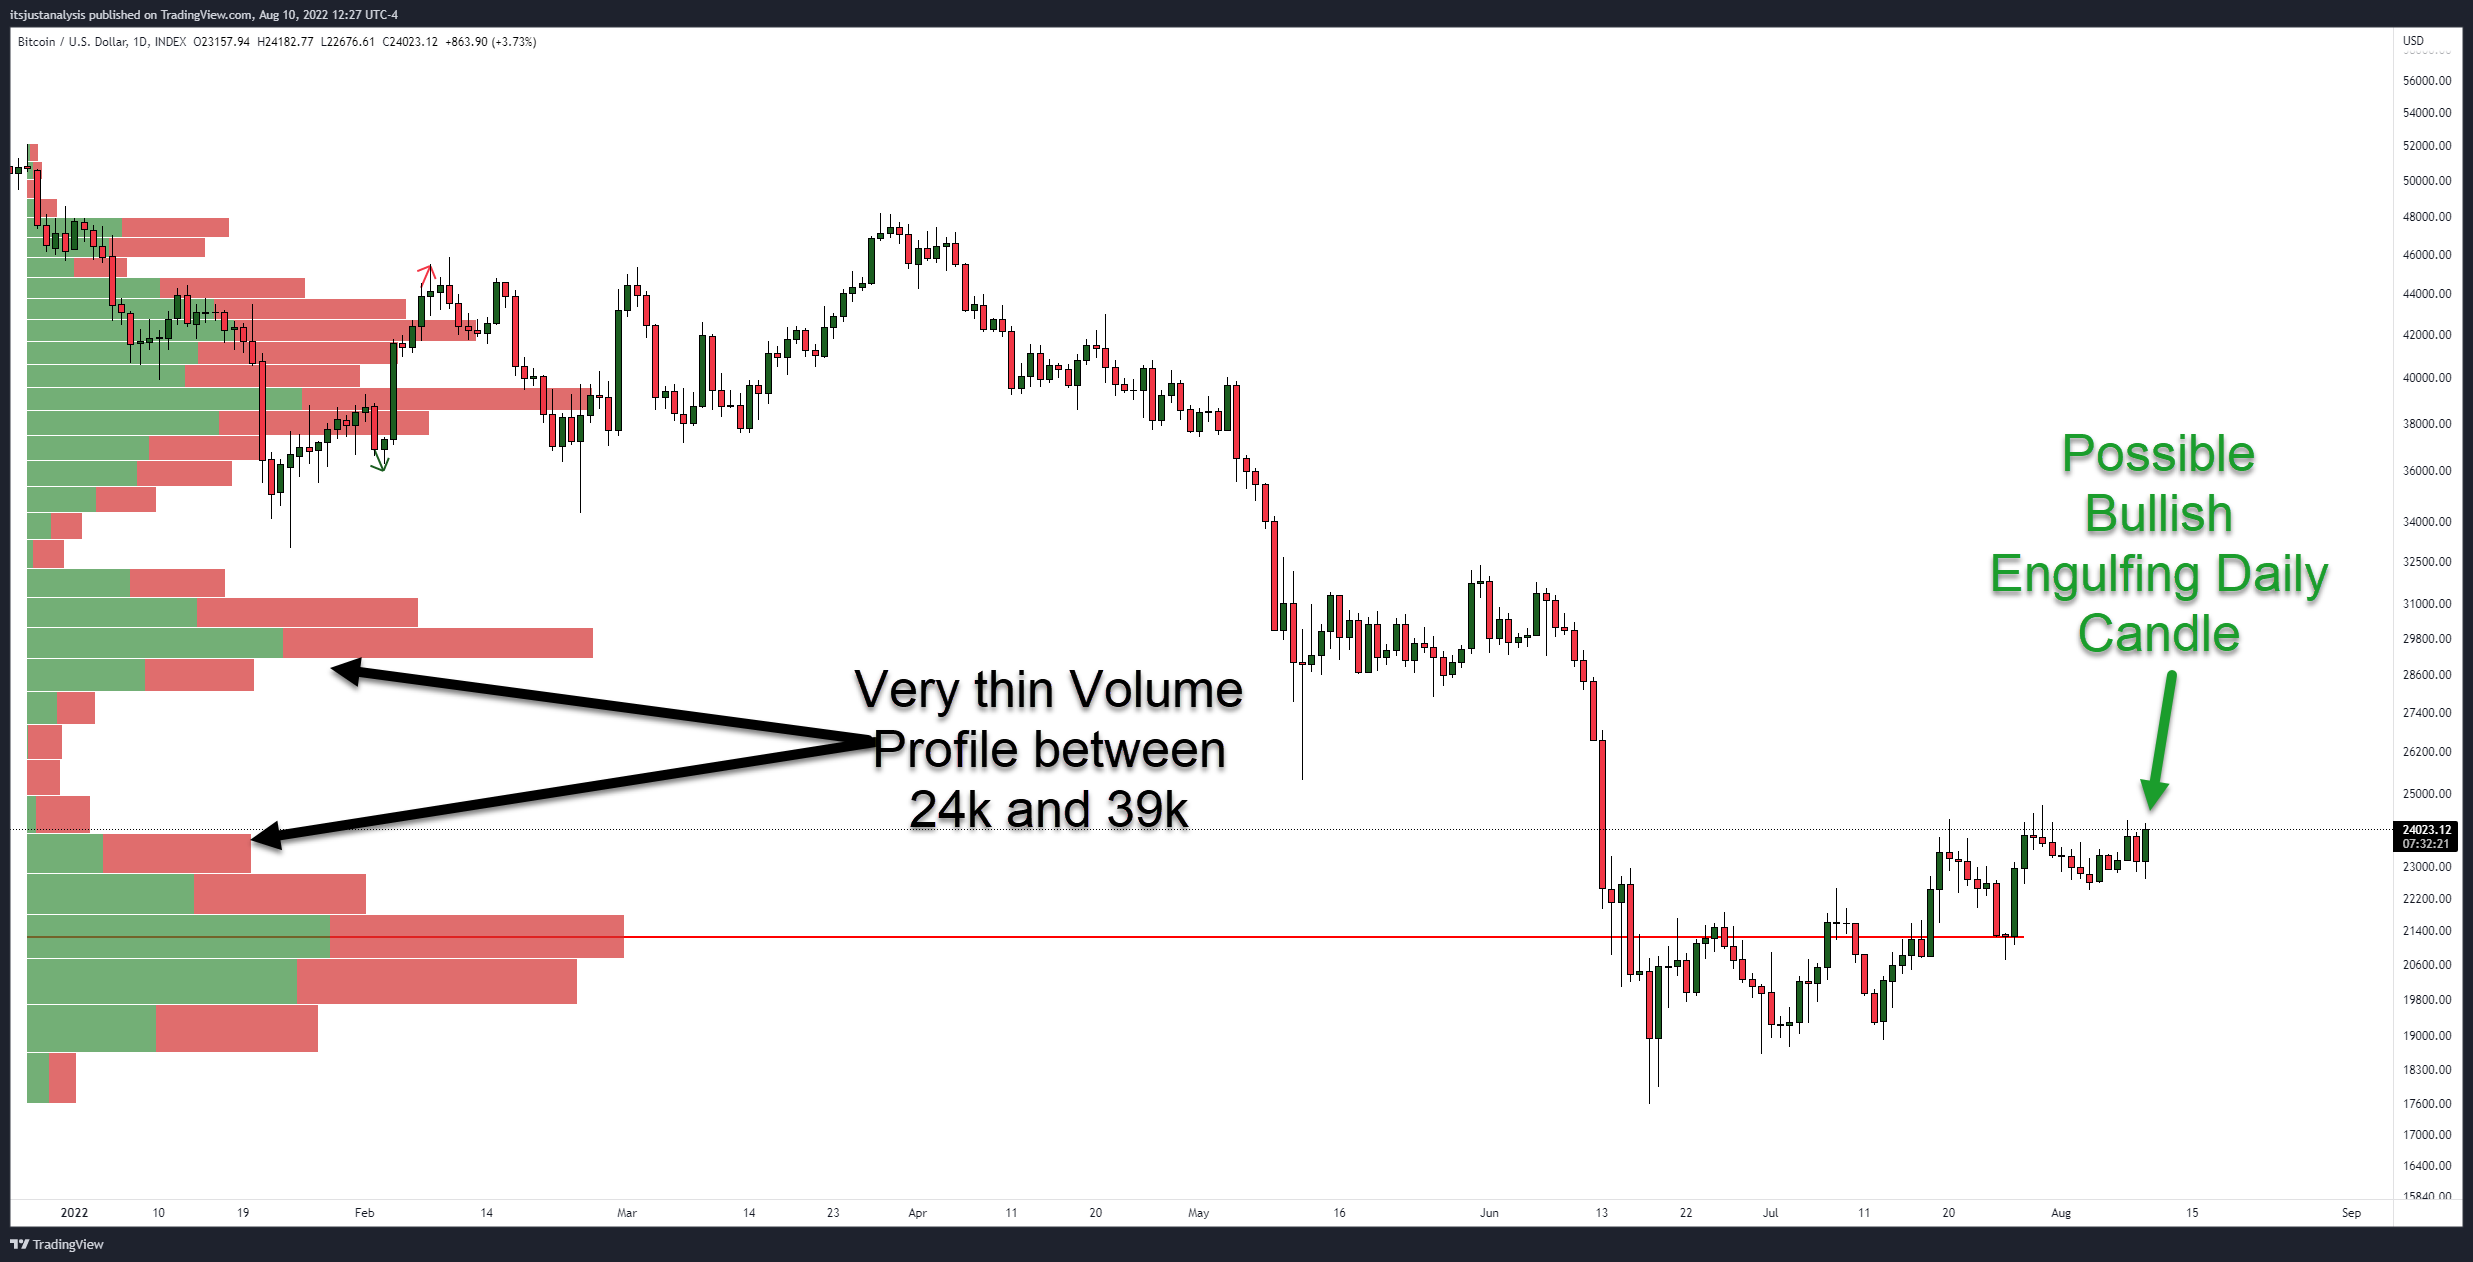
Analysts are looking very closely at where Bitcoin is at, especially with how thin the Volume Profile is between the $24,000 and $29,000 value areas.
Don’t be surprised to see some major whipsaws in price action for the remainder of the week!