Oof. It’s been a rough one today for the bulls. That being said, it’s very likely that by the time you, dear reader, read this Litepaper, some of the price levels could be wiiiiiiiiildly different from what they were at the time of writing. Just an FYI.
Taking a look at the Total Market Cap chart shows a boatload of ugliness. The past seven trading days have been one red after another. And the bleed-off has been slow until today. Pundits across the board are screaming that new all-time lows are incoming. Crypto critics are hitting Twitter with their best hindsight genius ‘HAHAHAHA TOLD YOU SO OMG LOOZERS’ commentary.
And hey, they might be right! But let’s take a look at what the technicals are doing.
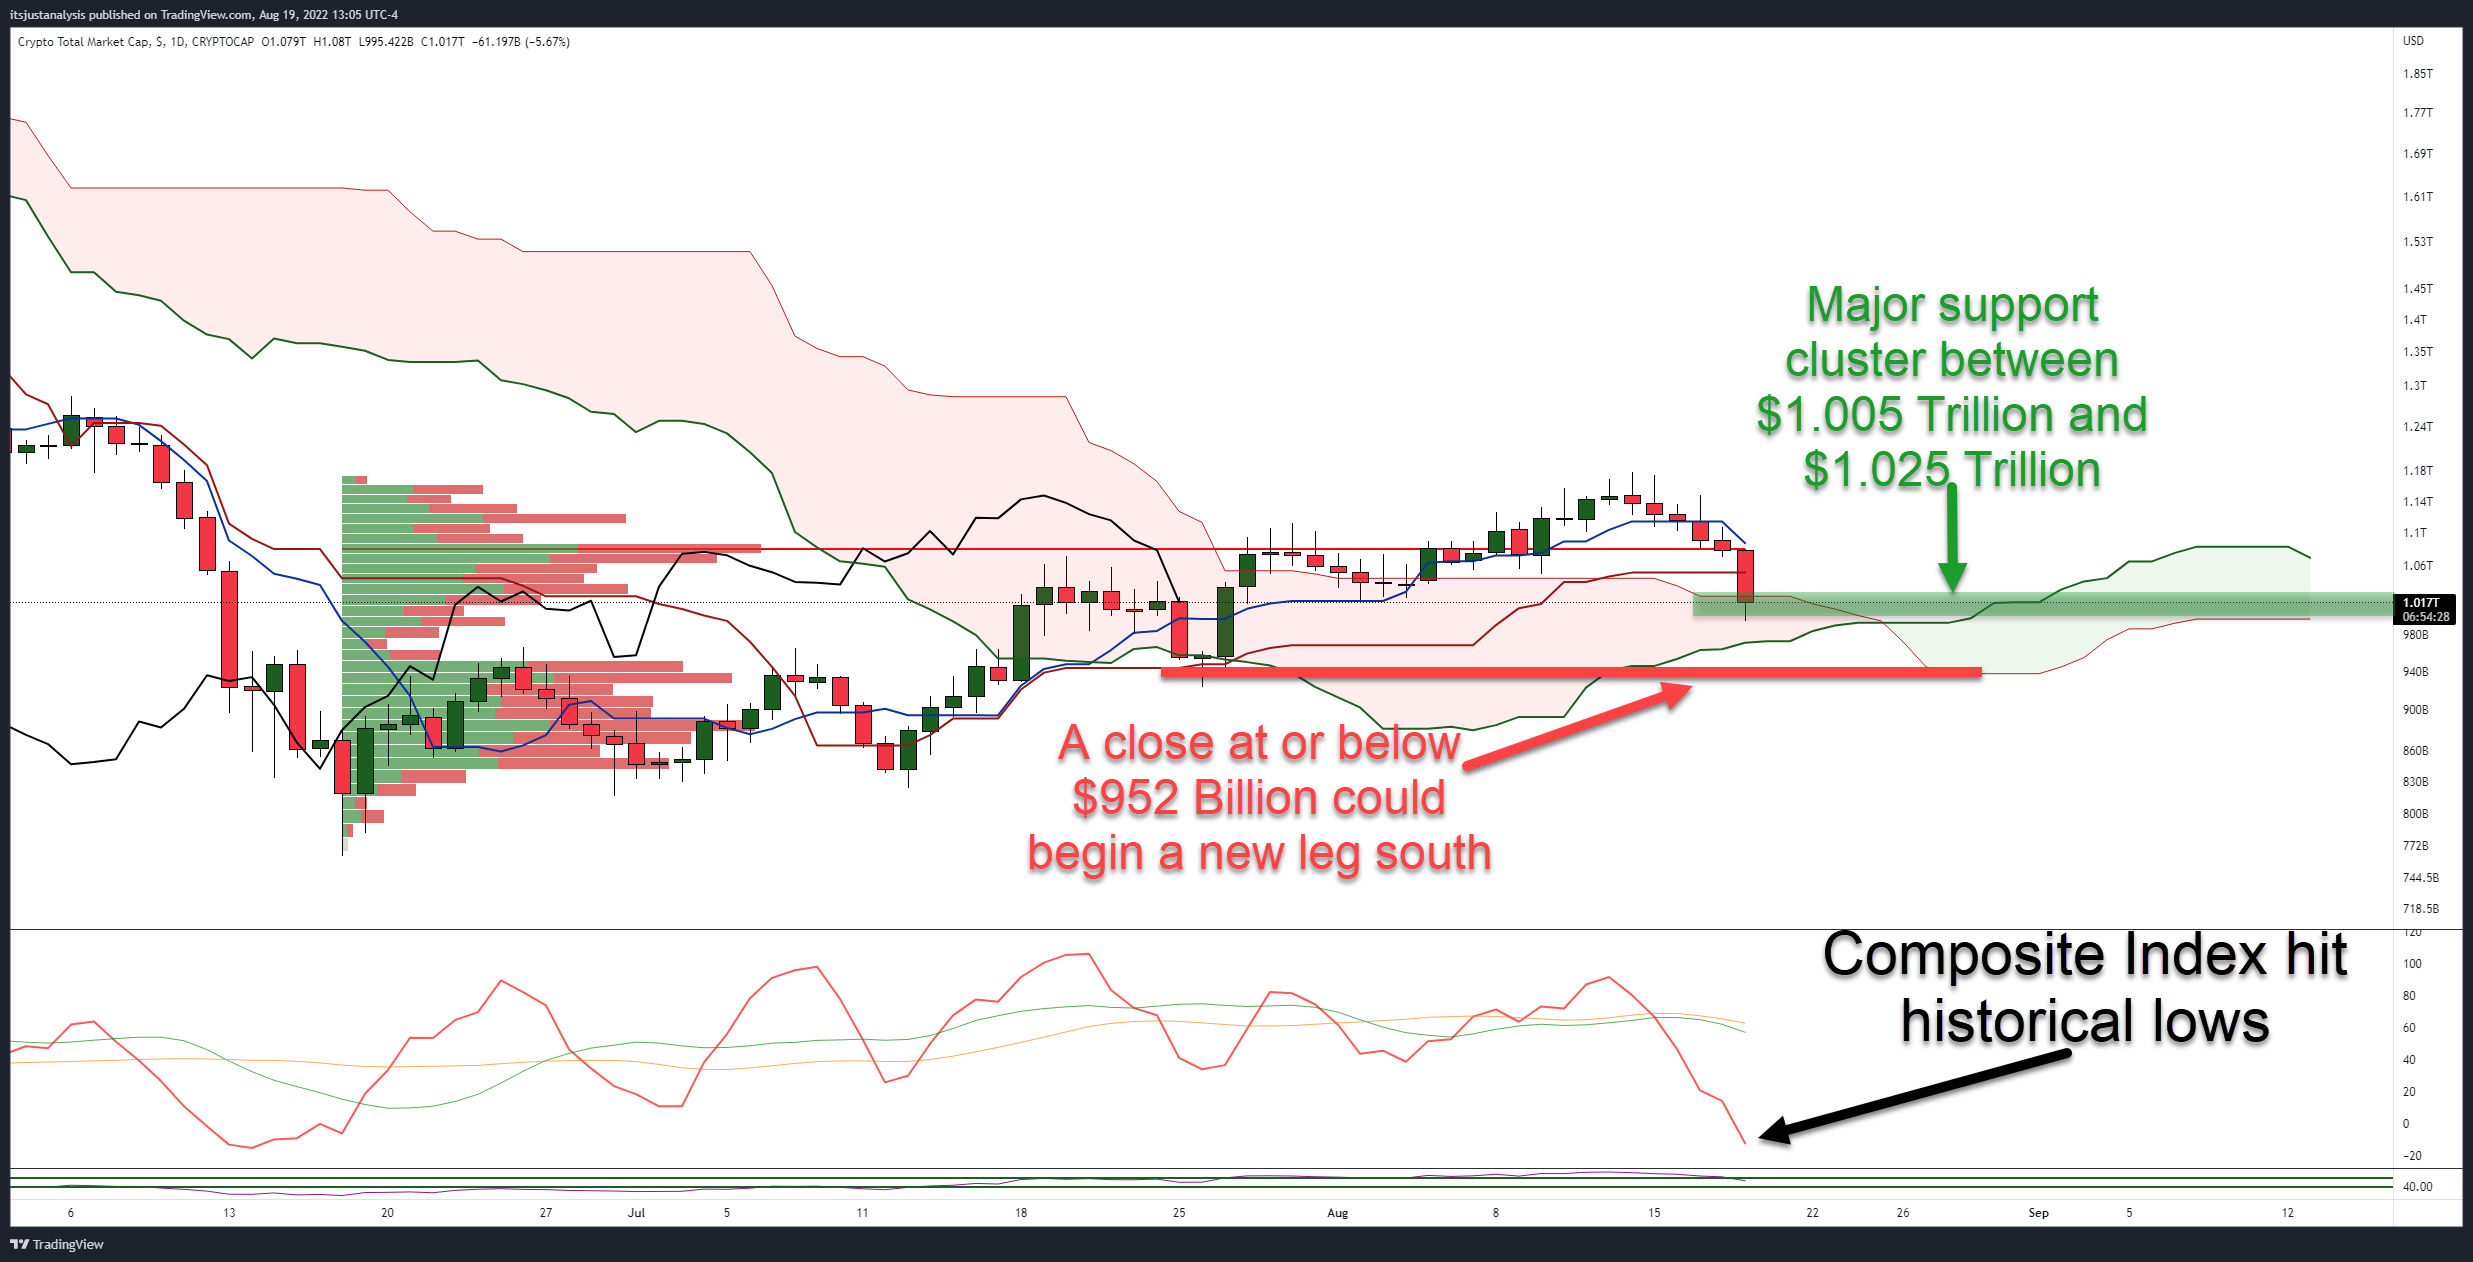
While it doesn’t look like it on the daily chart, there is a crazy amount of technical support between $1.005 and 1.025 trillion. The strongest level of support/resistance within the Ichimoku Kinko Hyo system is Senkou Span B, currently at $1.025 trillion. Just below Senkous Span B is a confluence of the 38.2% and 61.8% Fibonacci retracements near $1.005 trillion.
Pro-tip: Read our introduction to the Ichimoku Kinko Hyo system.
The Composite Index looks like a black lab puppy that broke free of its collar and is now booking it towards a flock of pigeons. While no divergence is present, the discrepancy between the slopes of the candlestick chart and the Composite Index is extreme – the Composite Index fell into historical lows, warning of major oversold conditions.
For bulls, things look bleak but most definitely oversold. Bears, on the other hand, are likely cautiously optimistic. From an Ichimoku perspective, it’s a waiting game. A clear signal that the bear market is likely returning will occur if the Total Market Cap closes below the Ichimoku Cloud, at or below $952 billion.
All in all, expect a lot of chop and whipsaws. The thresholds for the market to convert into a full-blown bull market or the resumption of the bear market are very close and likely to trap many traders and investors. 📊