Ichimoku is not an indicator (many platforms incorrectly label it an indicator) – it is a full analysis and trading system comprised of five different indicators.
Goichi Hosada, the creator of the Ichimoku system, created Ichimoku to be an upgraded version of Japanese candlesticks. If you want to get technical (see what I did there?), using Japanese candlesticks without Ichimoku is like using Windows 95 instead of Windows 11.
Ichimoku Kinko Hyo History
David Linton’s book, Cloud Charts – Trading Success with the Ichimoku Technique, and Nicole Elliot’s book, Ichimoku Charts – An Introduction to Ichimoku Kinko Clouds, provide an excellent and concise history of both Japanese candlesticks and Goichi Hosada’s time spent creating Ichimoku.
The translation for Ichimoku Kinko Hyo is this: At a glance (Ichimoku), Balance (Kinko), and Bar Chart (Hyo). The most important word here is Kinko, for balance.
Experienced traders in Japanese theory and pedagogy will know that one of the most important characteristics of Japanese technical analysis is the focus on balance and equilibrium. This trait is constant in the Ichimoku system. Moreover, the emphasis on equilibrium and balance is consistent in other Japanese chart forms (Heiken-Ashi and Renko).
Be sure to check the end of this article for my suggestions on authors and books worth checking out.
The Ichimoku Kinko Hyo System
What is singularly fascinating about this trading system more than any other is that it includes nearly every primary Technical Analysis tool in a single system with just five components. Even people who may have a passing familiarity with the Ichimoku Kinko Hyo system will be shocked to learn that Ichimoku has its own momentum, volatility, breadth, and depth measurements.
Additionally, Hosada developed the Three Principles as part of his system. The Three Principles include a Time, Price, and Wave principle. Followers of Gann and Hurst Cycle Analysis will find the Time Principle interesting and complimentary. Likewise, Ellioticians will see Hosada’s Wave Principle of interest as well. But those will be discussed in another article.
The 5 Components that make up the Ichimoku system
You will likely observe that the system consists of several moving averages. Remember the importance of ‘balance’ and ‘equilibrium’ in Japanese technical analysis. Ichimoku moving averages are calculated by determining the average midpoint of a period’s highest high and lowest low.
A quick note regarding the nomenclature of this system: Depending on the charting software you are using, the labels for the components will be in Japanese or your native language. For traders utilizing software like TradingView, TradingView utilizes non-Japanese labels. It’s a good idea to learn both.
- Tenkan-Sen (Turning Line or Conversion Line)
- Kijun-Sen (Standard Line or Base Line)
- Senkou Span A (Cloud Span A, Span A, or Span 1)
- Senkou Span B (Cloud Span B, Span B, Span 2)
- Chikou Span (Lagging Line or Lagging Span)
Tenkan-Sen (Conversion Line)
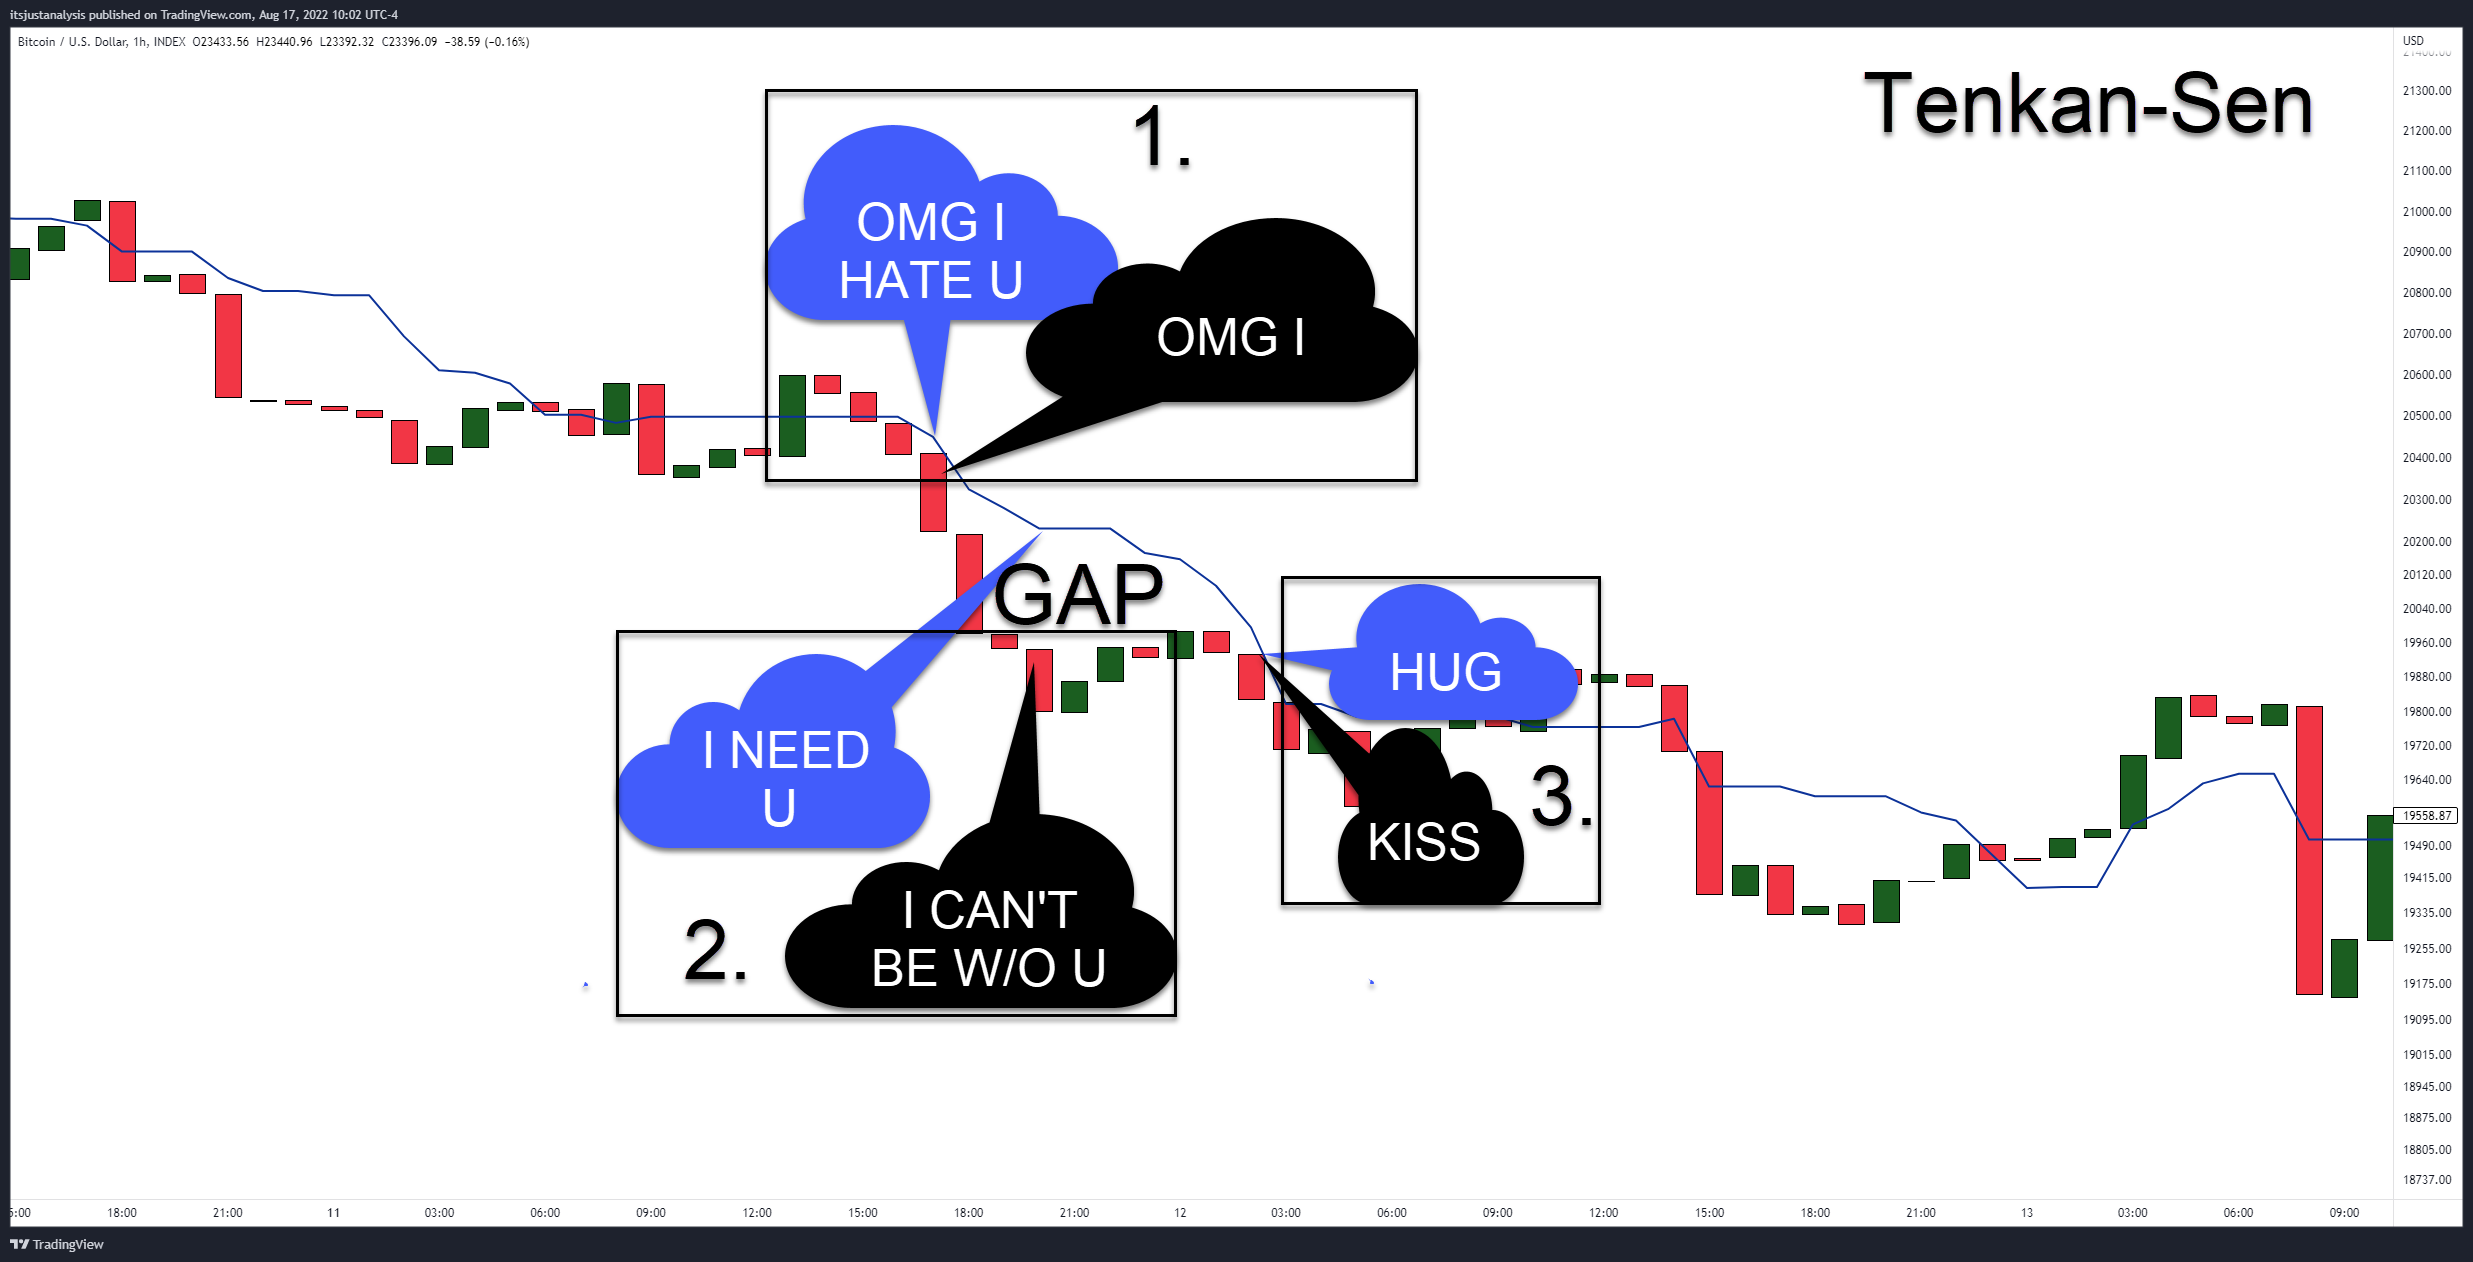
The first component of the Ichimoku Kinko system is the Tenkan-Sen. The Tenkan-Sen is the fastest and weakest line of the Ichimoku system. It is a 9-period moving average plotted by adding the highest high and lowest low of the last 9-periods and then dividing that number by two.
Price and the Tenkan-Sen are like an unhealthy co-dependent couple. They can’t stand each other most of the time but, damnit, if they don’t get all sorts of freaked out if they’re too far apart.
Key Points
- Price should not be very far away from the Tenkan-Sen.
- If price and the Tenkan-Sen are both moving close together (up or down), then there is little volatility, and the move may be very persistent. Experts warn of trading against an instrument that is displaying this behavior.
- Gaps between the bodies of candlesticks and the Tenkan-Sen do not last long. Therefore, if you notice large gaps between the bodies of candlesticks and the Tenkan-Sen, there is a high probability that price will move back to the Tenkan-Sen over the next five to eight periods.
Pro-tip: If you have a problem identifying gaps between the Tenkan-Sen and the bodies of the candlesticks, remove the wicks like the image below.
Kijun-Sen (Base Line)
The second component of the Ichimoku Kinko Hyo system is the Kijun-Sen. The Kijun-Sen represents medium-term movement and equilibrium. It is a 26-period moving average plotted by adding the highest high and lowest low of the last 26 periods and then dividing that number by two.
Gaps between the bodies of candlesticks and the Kijun-Sen can be massive and exist for long periods. But, instead of an unhealthy co-dependent relationship, price and the Kijun-Sen are like Ben Affleck and J-Lo. They both run off and do their thing, but deep down, they love each other and run back into each other’s arms, professing their love.
Key Points
- Many entries and exit signals are derived from the Kijun-Sen (Peliolle).
- Price should not be very far away from the Kijun-Sen.
- Use an ATR x2 to gauge how far is ‘too far.’ (Patel)
The Kumo (Cloud) – Senkou Span A and Senkou Span B
The Kumo (Cloud) is made up of the third and fourth components of the Ichimoku Kinko Hyo system, Senkou Span A and Senkou Span B. The ‘Cloud’ is the most distinguishing feature of the Ichimoku system. The Cloud is nothing more than the space between the two averages of Senkou Span A and Senkou Span B.
Most software will then shade the area between these zones to correlate Senkou Span A’s position to Senkou Span B. If Senkou Span A is above Senkou Span B, the space is shaded green. If Senkou Span A is below Senkou Span B, the area is shaded red. The Cloud’s construction and interpretation can cause significant confusion for someone new to this system, so I will break it down.
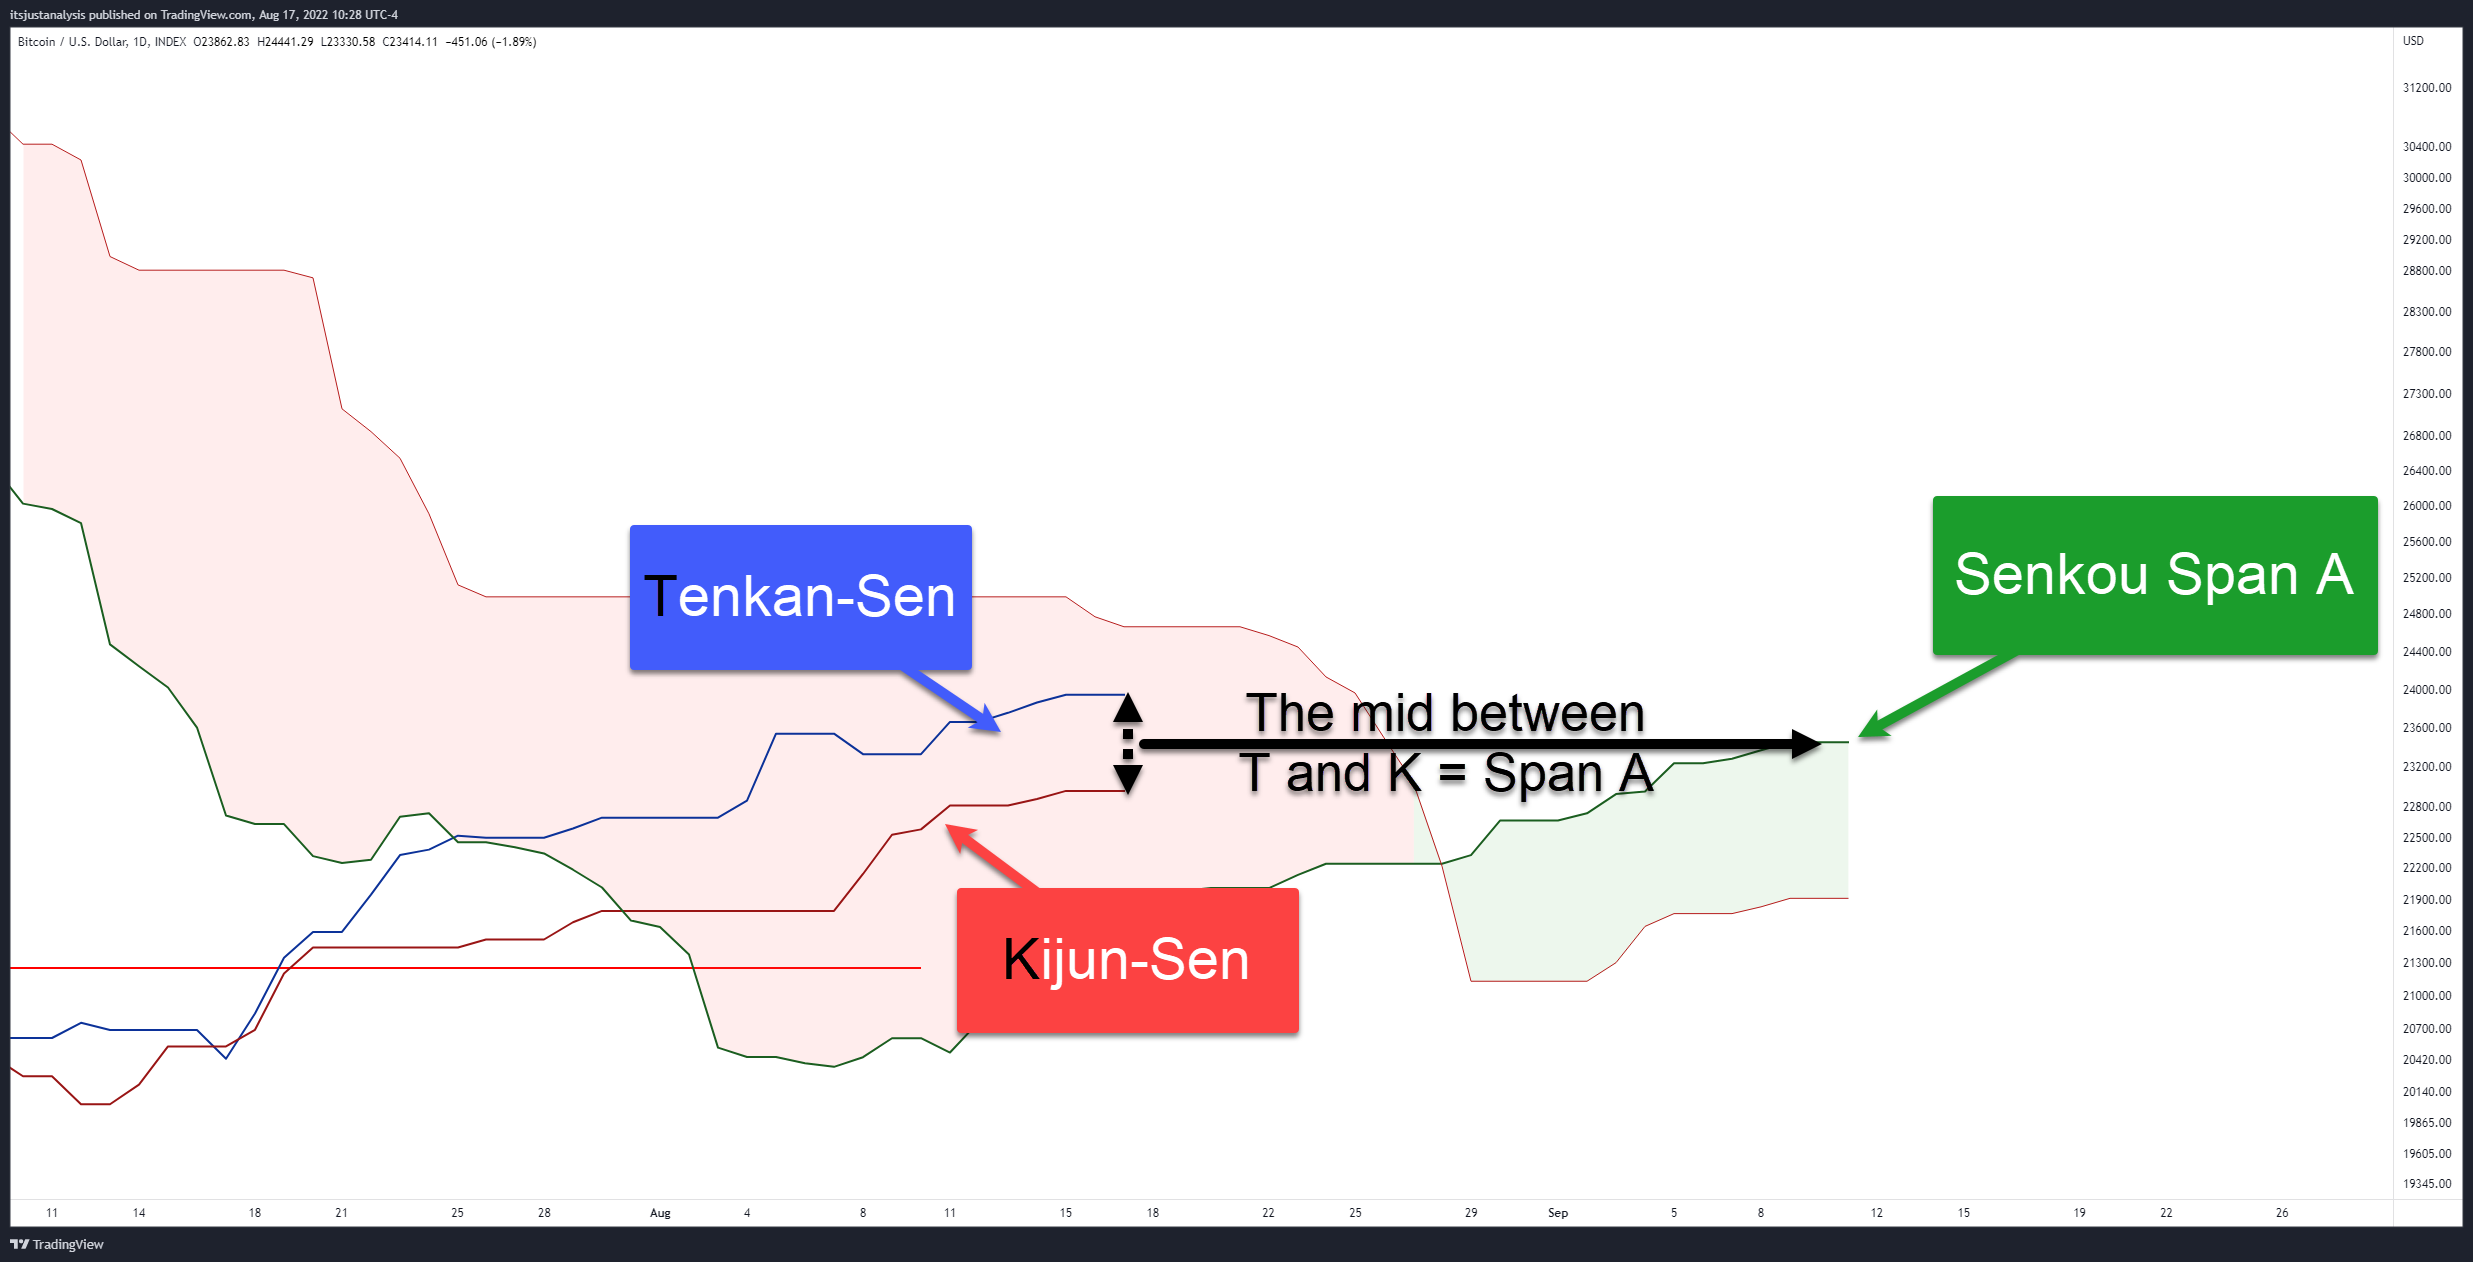
Senkou Span A is the ‘faster’ line and measures market balance and past volatility. (Peliolle) Senkou Span A is the midpoint between the Tenkan-Sen and Kijun-Sen, which is then projected forward 26 periods.
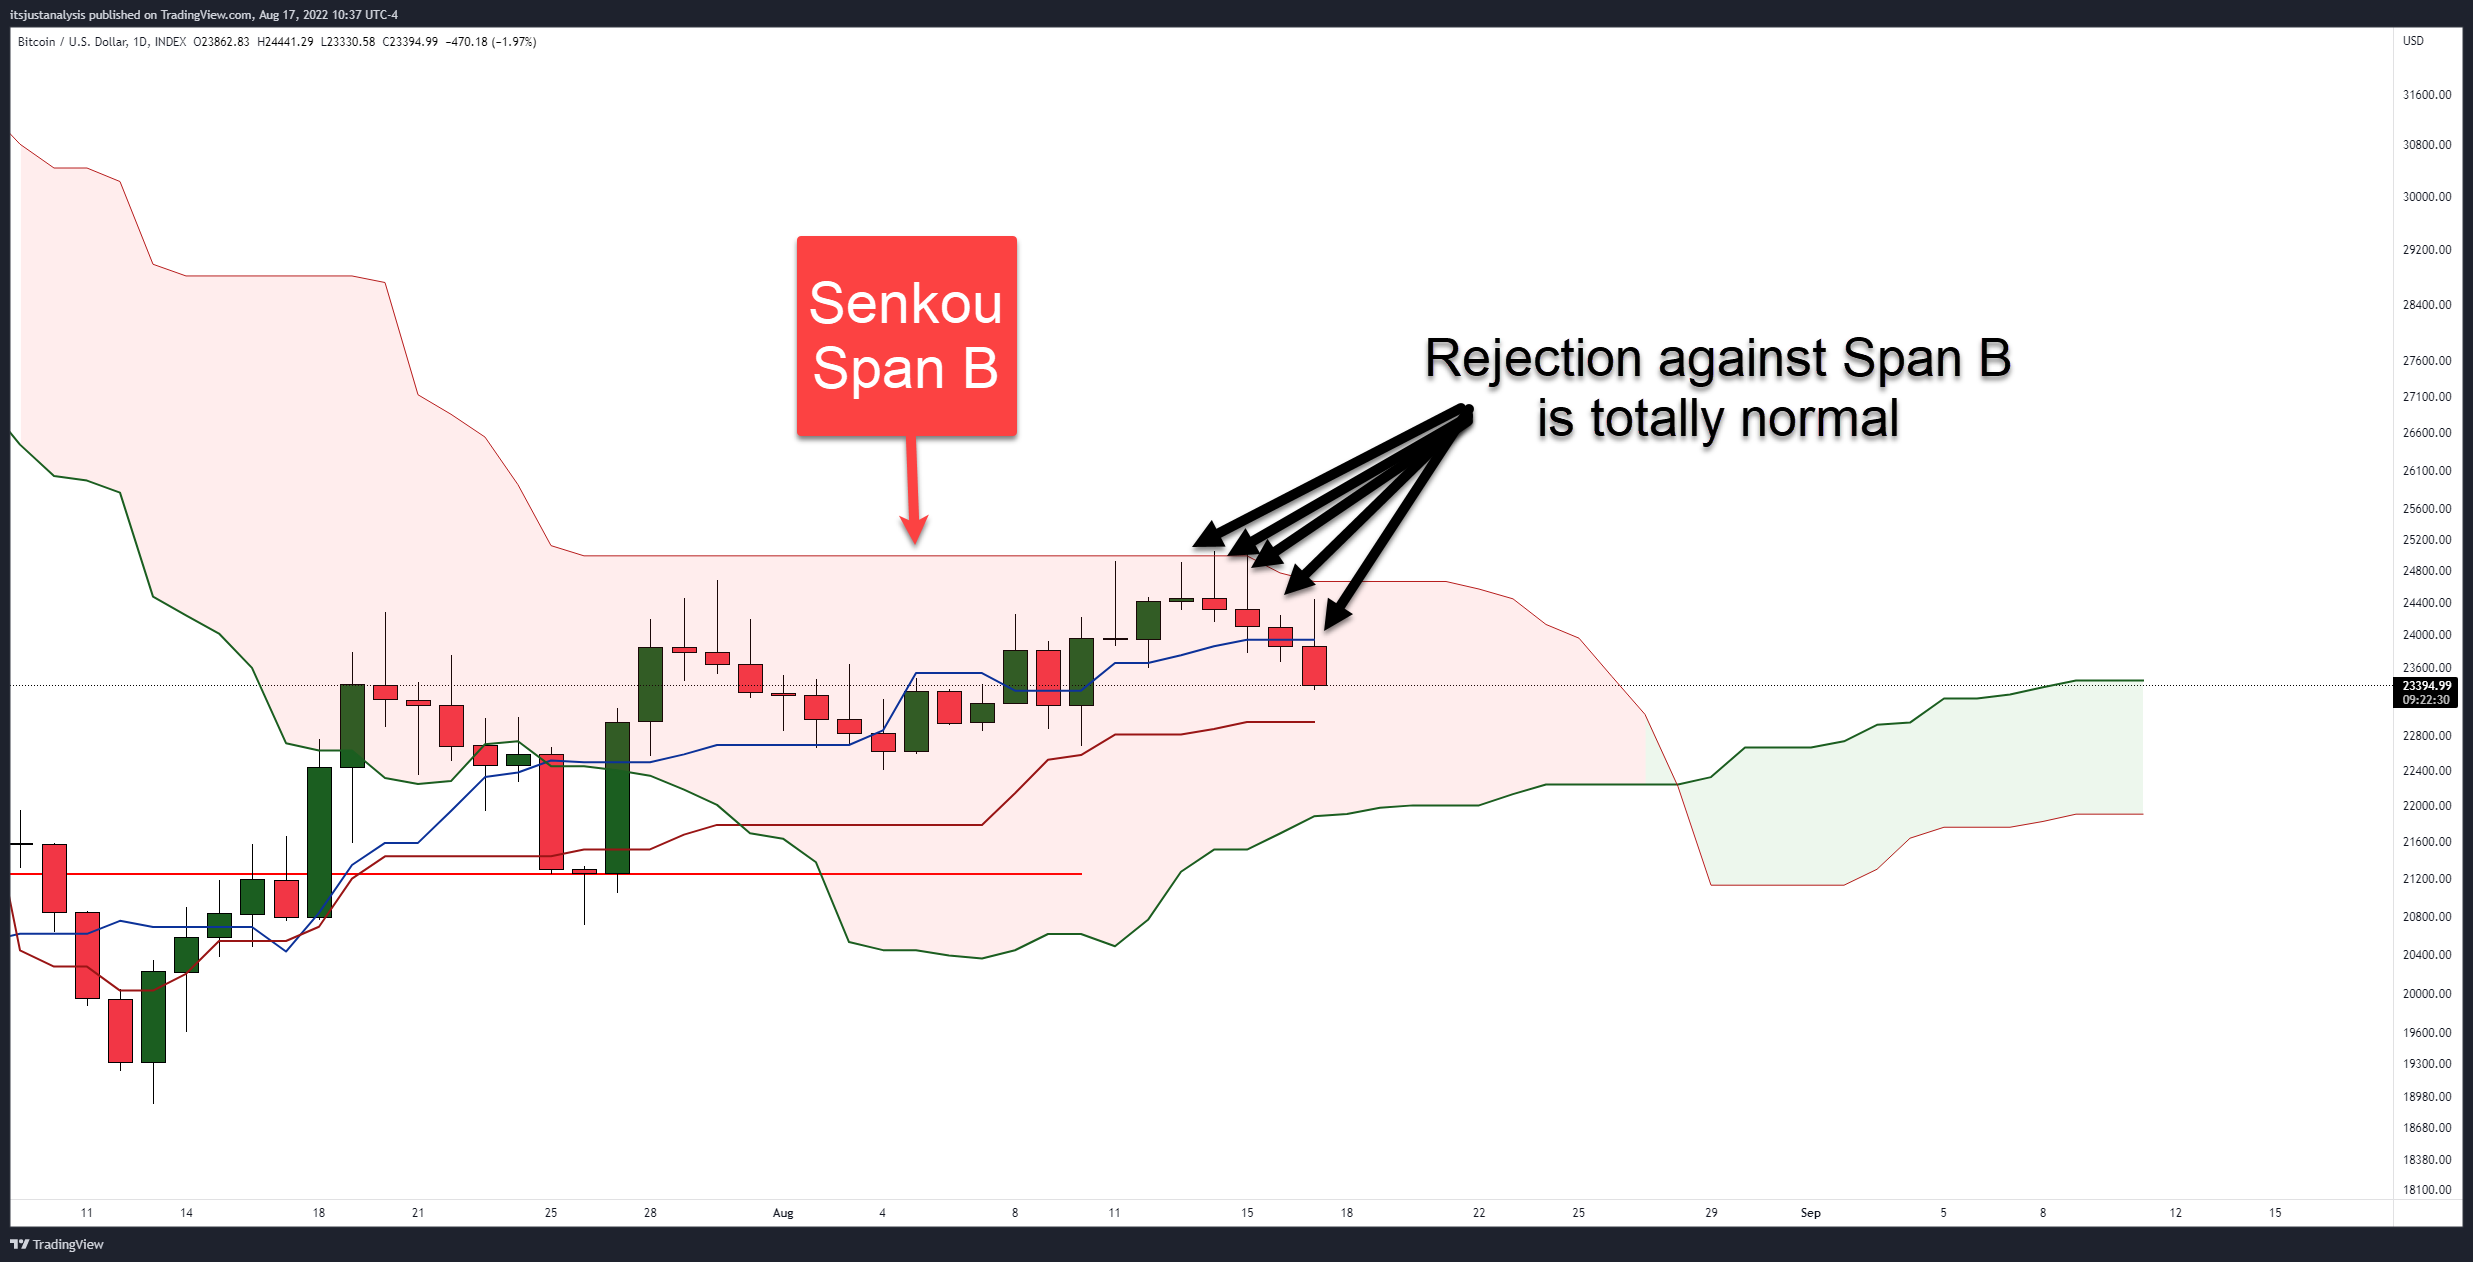
Senkou Span B is the most powerful support and resistance level in the Ichimoku Kinko Hyo system. Senkou Span B is the average of the highest high and lowest low of the past 52 periods shifted forward 26 periods.
Key Points
- A flat Senkou Span B represents strength.
- Thick Clouds equal strength. Thick Clouds also represent consolidation. (Linton)
- Kumo Twists (Senkou Span A crossing Senkou Span B) can indicate likely changes in trend. Sometimes a Kumo Twist is the most immediately visible sign of a trend change. (Linton)
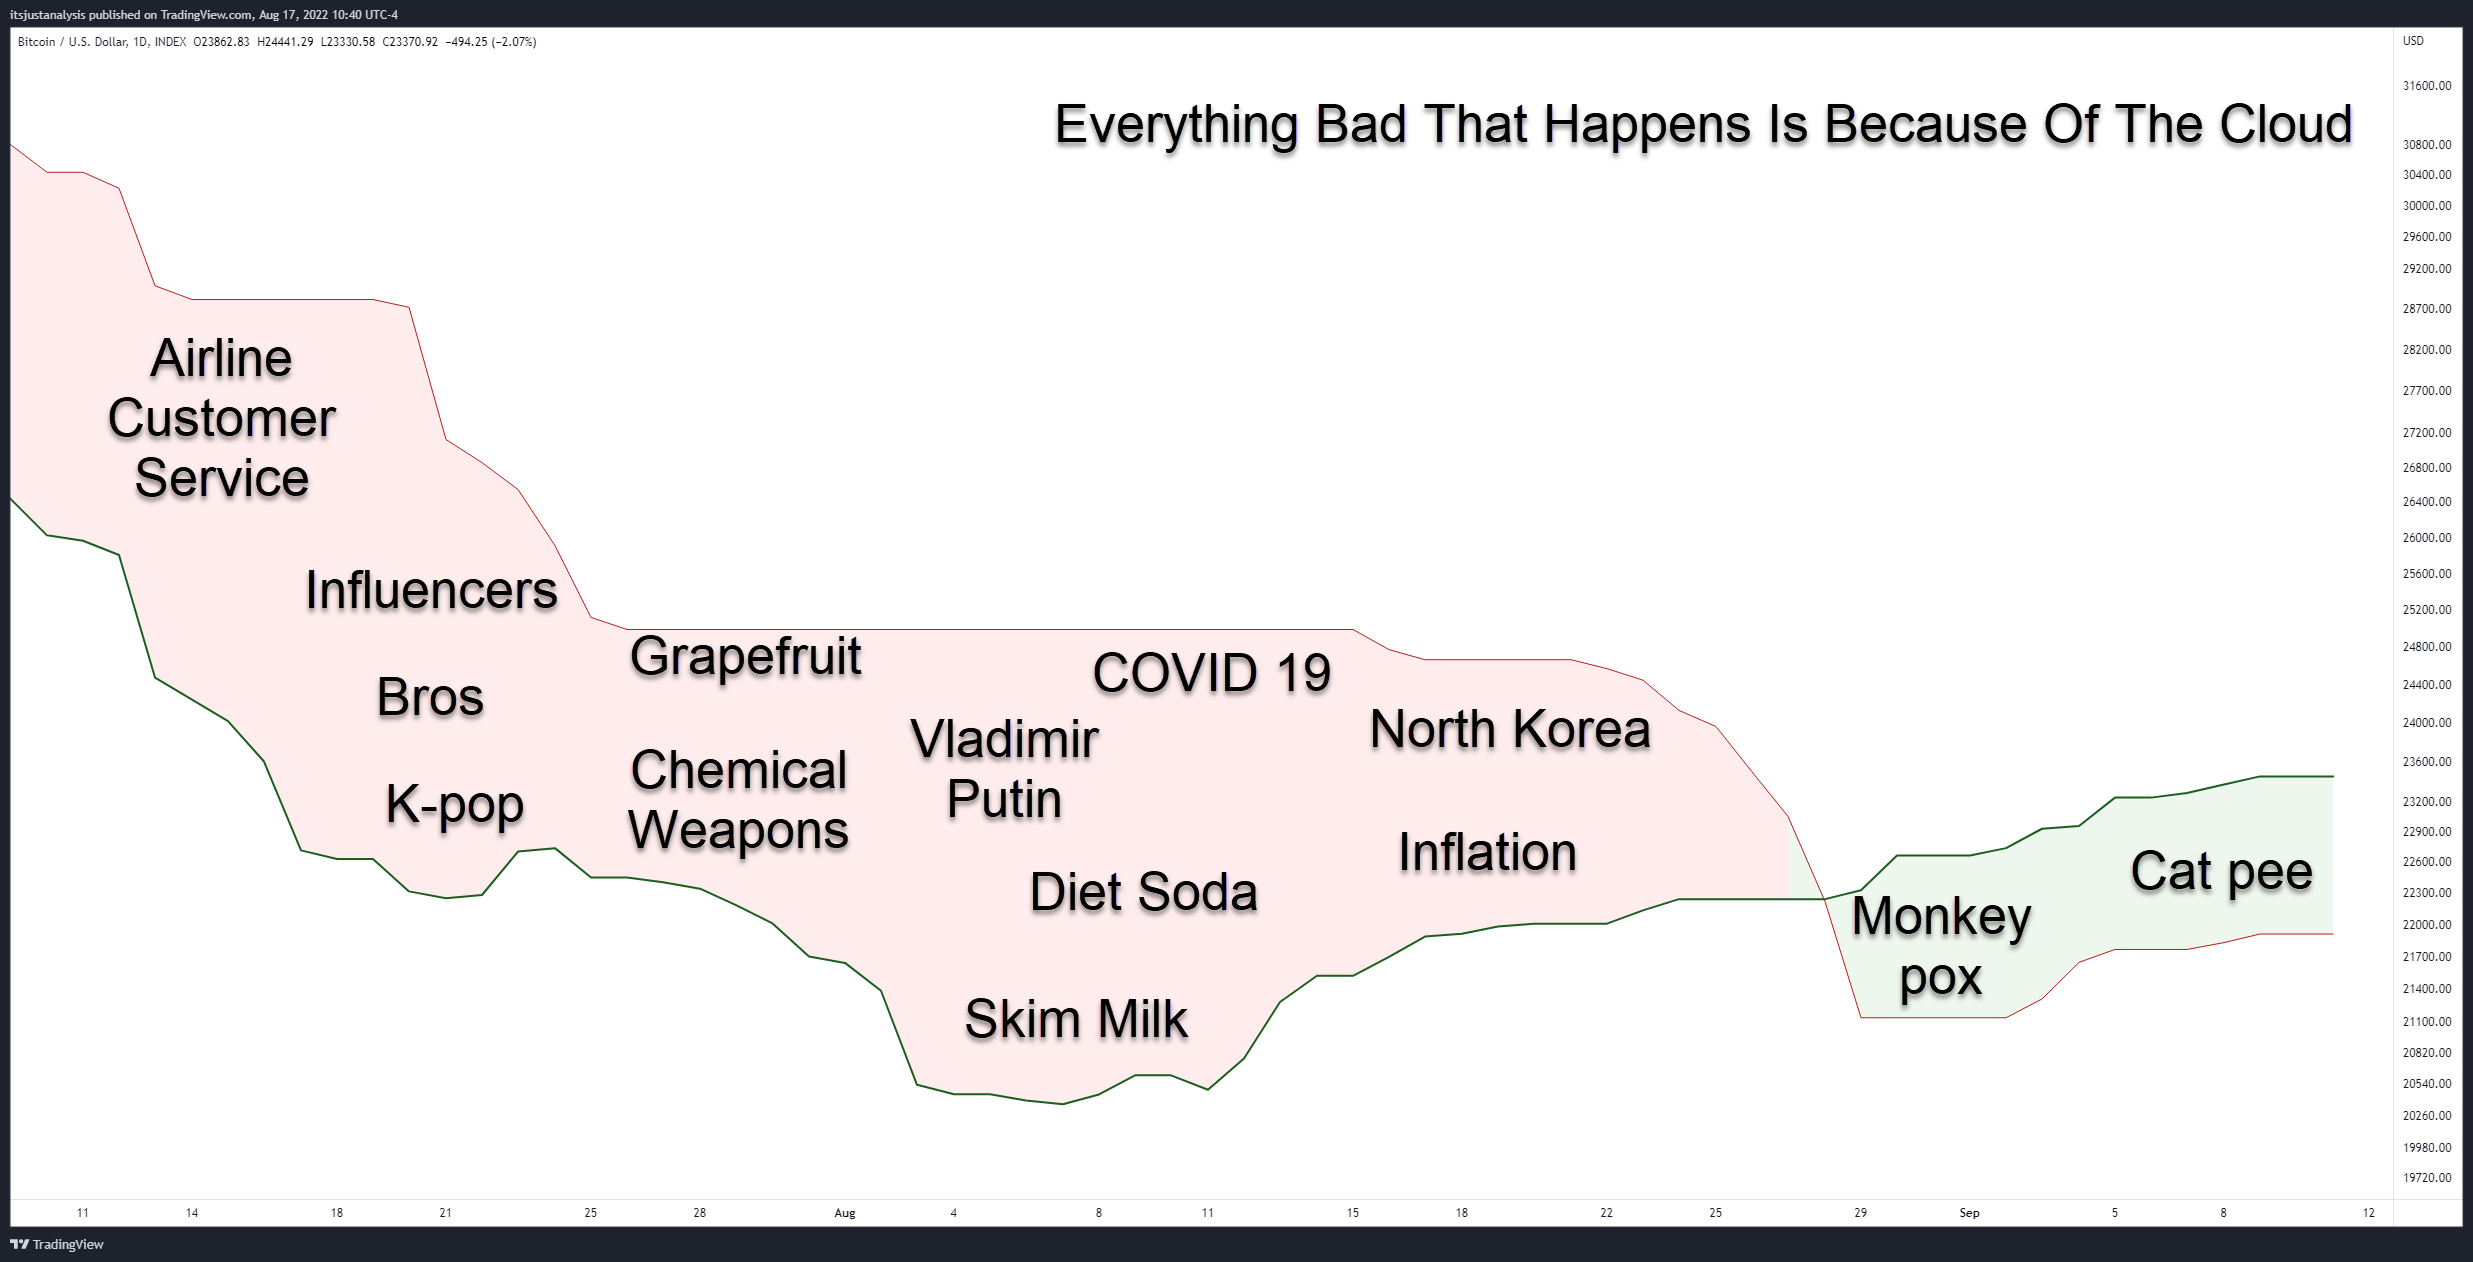
- The Cloud represents volatility, indecision, and general horribleness.
The First Question You Should Ask Yourself
When using the Ichimoku Kinko Hyo system, the first question you should ask yourself is this: Is price inside the Cloud? If the answer is yes, then ignore that chart. Leave it alone. Find something else to do; find another chart to look at. That chart is dead to you if price is inside the Cloud.
The Chikou Span (Lagging Span)
The fifth and final component of the Ichimoku Kinko Hyo system is the Chikou Span. It’s that mysterious moving average way off to the left of everything else in the middle of nowhere. Except it’s not a moving average! I believe that this is the secret weapon of the entire system.
I’ve read and observed a shocking number of people disregard the Chikou Span and treat it like it’s some pointless component that is not needed like it’s the gallbladder, and just cut it out and think everything’s going to be just fine. That is a horrible idea.
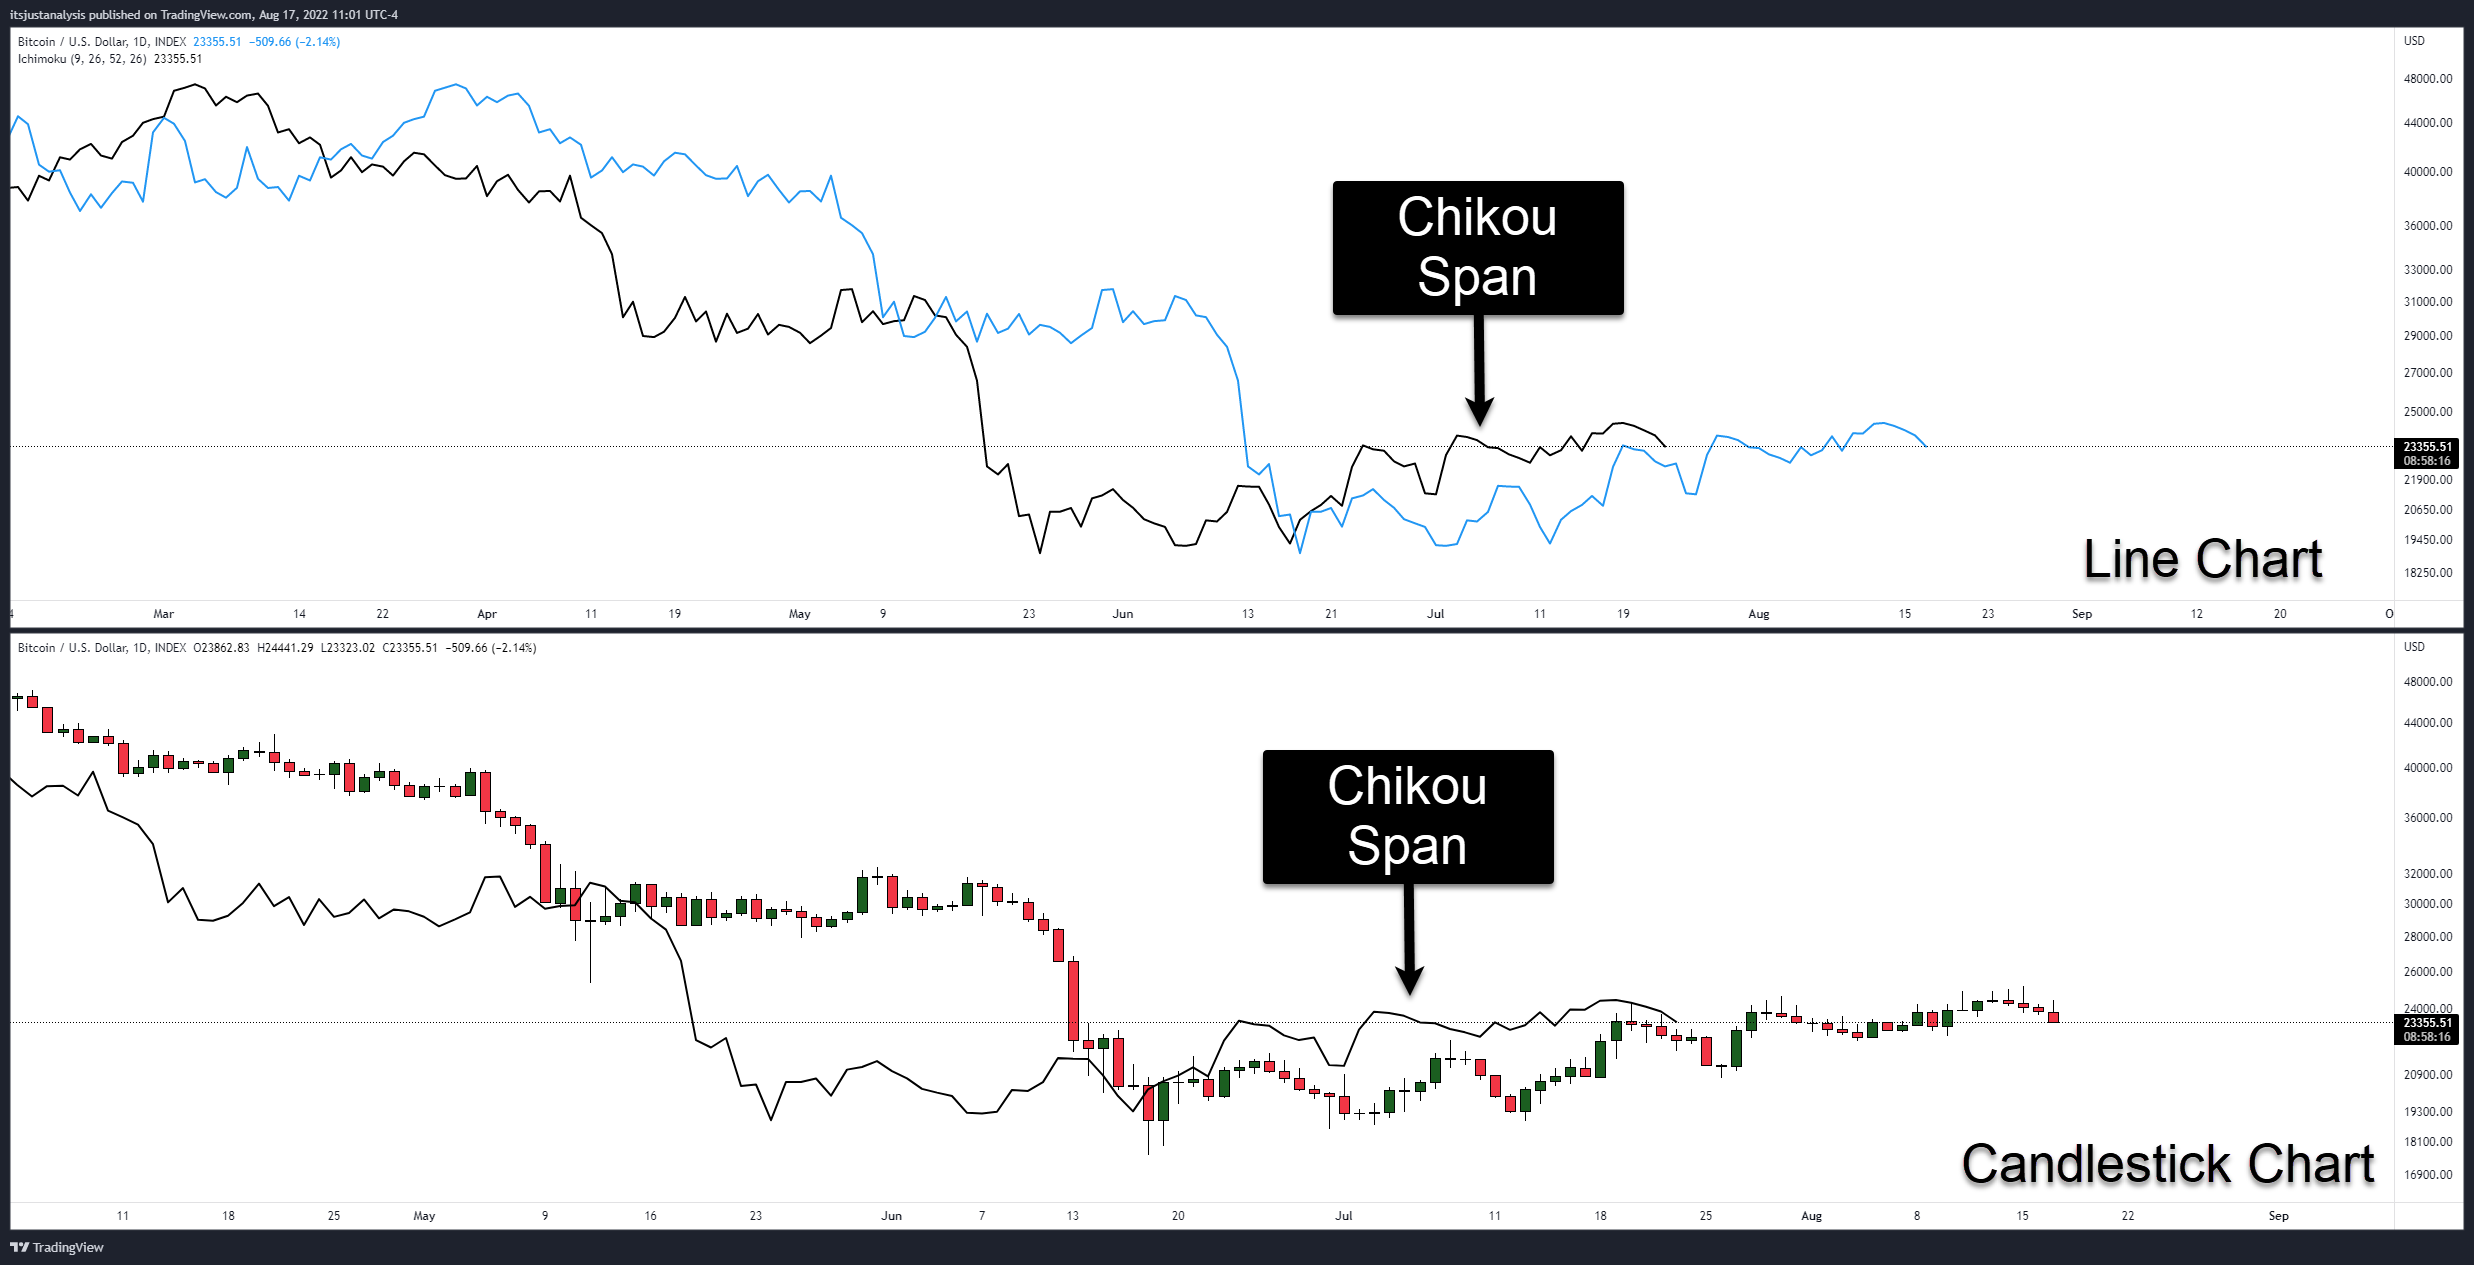
The Chikou Span is very, very simple and requires no averaging. It is merely the current price action shifted back 26 periods. It’s like a mirror image of the current price action. Even though it is simple to understand, visualizing this line can be hard. Look at the image below:
The Chikou Span represents the market’s memory. (Peliolle) It represents momentum. (Patel) David Linton identified what I consider one of the most crucial signals that can be generated on an Ichimoku chart. David Linton wrote that the Chikou Span, “is THE confirmation signal in Ichimoku Analysis.” (Linton)
Key Points
- Look for when the Chikou Span is in ‘Open Space.’ Manesh Patel identified Open Space as a condition when the Chikou Span won’t intercept any candlesticks over the next 5 to 10 periods. This indicates a much easier move for price with almost no supportive/resistive structure to stop price.
- The market is beginning to consolidate if the Chikou Span trades ‘inside’ the candlesticks.
- The Chikou Span responds to the same support and resistance levels as price. (Peliolle)
Why 9, 26, and 52?
One of the biggest questions people will ask is, why does the Ichimoku system utilize the periods of 9, 26, and 52? Much of this concerns history and Japan’s normal trading week. A trading week in Japan was six days, so 9 is 1.5 weeks. (Elliot). There are roughly 26 trading sessions in a month. (Elliot) 52 is approximately two full trading months. Do not change these values.
Let me repeat that.
Do. Not. Change. Those. Values.
You can change your timeframes but never change the base Ichimoku settings. You will read people give reasons why you should do it for this market and that market. You will read reasons why using Western values is useful for Western traders. You will hear many reasons why you should change the base values. Don’t.
The Ichimoku Kinko Hyo system is time-tested and robust trading and analysis system. So don’t muck it up by introducing variables that are not a part of the system. Unless one of the experts says it’s cool to change it, best to not do it.
This is a start, but it’s not everything
There will be more over the Ichimoku Kinko Hyo system in the near future. This article does not sufficiently explain all the ins and outs of the system, nor how to apply it, but it provides a good base and a foundation of understanding of what makes this system tick.
Excellent books on the Ichimoku Kinko Hyo system
There’s a bunch of crap out there folks. For example, one search on Amazon.com ($AMZN) and you’ll see a crap ton of self-published, Kindle-only Ichimoku guides that are absolute crap. The books listed below are ones I selected because they are written by industry experts. But don’t take my word for it; do your research and due diligence.
Because I know people will ask, “Well, which one should I get first?” I’d have to suggest Koonitz’s book because it’s the most recent of the bunch that was published and because he leaves out a lot of the ‘filler’ that too many trading and technical analysis books have. That means he left out the watered-down Technical Analysis 101 of 50 pages that take up a 60-page book.
Ichimoku Charting and Technical Analysis – Charles D. Koonitz
Trading with Ichimoku: a practical guide to low-risk Ichimoku strategies. – Karen Peliolle
Trading with Ichimoku Cloud: the essential guide to Ichimoku Kinko Hyo technical analysis – Manesh Patel
Cloud Charts: trading success with the Ichimoku technique – David Linton
Ichimoku Charts: An introduction to Ichimoku Kinko Cloud – Nicole Elliot