The Merge came. The Merge was complete. The Merge was a success. The hype was real. Ethereum went green, and the planet was happy.
But price action showed a fairly standard version of Buy The Rumor, Sell The News.
Now, if you watch the market every day, it’s easy to get tunnel vision and have some recency bias. It’s hard to forget that Ethereum ($ETH.X) did pamp from the June 18 swing low of $880 to the most recent swing high on August 14 at $2,031 – roughly a +130% gain.
Even considering yesterday’s sell-off, Ethereum is still up over 60% from the June lows.
But that’s not what has some people worried – it’s the decentralization function that was supposed to happen. It’s still early, but so far, Ethereum looks more centralized now than it ever has been. At the time of writing, nearly 300 blocks are validated.
And two – yes, just two addresses were responsible for 45% of the blocks. If the wallets are correct, the staking service Lido and Coinbase ($COIN) are accountable for those blocks. Making the centralization even worse is that over 50% of the nodes are hosted on AWS (Amazon Web Services).
From a technical analysis perspective, things look spectacularly bleak for Ethereum.

The blue shaded zone represents a very thin zone in the Volume Profile between two high volume nodes at $1,434 and $1,242. A swift sell-off could occur if ETH closes at or below $1,434. This is because analysts interpret moves below/above a high volume node to act like a vacuum where price gets sucked through the thin volume zones and into the next high volume node.
In other words, a close at or below $1,434 could generate a swift spike lower to $1,242.
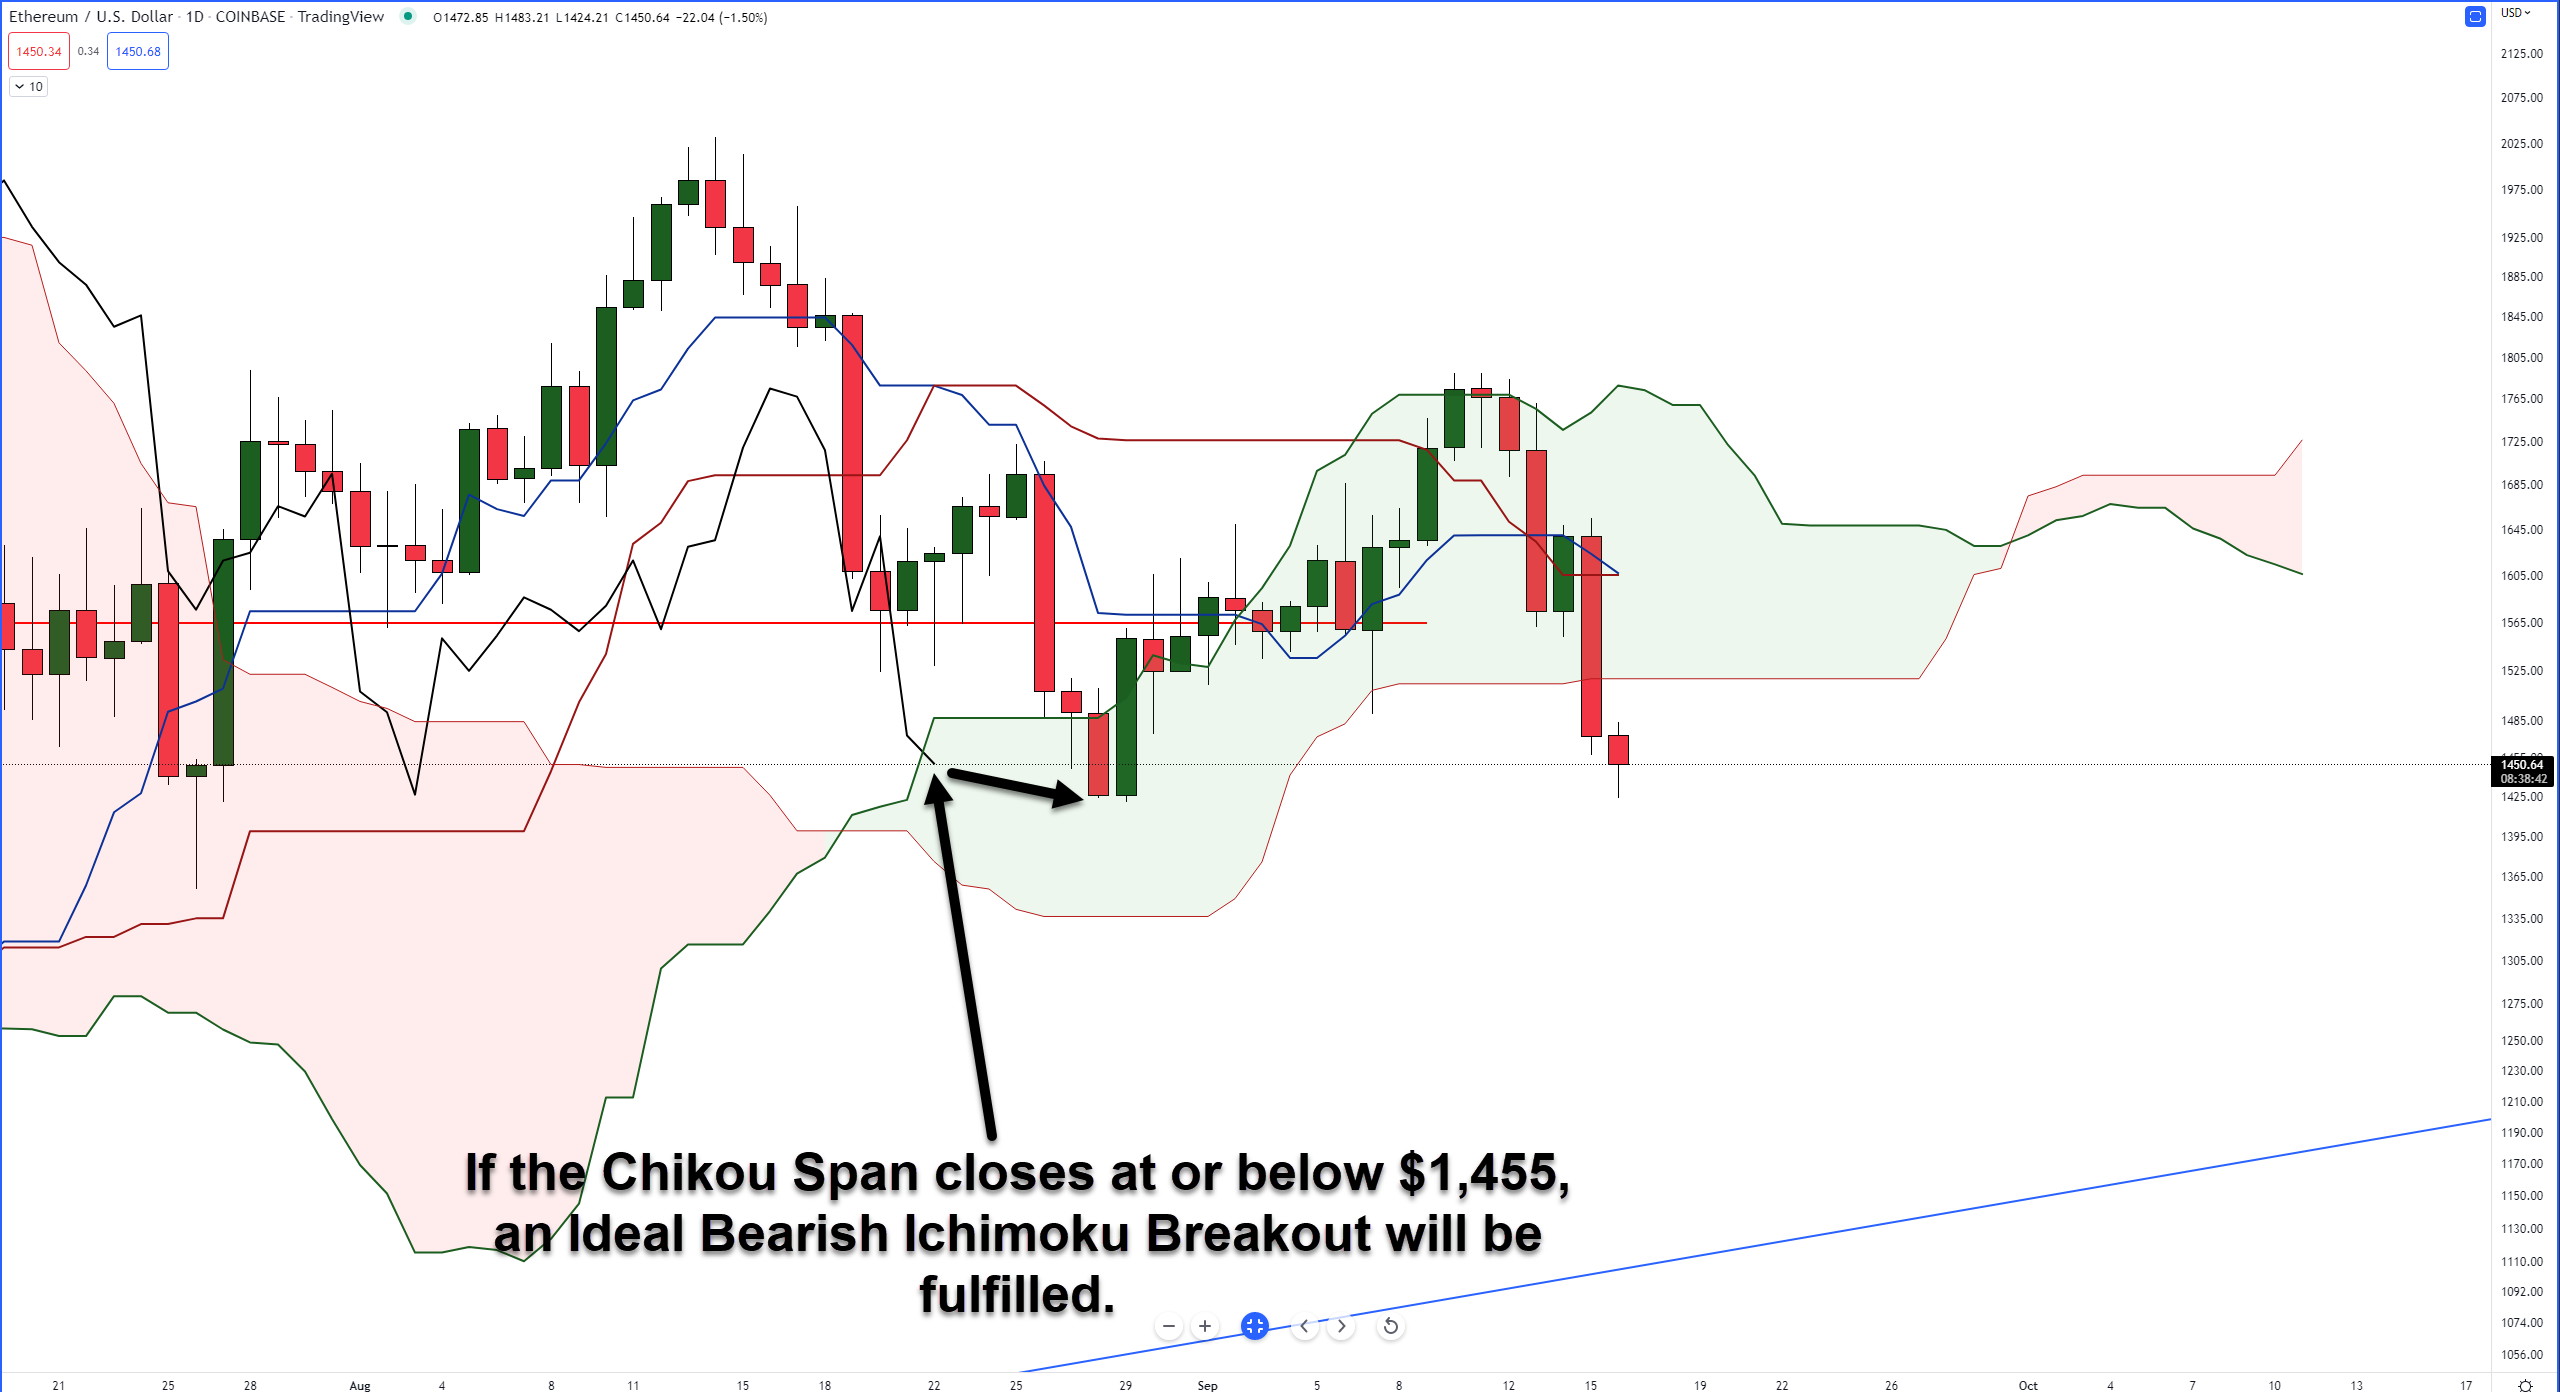
Another look at the daily chart for Ethereum with the Ichimoku Kinko Hyo system shows ETH could be positioned for another swift leg south. Yesterday’s close below the Cloud was incredibly bearish. In fact, one of the strongest bear signals in the Ichimoku system, the Ideal Bearish Ichimoku Breakout, is just one condition away from being fulfilled: The Chikou Span in open space.
For that to occur, Ethereum would need to close at or below $1,455. If bulls want to mitigate any further bearish momentum, they’ll need to close ETH at least back inside the Cloud near the $1,525 value area.
And keep a close on the Chikou Span; it responds to the same support and resistance levels as the current candlestick. It would be a very normal situation for Ethereum to dip down to the $1,340 level, where it would be well below the Cloud, only to bounce seemingly out of nowhere because of the Chikou Span finding support against the bottom of the Cloud (Senkou Span B).