There’s lots of FUD in all markets this week – a good chunk of it related to an anticipated rate hike of 0.75 basis points from the US Federal Reserve. And that FUD transfers into crypto too, which has already been beaten down this year.
The choppiness will likely continue until the Fed data is finally dumped. Already the market has seen Bitcoin ($BTC.X) trade -by 3% today, only to recover almost all of those losses. Cardano ($ADA.X) traded almost -3.5% lower this morning and is now up +0.50%. Similar behavior exists across the crypto market.
Gann Seasonal Date – September 23rd
One of the fathers of Western technical analysis was W.D. Gann. Gann focused heavily on the importance of time and time cycles – to him, time was the reason markets moved and changed.
The date of September 23rd is an important date in Gann Analysis. Gann warned that any market that is in a strong trend could often reverse around this date and to watch for fast moves and changes in trends.
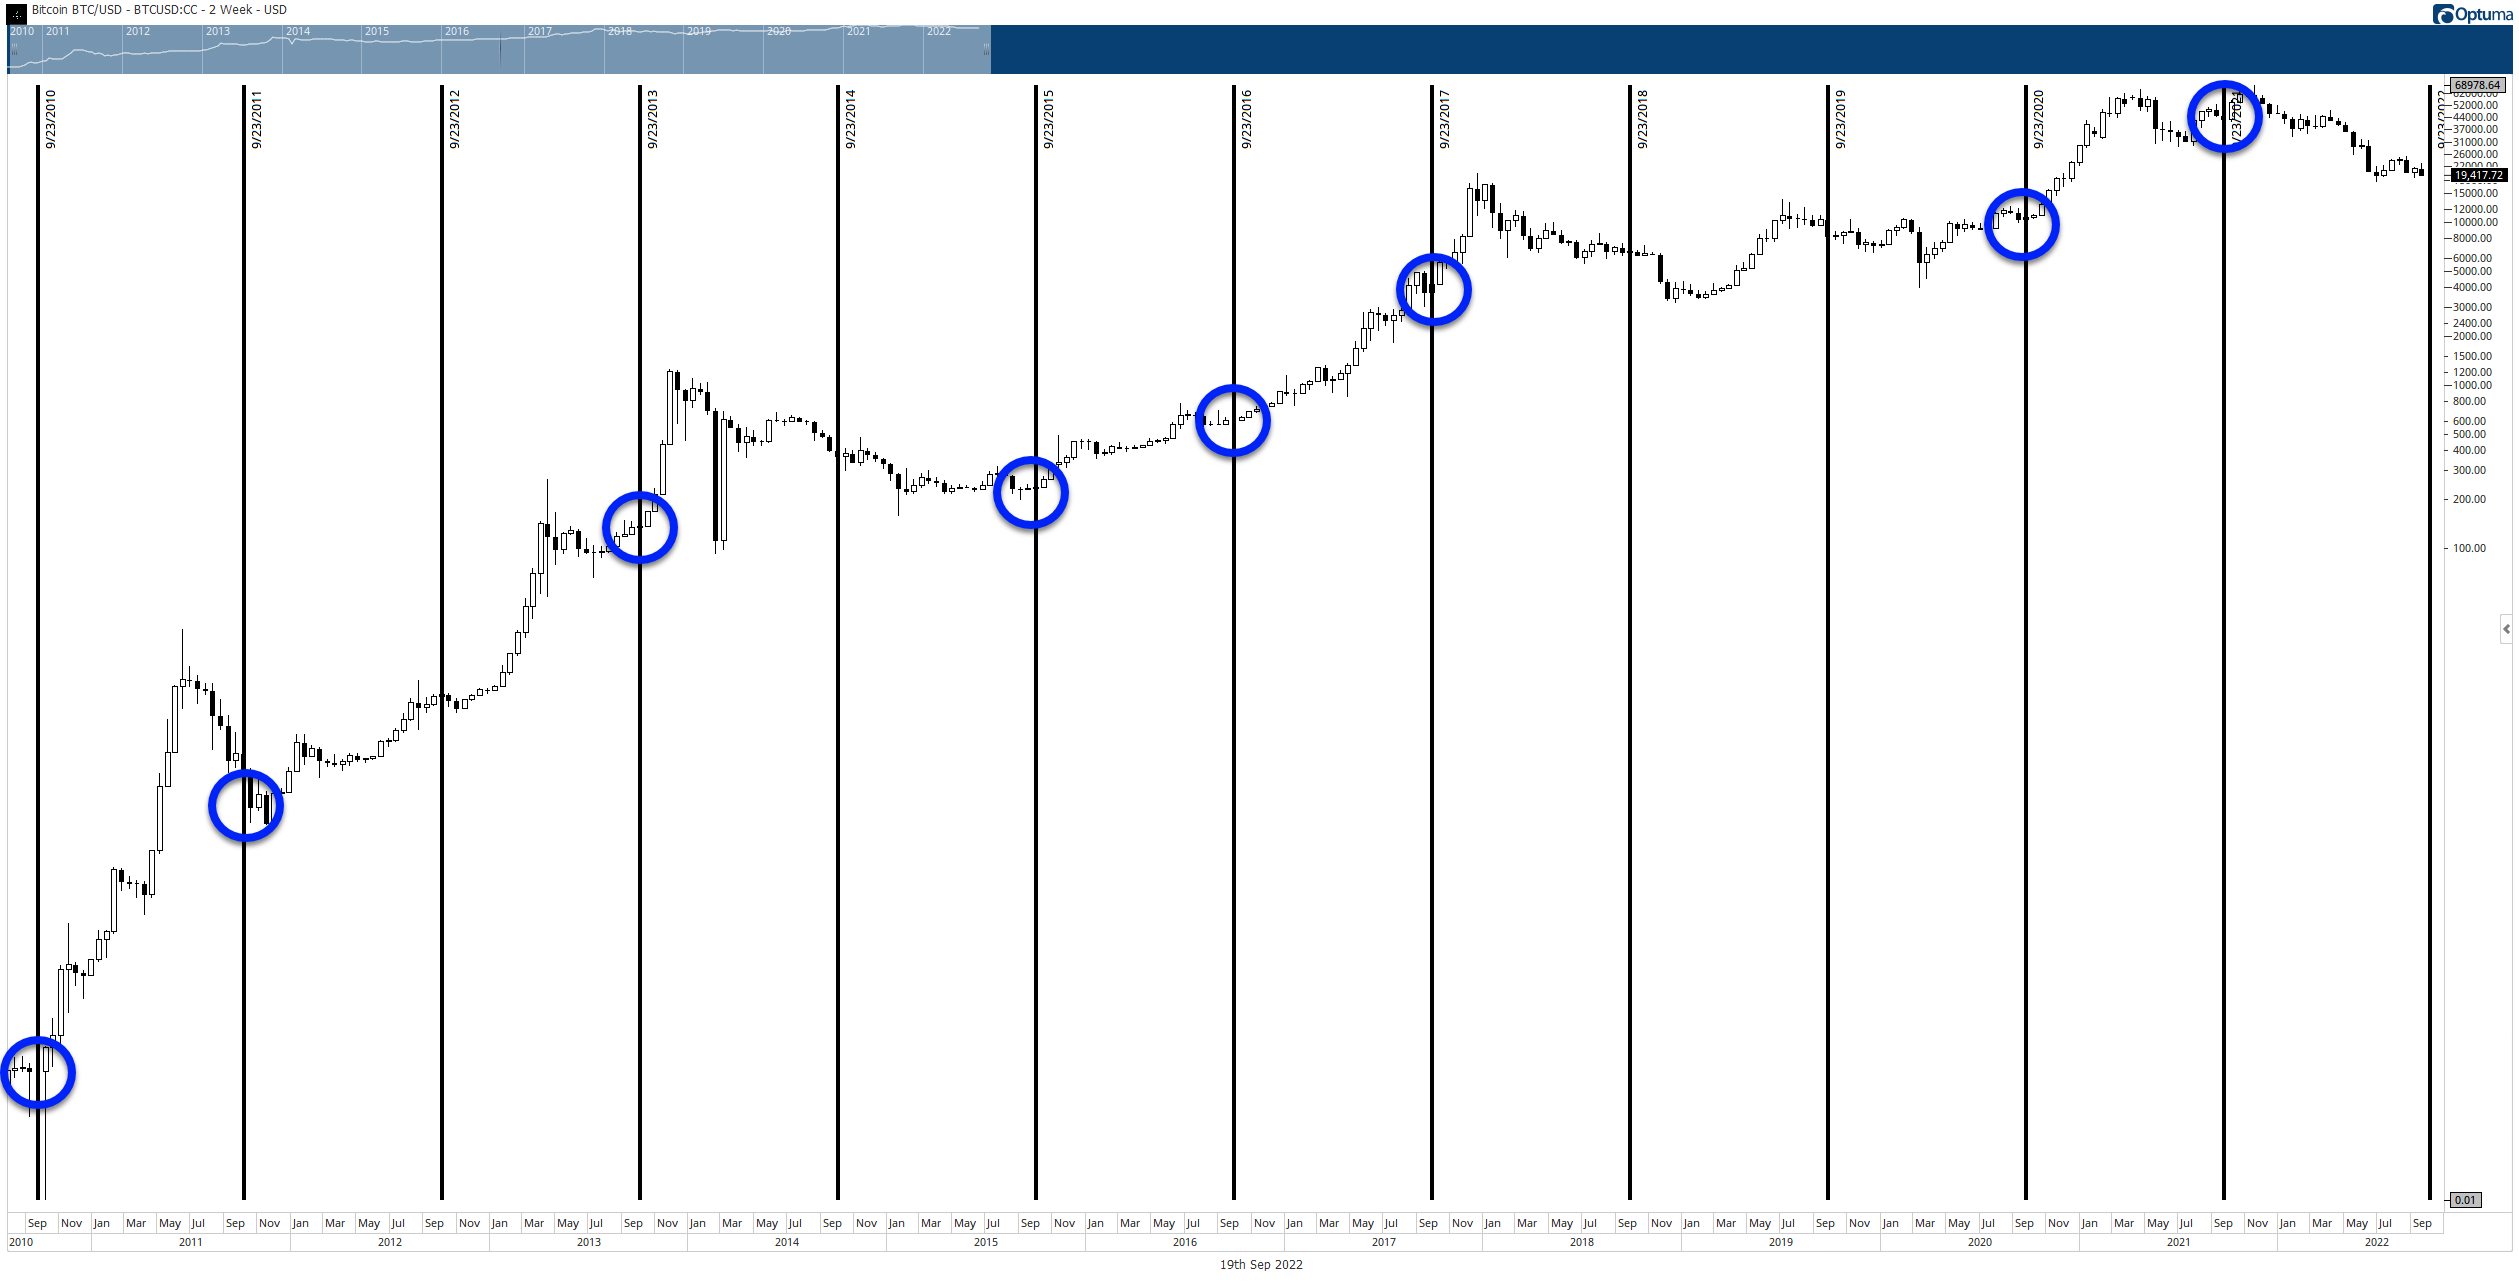
The chart above is a 2-week candlestick chart of Bitcoin ($BTC.X). The black vertical lines show every September 23rd going back to 2010. The blue circles indicate instances where Bitcoin begin a strong corrective move, continued a prior trend, and/or found a historical high/low.
What can be interpreted from that data? Analysts would argue that regardless of the direction price action moves or for how long price trades in a certain direction/trend, it’s very clear that around September 23rd, there is a very high probability of Bitcoin making a dramatic move.
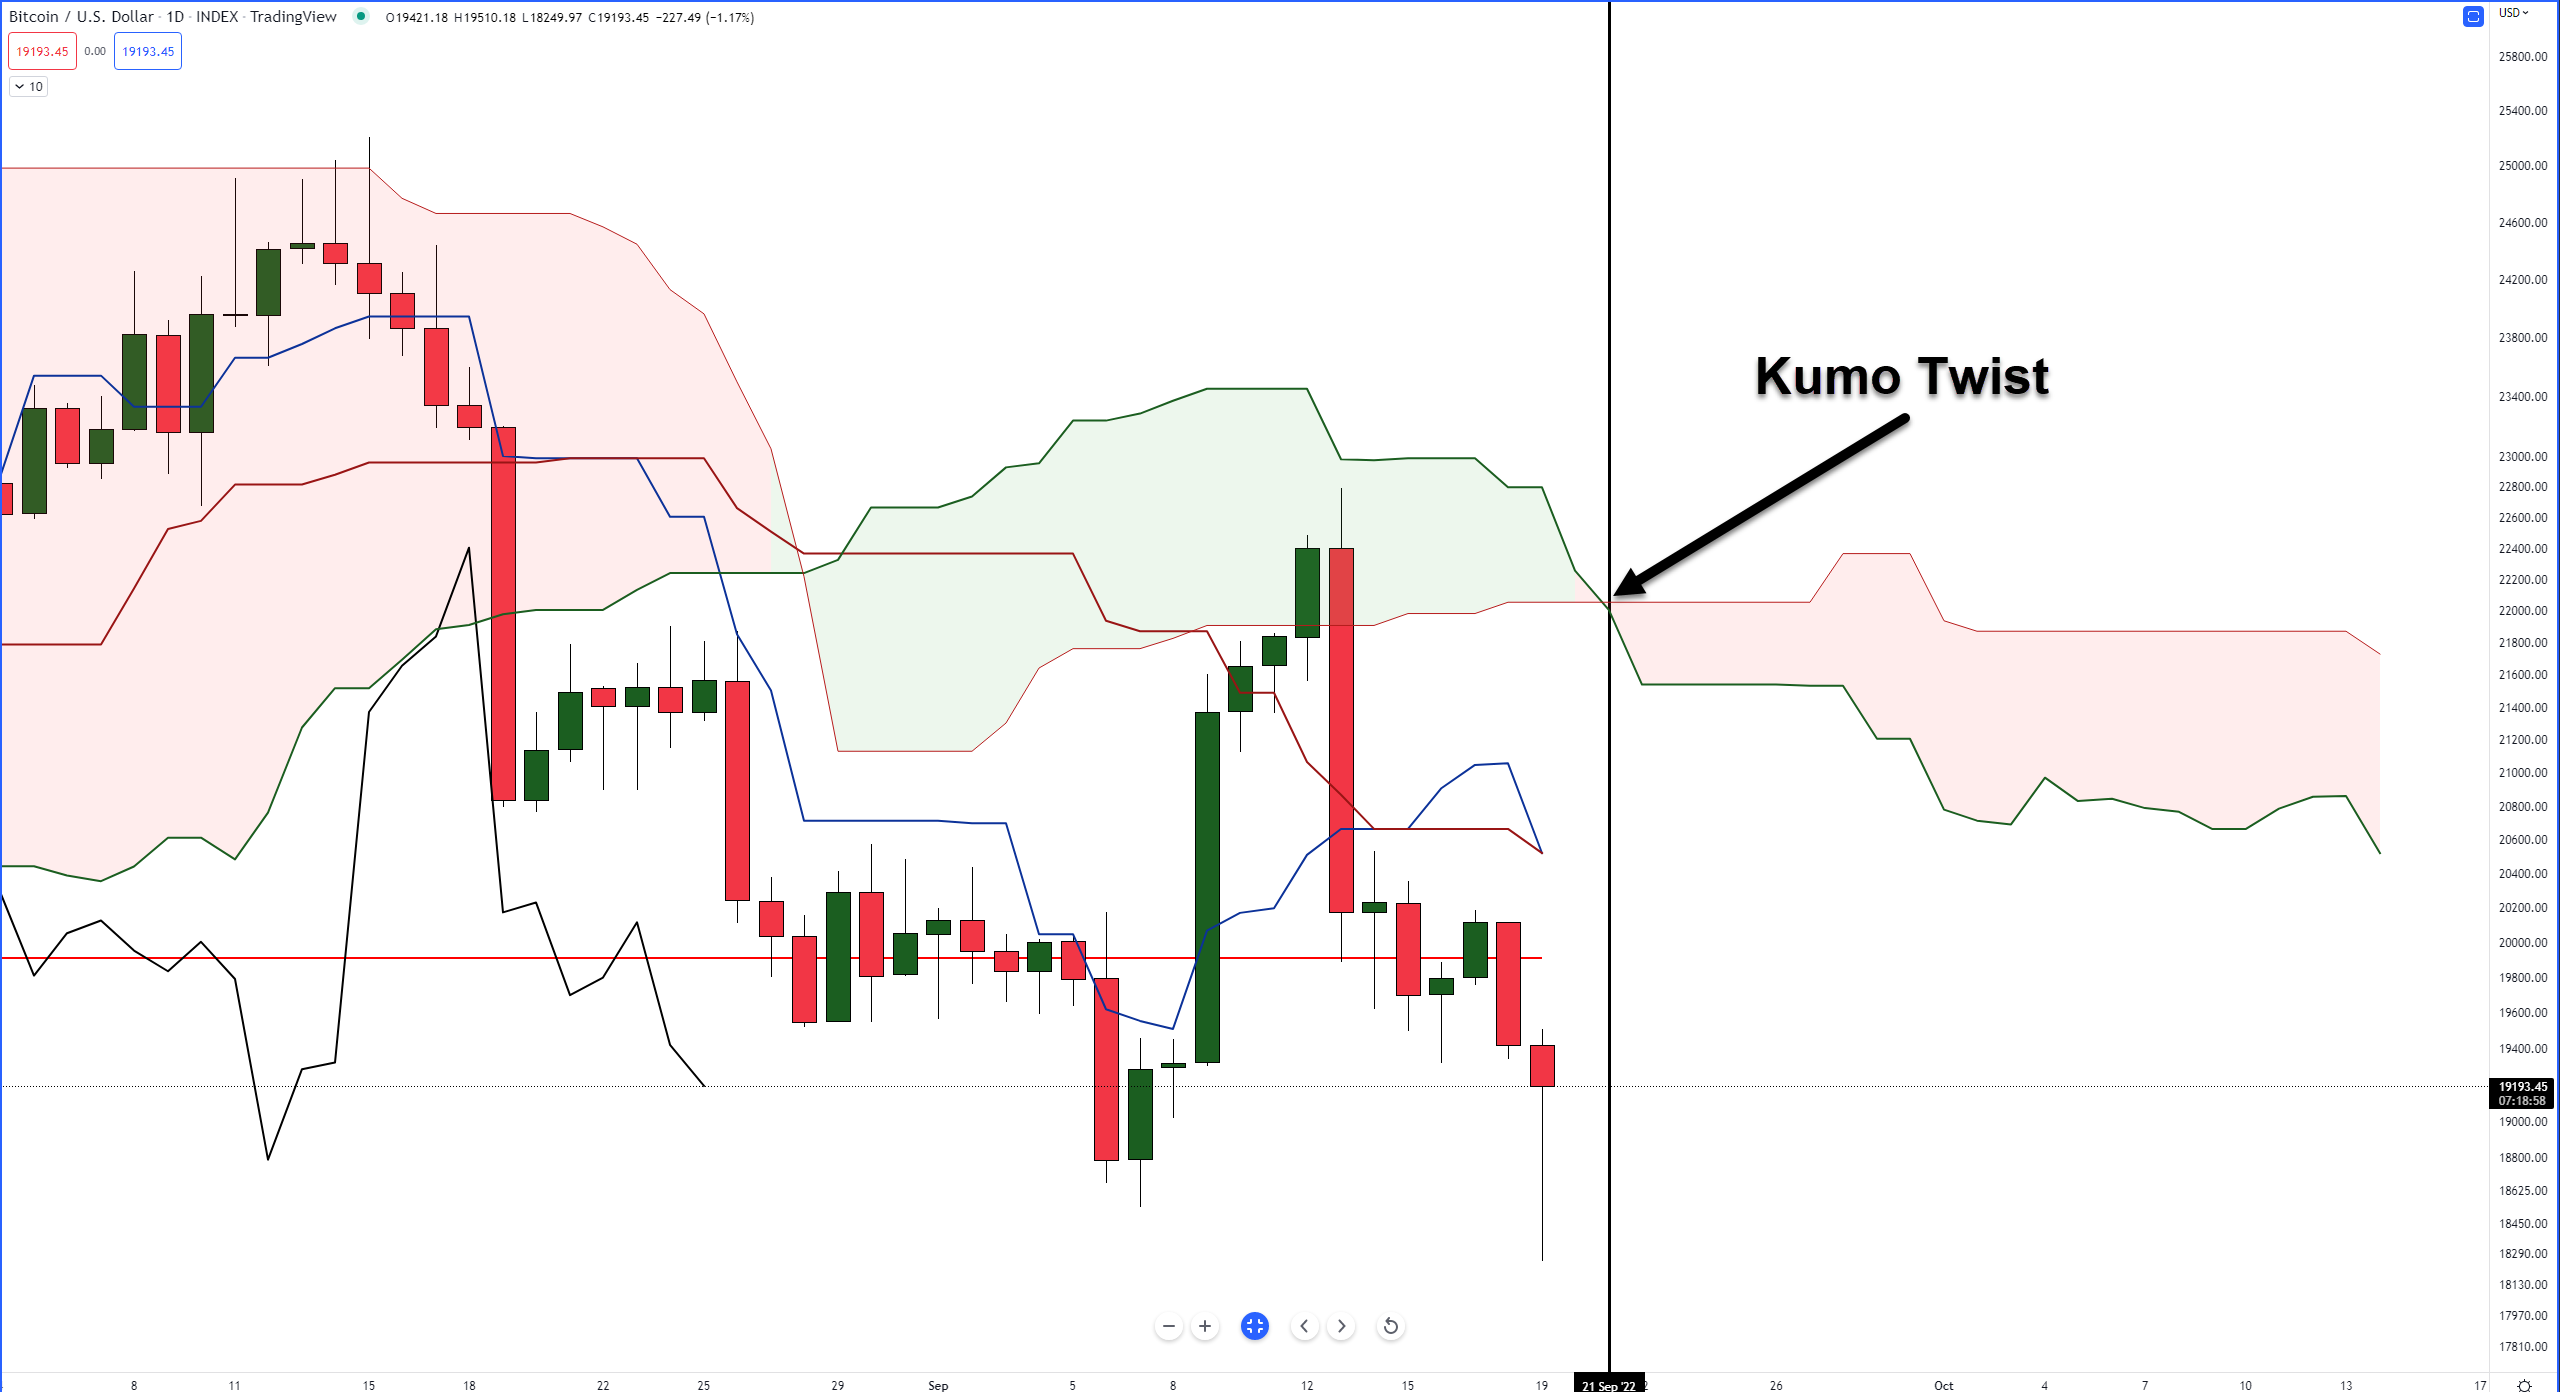
Complimenting Gann’s seasonal date of September 23 is a time cycle within the Ichimoku Kinko Hyo system: a Kumo Twist. A Kumo Twist appears on September 21, just a couple of days before the 23rd. Kumo Twists can sometimes identify where a major/minor swing high/low may occur, especially if an instrument has been trending strongly into the date of the Kumo Twist.
Ethereum
Ethereum’s daily chart is particularly interesting, especially considering the analysis performed in last Friday’s Litepaper which highlighted the Chikou Span on the daily Ichimoku chart:
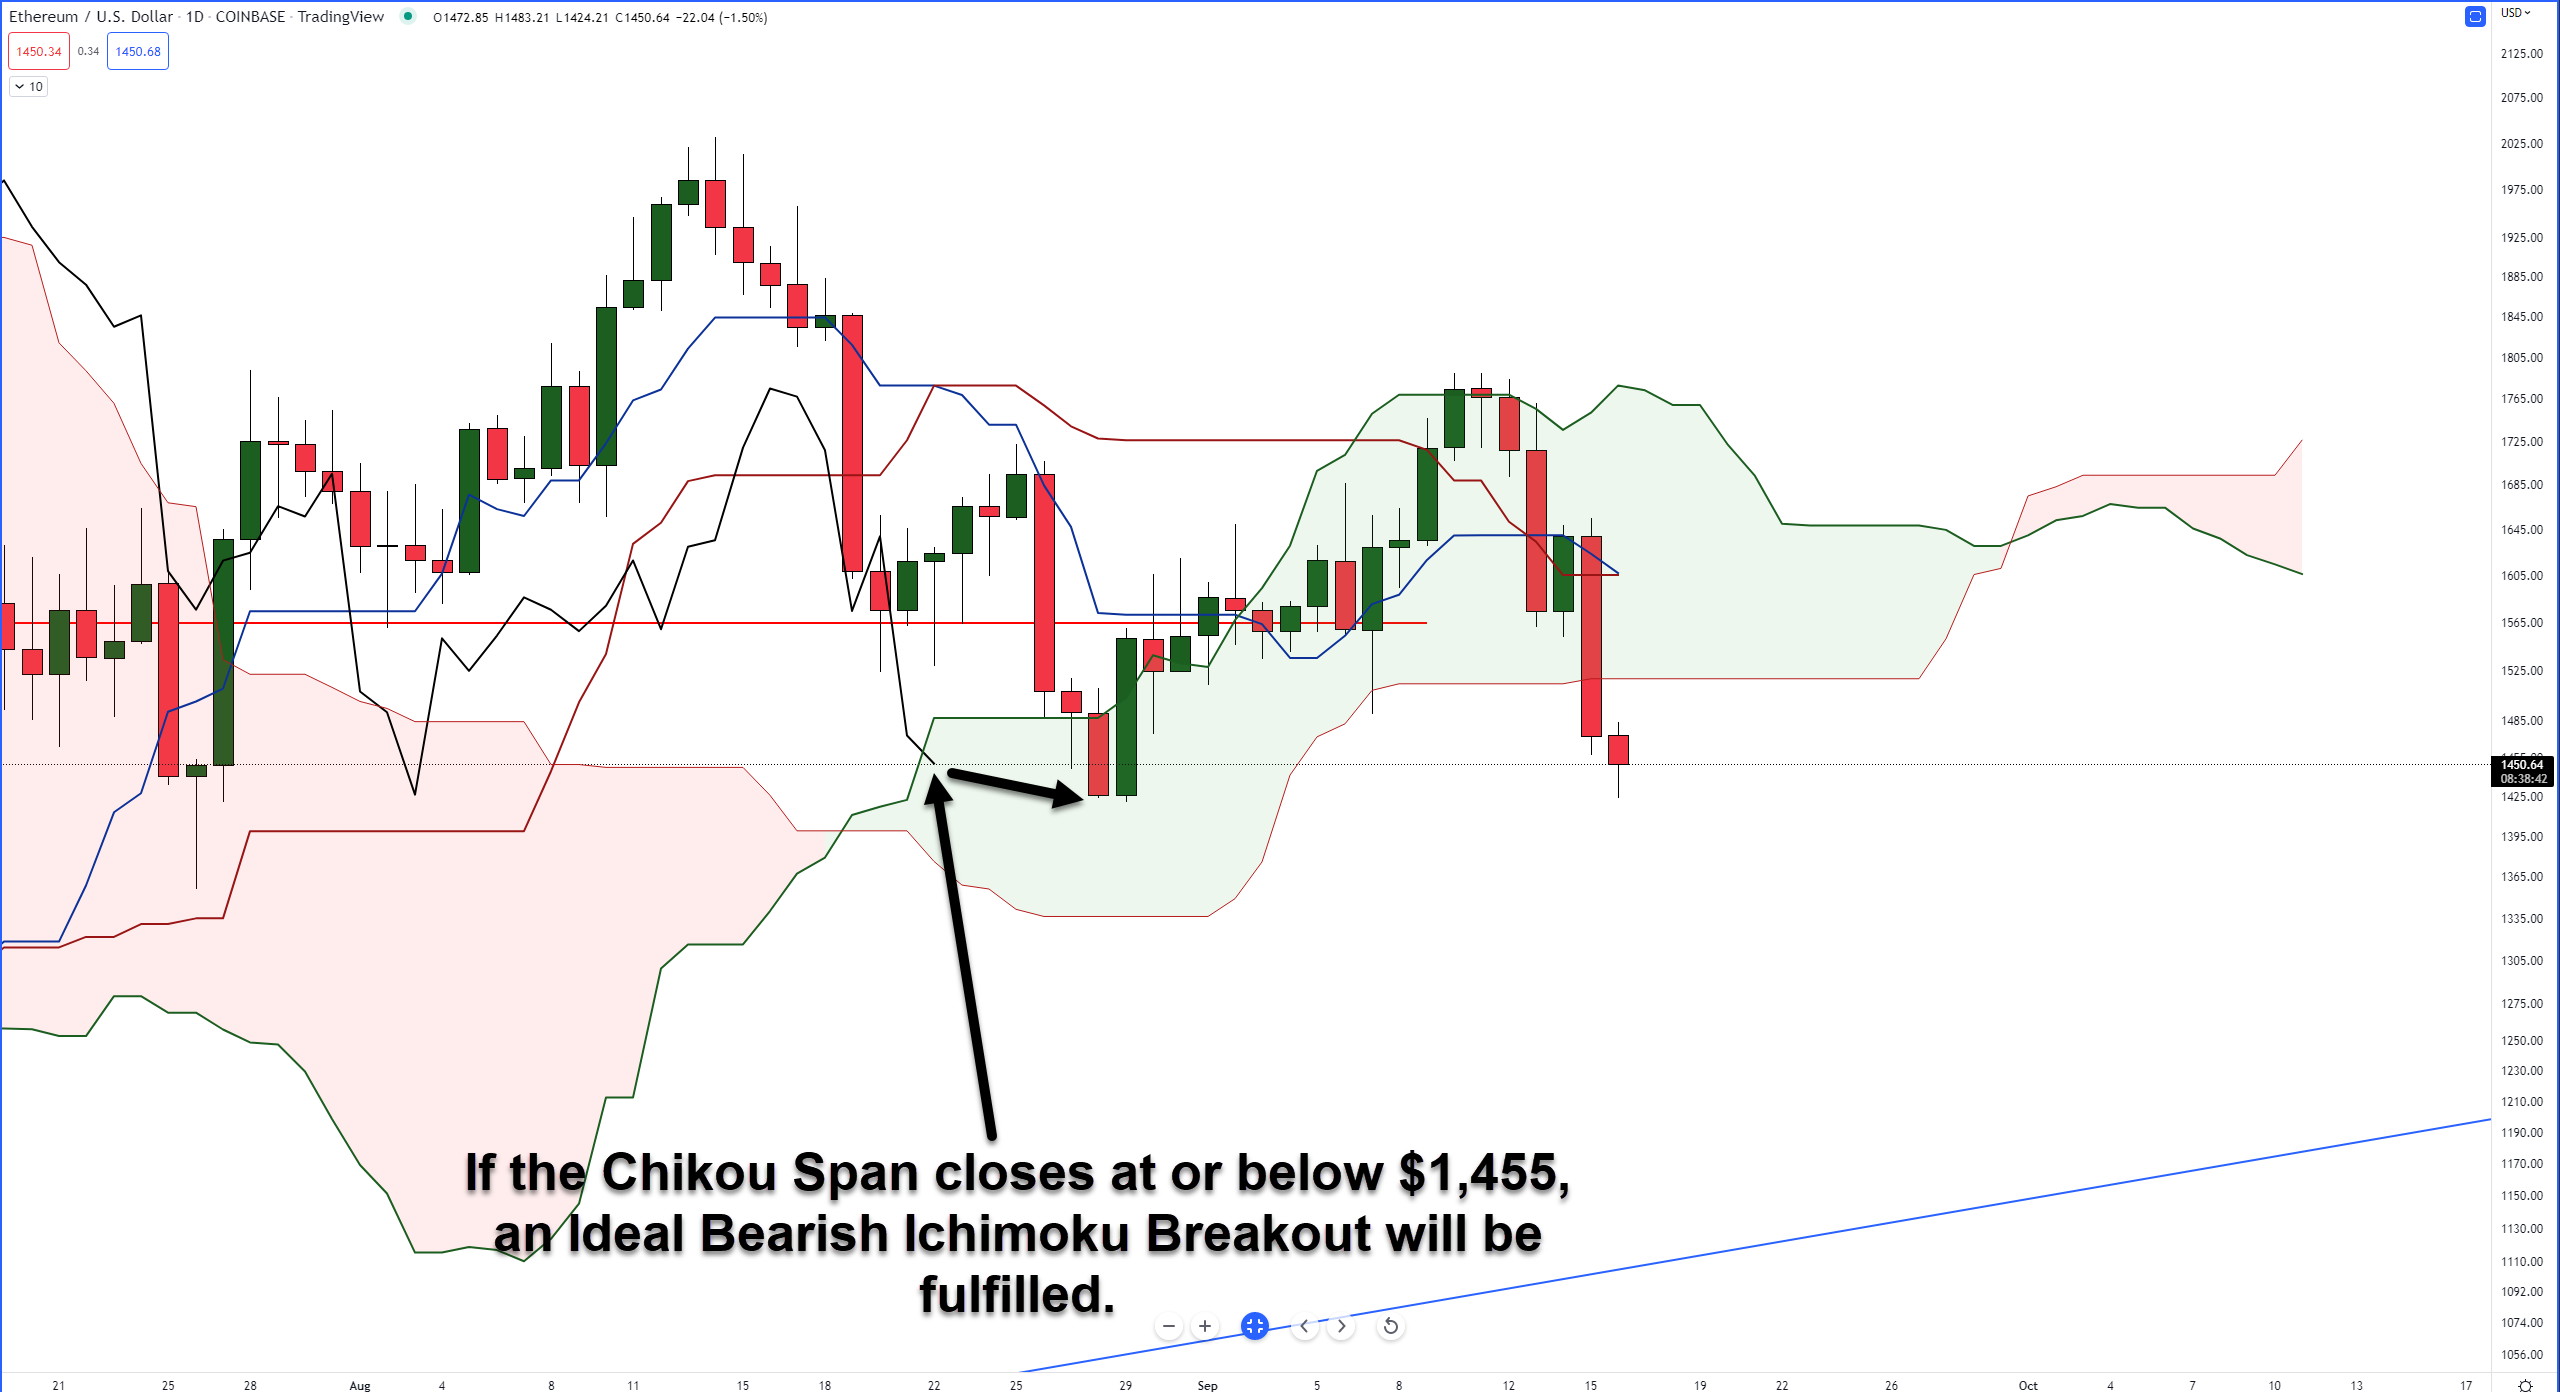
“And keep a close on the Chikou Span; it responds to the same support and resistance levels as the current candlestick. It would be a very normal situation for Ethereum to dip down to the $1,340 level, where it would be well below the Cloud, only to bounce seemingly out of nowhere because of the Chikou Span finding support against the bottom of the Cloud (Senkou Span B).”
Fast forward to today, and Ethereum has hit that price zone discussed last Friday. And while the Chikou Span did close below the Cloud on Sunday, there’s a noticeable hook higher which places the Chikou Span back inside the Cloud.
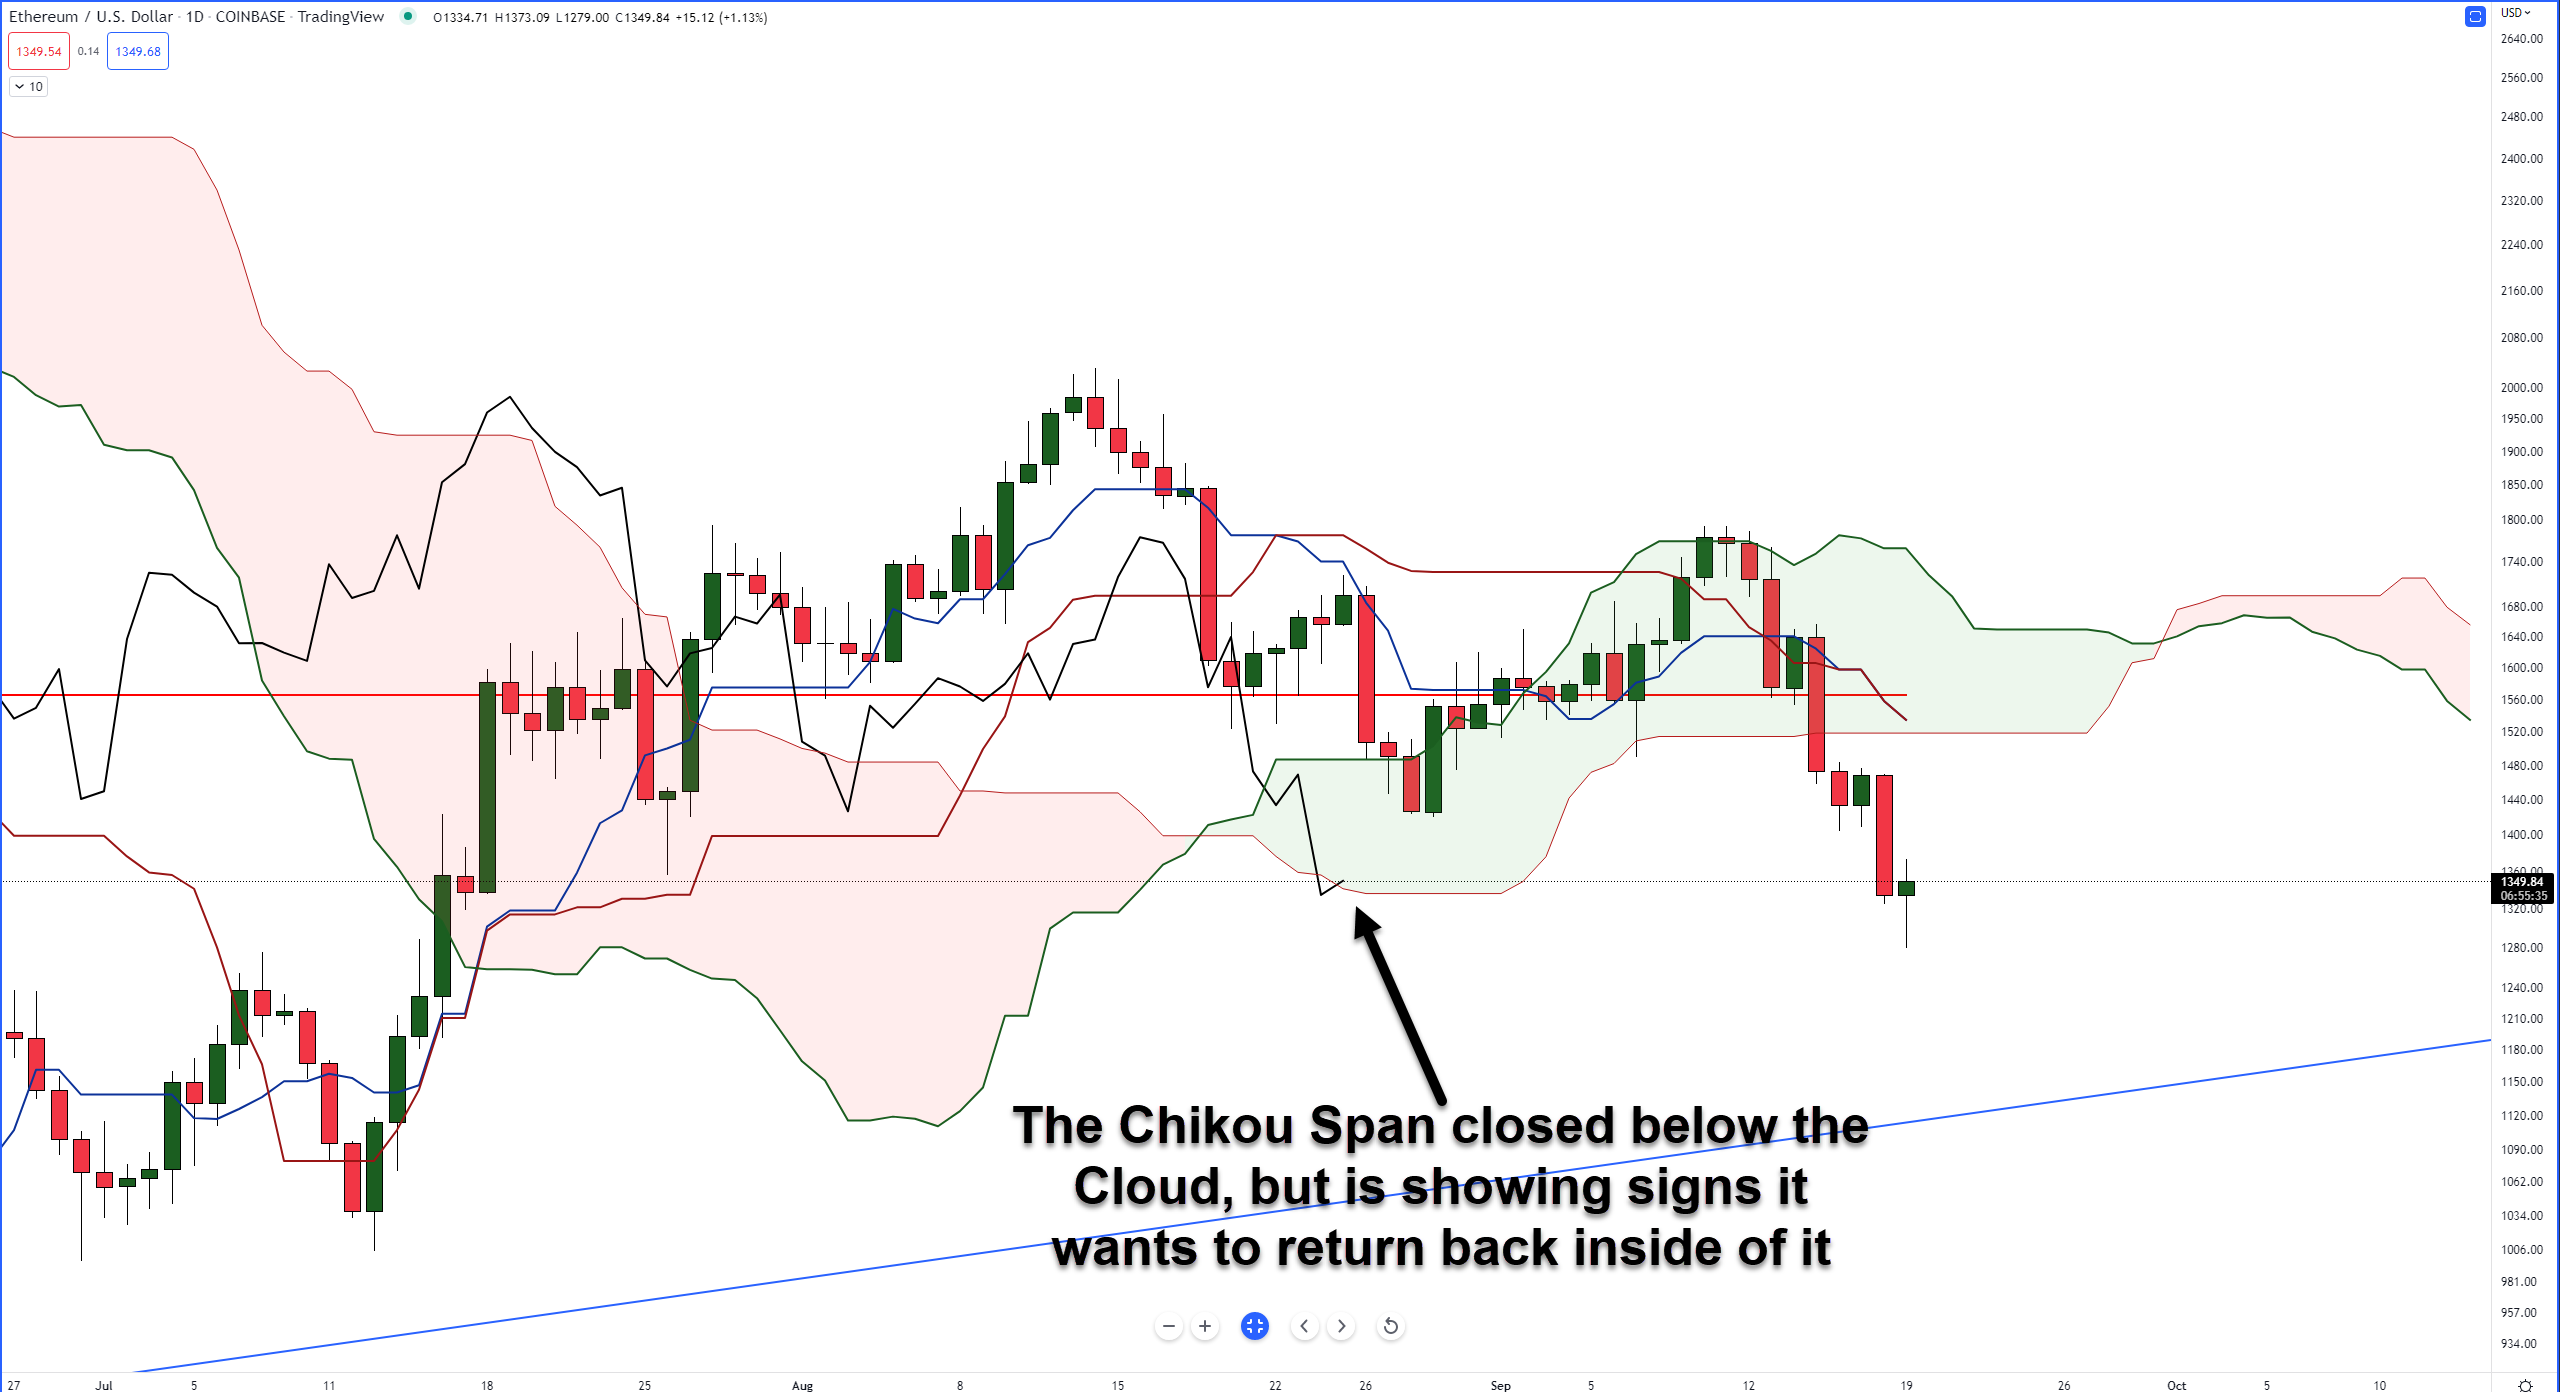
Ultimately though, we’ll probably have to wait until after Wednesday’s interest rate decision to get a good idea of where ETH is going in the short term.