If you don’t want all the technical analysis mumbo jumbo, scroll to the end of each crypto for the TL;DR (Too Long;Didn’t Read) summary for what bulls and bears are looking at.
Polygon
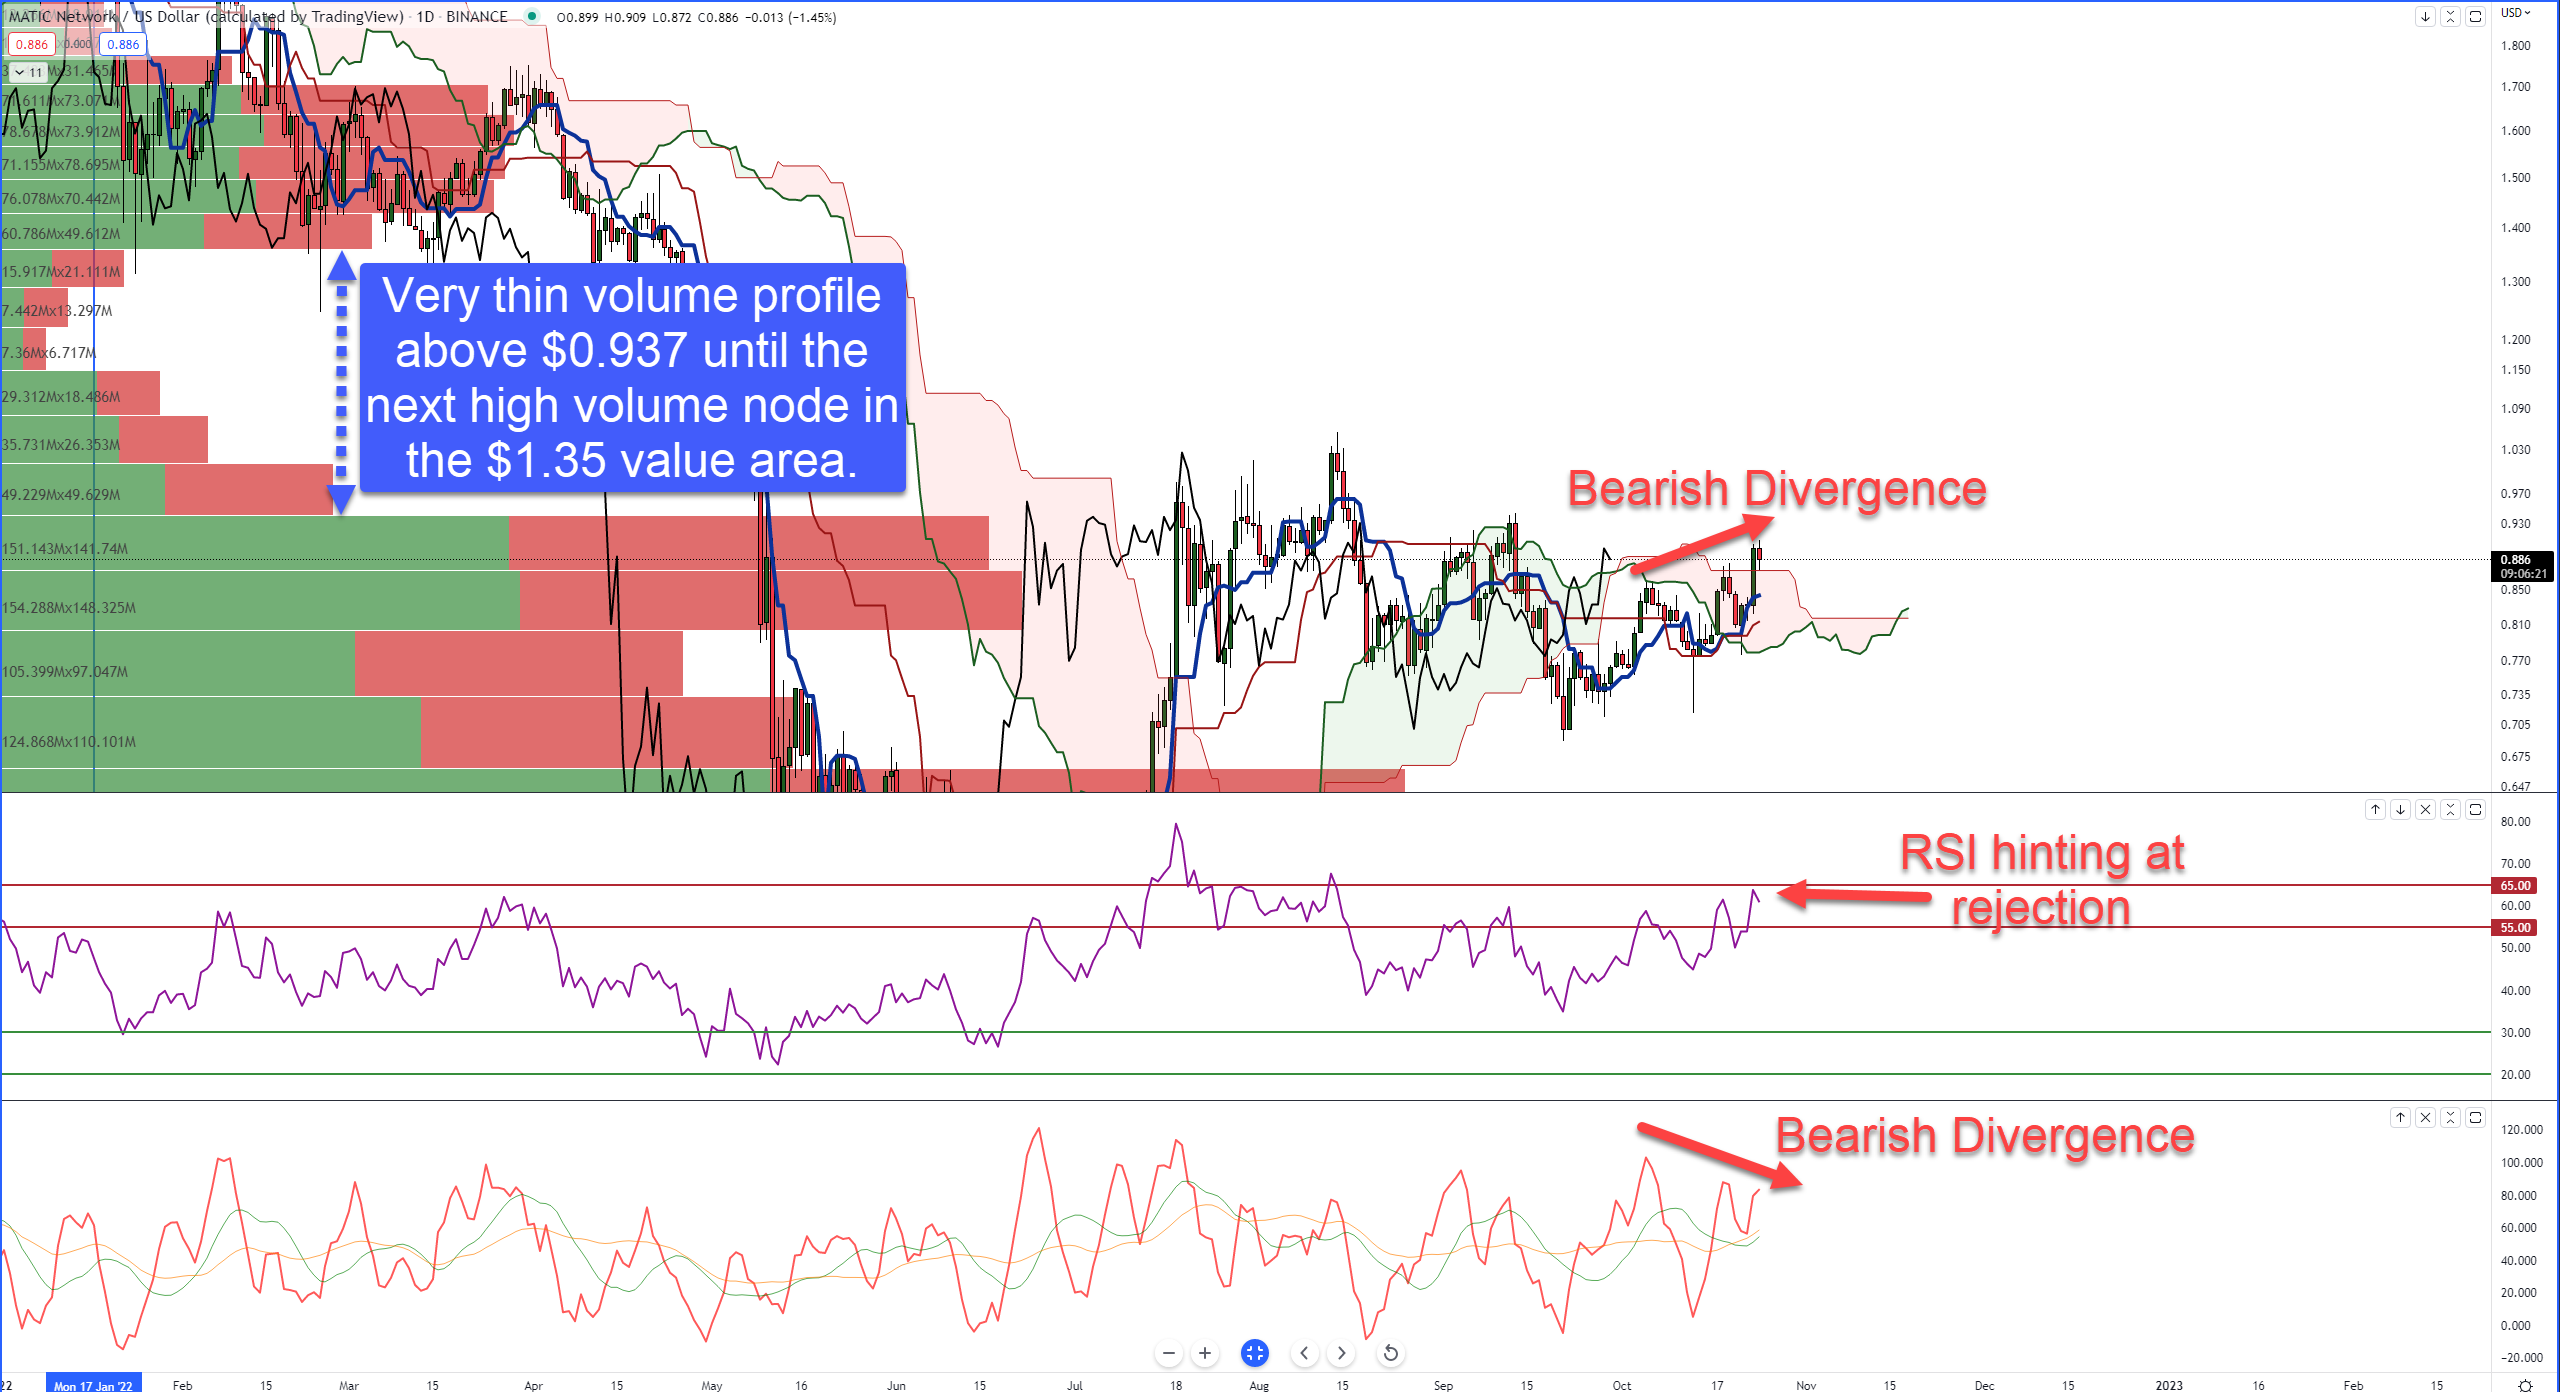
Polygon ($MATIC.X) is one of the few major market cap cryptocurrencies to trade above its Ichimoku Cloud – but it only just achieved that status after Sunday’s close. When you look at the current daily candlestick, there’s a clear struggle to keep Polygon above the Cloud. But that might be hard to do.
The Relative Strength Index (RSI) remains in bear market conditions – which means the overbought levels are 55 and 65 while the oversold levels are 20 and 30. The RSI shows strong rejection against the 65 level. Additionally, the Composite Index is showing regular bearish divergence.
If you look at the volume profile, you’ll note the closest high-volume node ends at $0.937. Above that, the volume profile thins out considerably until the $1.35 value area.
TL;DR Bulls
Bulls are looking for any daily close that can be sustained above the $0.937 level. Polygon has an easier time moving up than down due to a thin volume profile.
TL;DR Bears
Bears hope that the rejection against the last overbought level at 65 in the RSI will cause weakness to return to Polygon. Bears have a little further to fall before returning to some clear selling zones.
$0.77 is the likely zone bears are watching because it puts price below the Ichimoku Cloud and below the current high-volume node.
Elrond
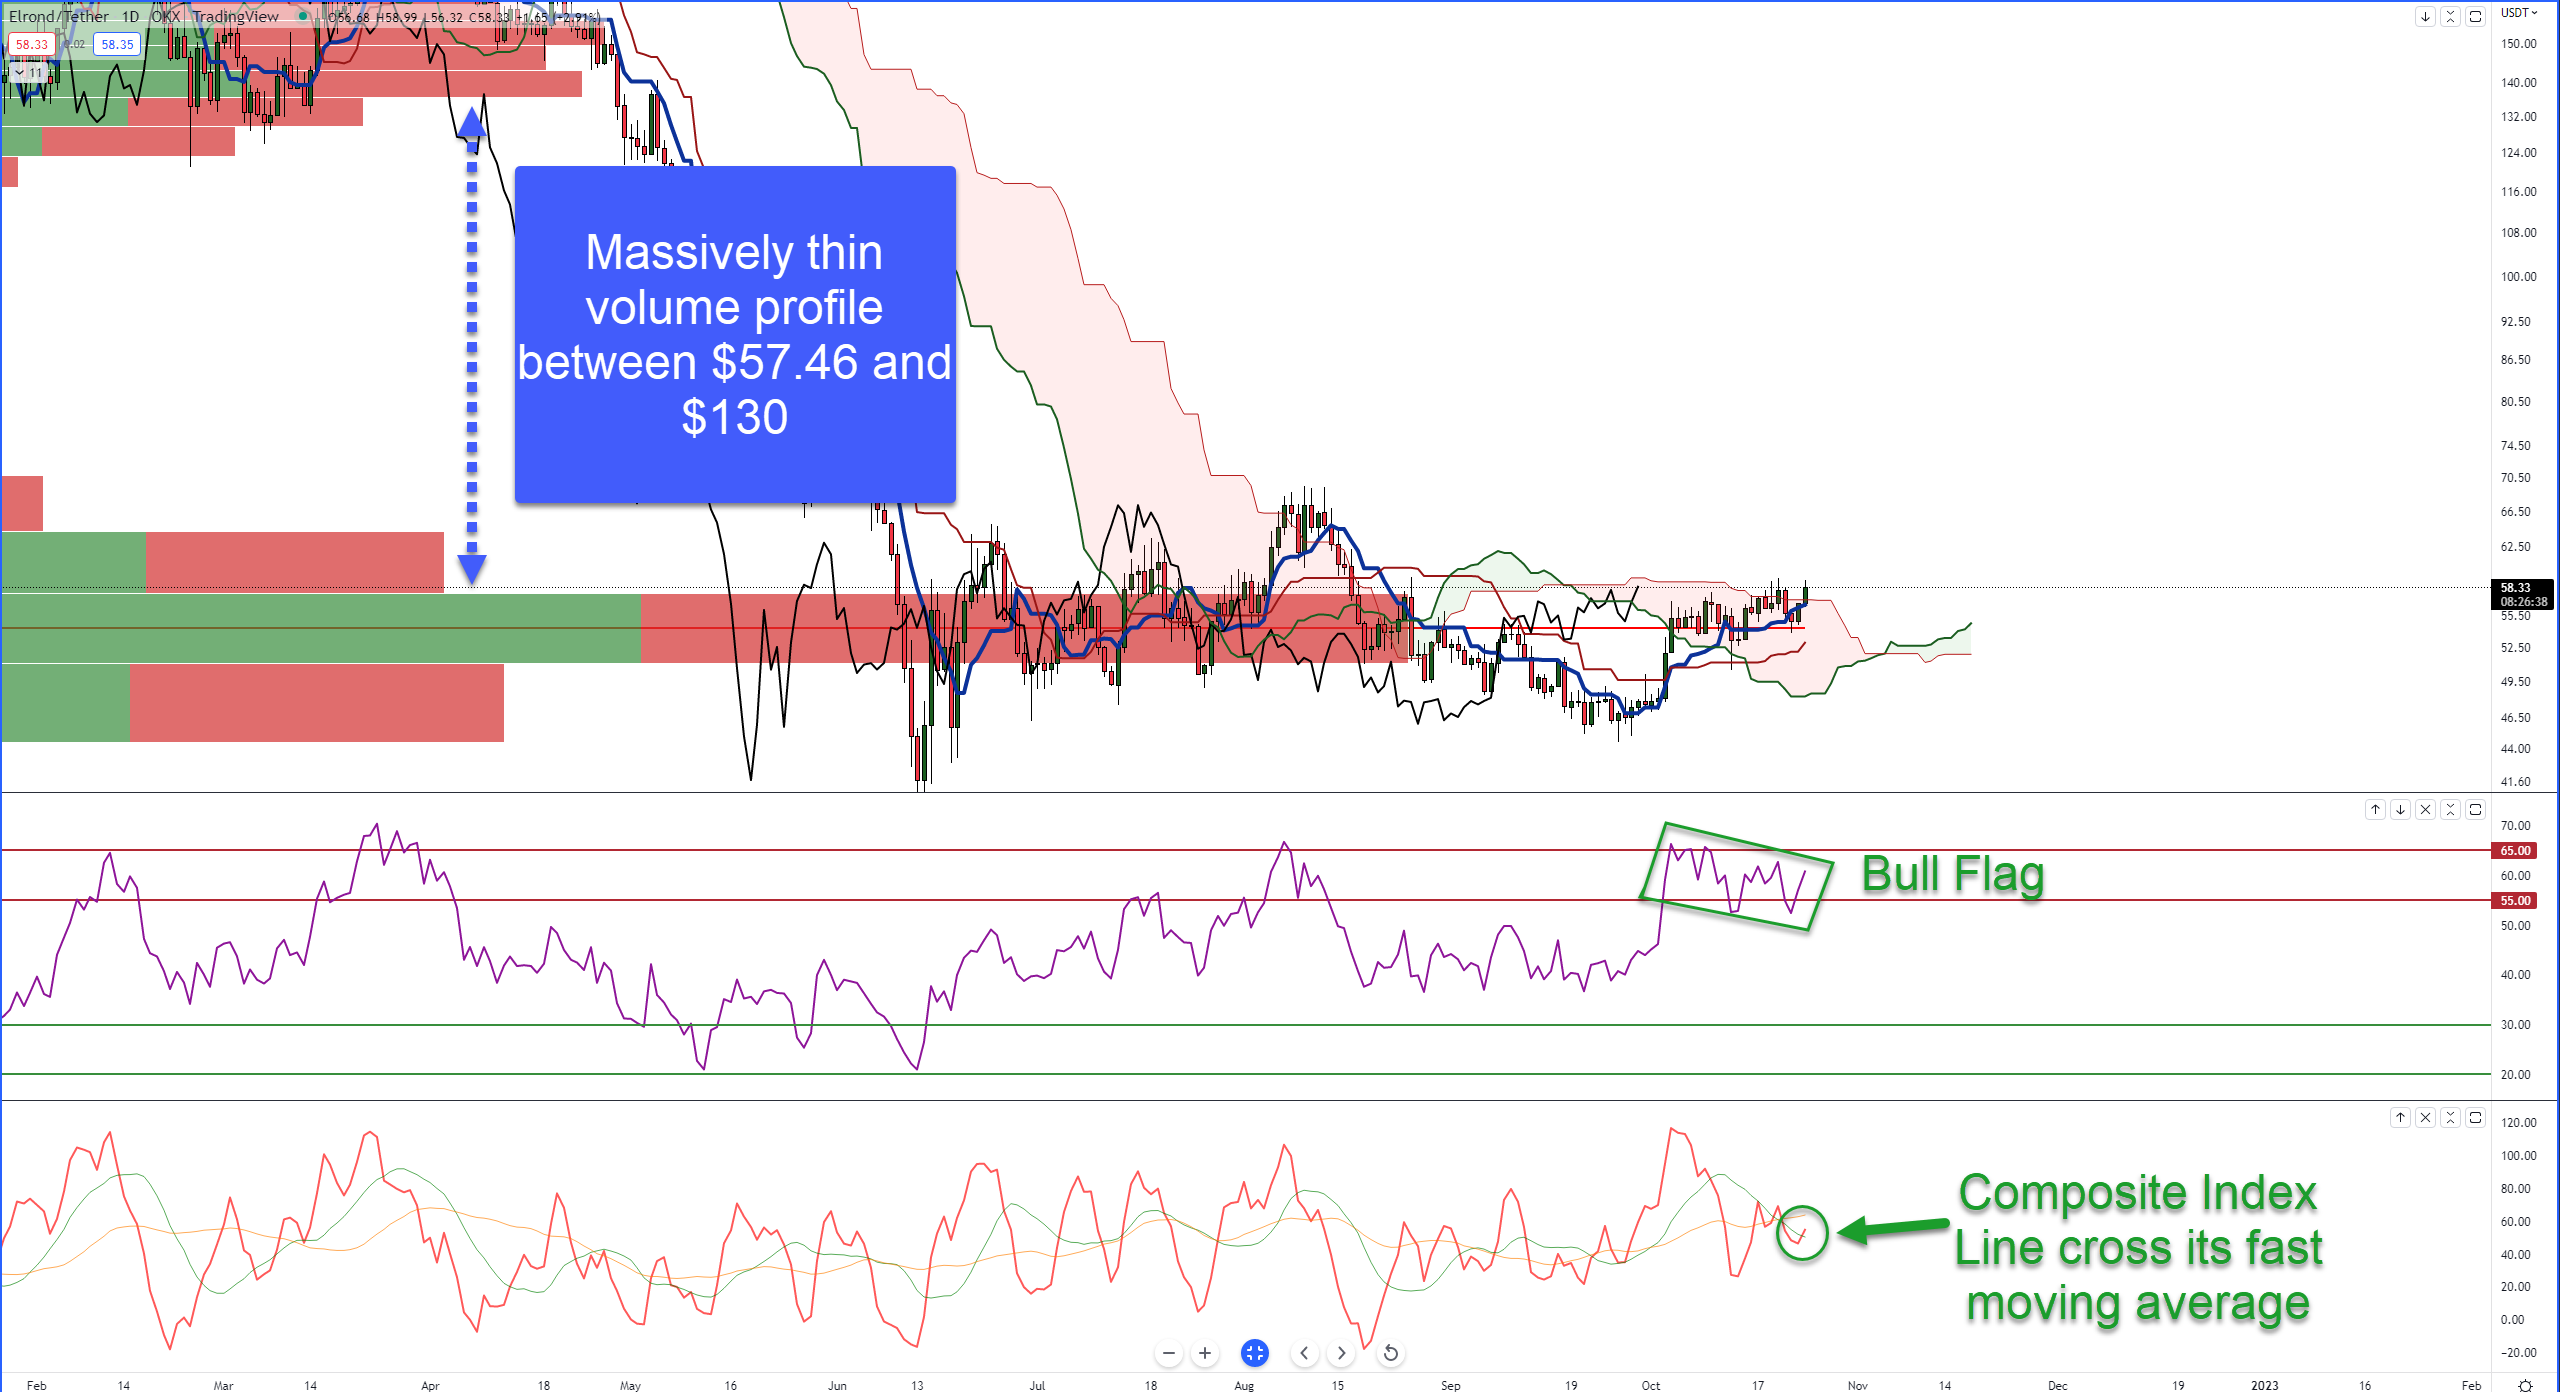
Just take a look really quick at that ridiculously long high-volume node on Elrond’s ($EGLD.X) volume profile. It’s absolutely massive compared to the rest of the volume profile.
From an Ichimoku perspective, Elrond is well positioned for one of the most sought-after bullish signals that indicate a prolonged upswing is likely to occur: the Ideal Bullish Ichimoku Breakout. The only condition remaining to complete the Ideal Bullish Breakout is a close above the Cloud – at or near $57.46.
If bulls pull off a close at or above $57.46, then the volume profile is wide open. And I mean wiiiiiiide open. The next high-volume node doesn’t appear until the $130 to $140 value areas.
The chart looks fairly biased toward a bullish breakout, especially when you look at the oscillators. The regular bearish divergence between the candlesticks and the Composite Index may not play out. The Composite Index line crossed above its fastmoving average, which is perceived as a bullish event during a bull market or preceding a new breakout.
Likewise, the RSI is sitting in the same resistance zone as Polygon. The difference here on Elrond’s RSI has formed a bull flag and is ping-ponging between resistance at 65 and support at 55.
TL;DR Bulls
Bulls are most definitely looking for a close above $57.46 – and for that close to hold. From there, the range where Elrond could move higher is considerable and with significantly less resistance.
TL;DR Bears
If the present move is a fakeout, then bears should be happy. However, to get a strong and sustained selling market again, bears need to close Elrond below the VPOC and the Ichimoku Cloud. The closest that can occur is at or below $47.84.
XRP
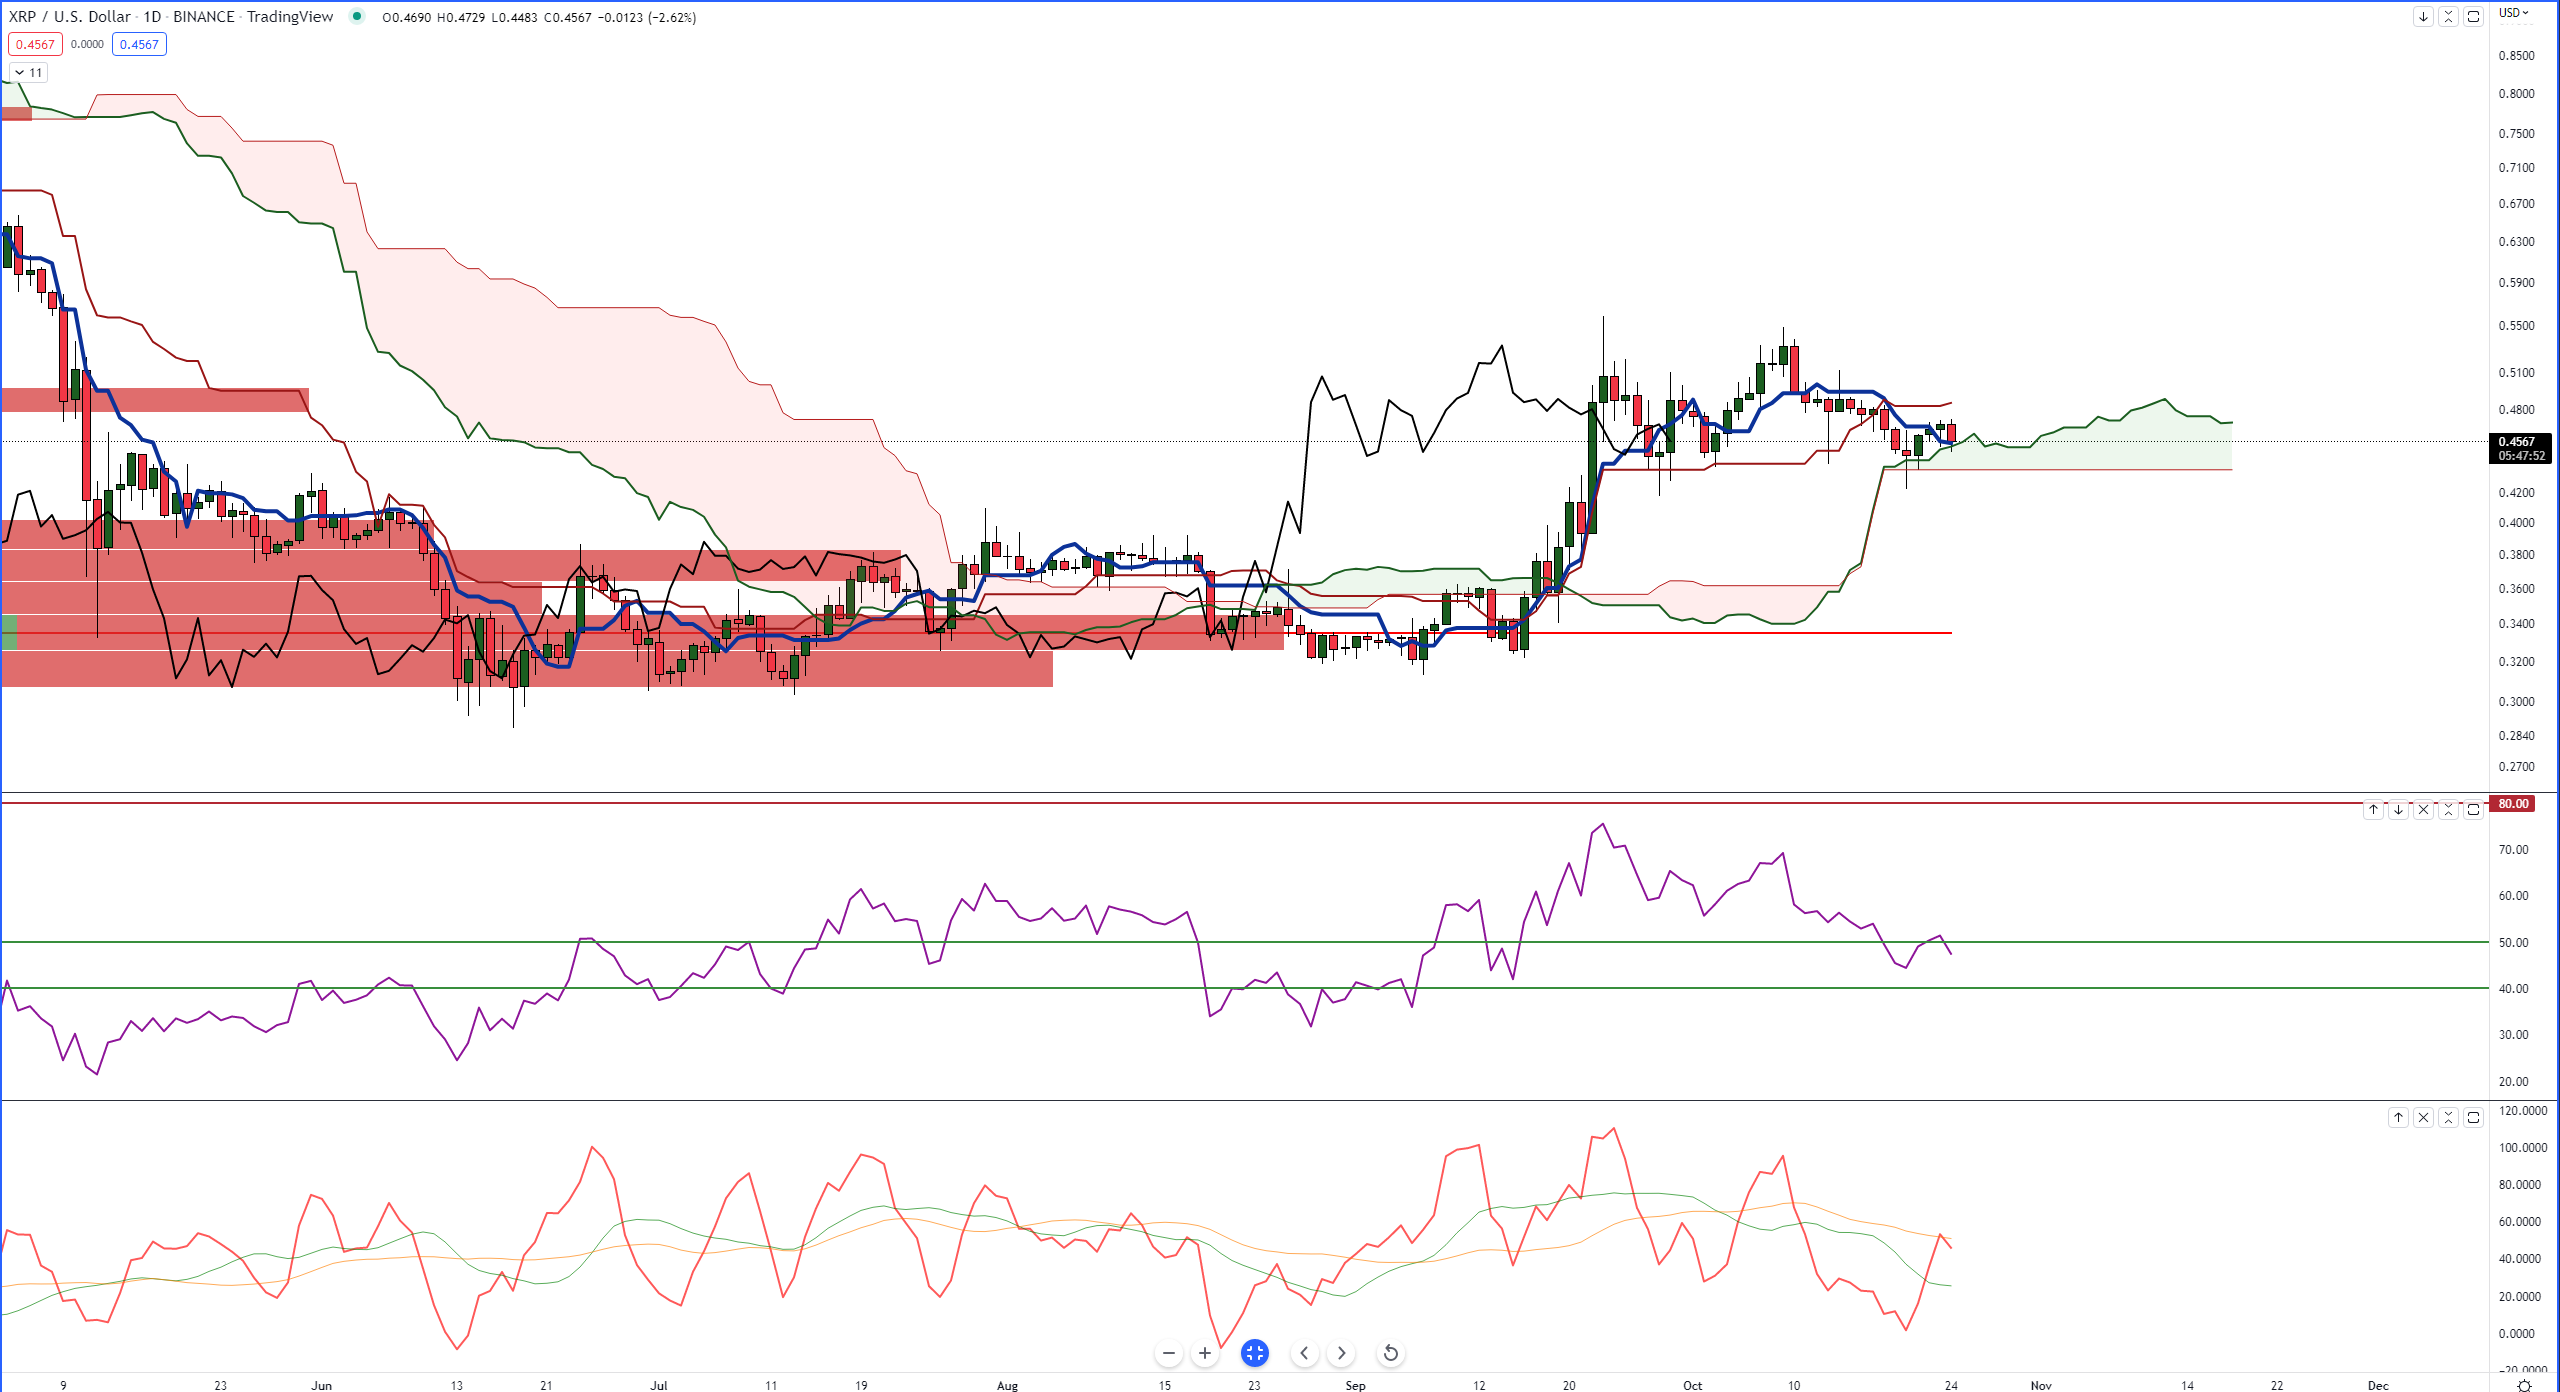
XRP ($XRP.X) is not only one of the few cryptocurrencies that is trading above its daily Ichimoku Cloud, but it’s one of the longest to be above the Cloud. And out of the top ten market cap cryptocurrencies, it’s the only one with a daily RSI in bull market conditions (overbought 80 and 90, oversold 40 and 50).
Sellers have been putting XRP and the broader crypto market under much pressure, but so far, XRP has held up. Neither the bulls nor the bears have far to move to trigger conditions necessary for a sustained bear or bull move. But the bears will likely have a more difficult time.
Bears need a daily close below the Cloud, but the strongest level of support in the Ichimoku System, Senkou Span B, might be hard to cross. When Senkou Span B is flat, it represents strength. If it is flat over a long period of time, it exacerbates that strength.
A close below $0.433 would trigger an Ideal Bearish Ichimoku Breakout – a warning that a sustained selloff may be imminent. However, the volume profile is quite thick, so sellers may have difficulty spending any time below $0.43.
Bulls, however, need a close at or above $0.50. That would put it above the high volume node at $0.48 while simultaneously confirming and IDeal Bullish Ichimoku Breakout. In that scenario, a swift run-up to the next high volume node at $0.77 is increasingly probable.
TL;DR Bulls
Bulls need a daily close at or above $0.50 – preferably closer to $0.51.
TL;DR Bears
A close at or below $0.43 is necessary to set up some strong selling conditions – but there’s a ton of support below $0.43, so moving lower might prove difficult.