Let’s have a quick look at what some cryptocurrencies currently look like on their charts.
Cosmos
We last looked at $ATOM back on April 21, highlighting a support zone between the bottom of the bearish pennant and the VPOC:
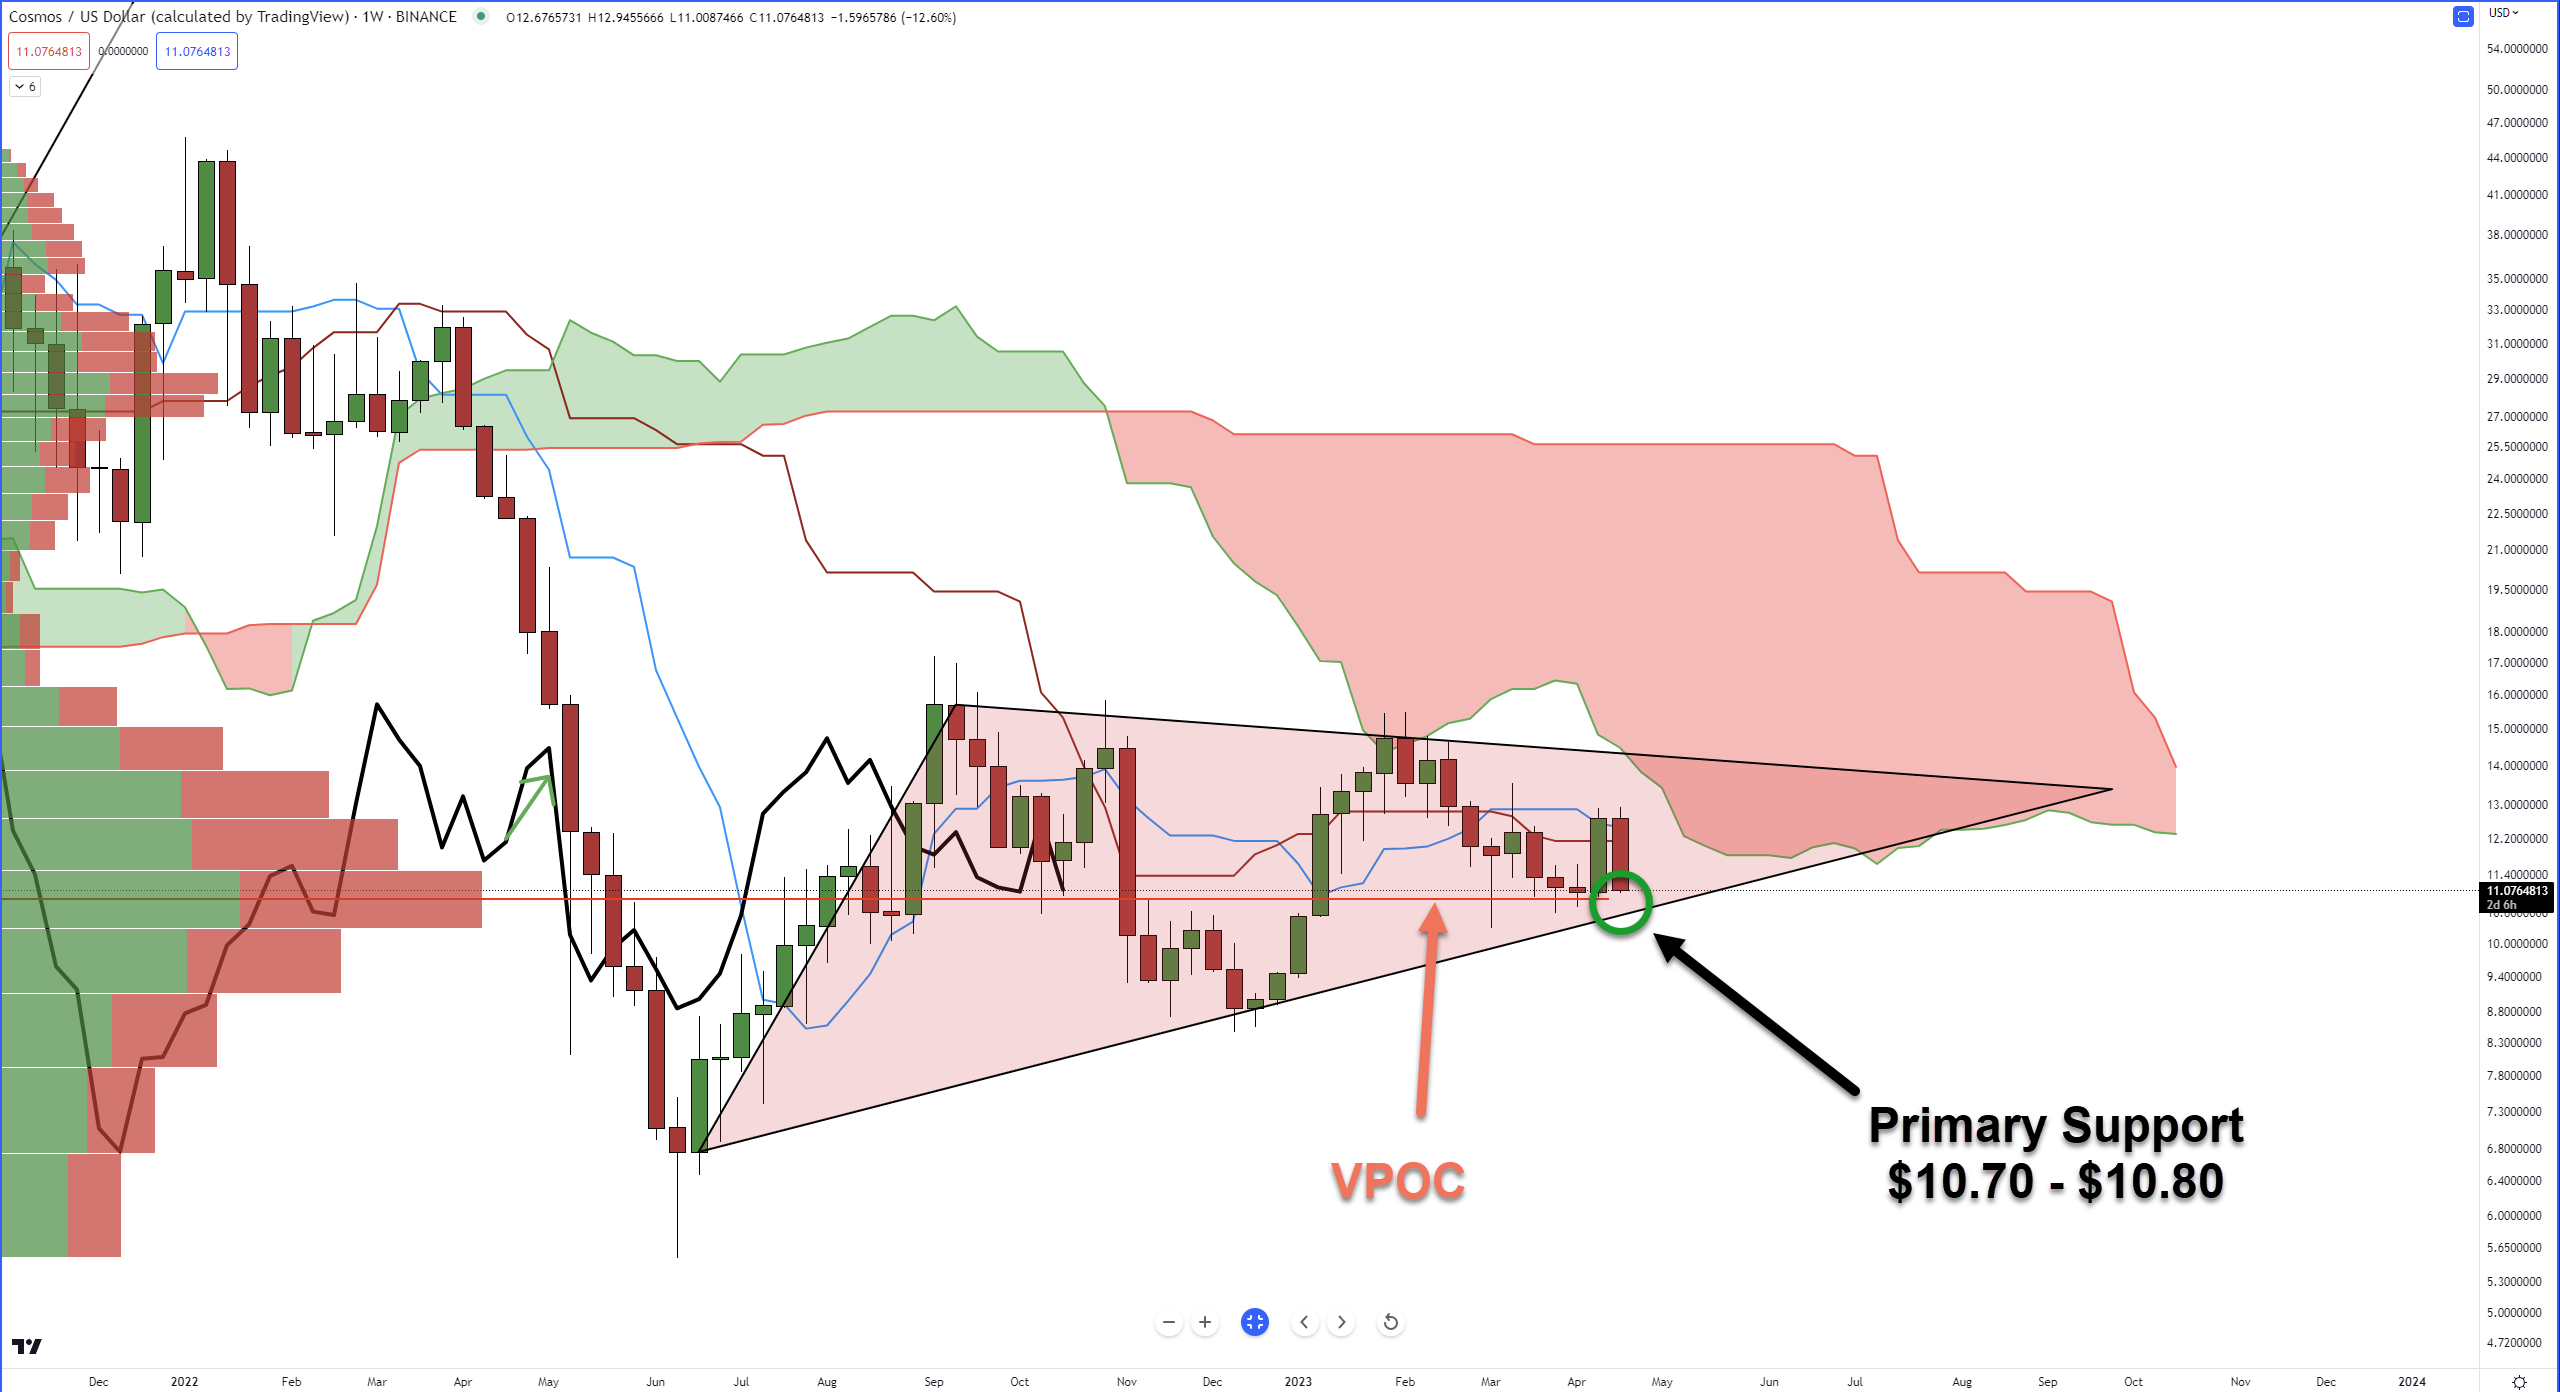
Fast forward to today, and it looks like ATOM is looking for a bounce.

But take a look at the Composite Index – it’s at an angle that suggests it will likely cross above its slow and fast-moving averages. That could signal some bullish momentum ahead.
However, the bearish pennant is a bearish continuation pattern, and ATOM is just barely hanging on to its final support zone before the bears come in and pounce on it. 🐻
Stellar
In our Technically Speaking article from April 21, 2023, we examined $XLM. We focused on the last support zone in the Ichimoku Kinko Hyo system on the weekly chart, which was positioned at $0.093:

Bulls were able to close last week’s candle above the Tenkan-Sen and Kijun-Sen, but just barely.
Like ATOM’s weekly chart, Stellar’s weekly chart is in a bearish continuation pattern (bear flag) and is at risk of some deep dives south if support fails. 🔻
Total Cryptocurrency Market Cap Chart
We last looked at this chart in the Saturday Litepaper:

“On the 3-Day chart above, you might notice the wicks missing from the candlesticks. I did this because it makes the flag the market is stuck in a little easier to see.
The gray-shaded area represents a very thin zone between $1.278T and $1.675T in the Volume Profile – an area to watch closely if the market finds a bounce. ” – Technically Speaking April 21, 2023
Doing the same thing (removing the wicks) and looking at today, this is what the current 3-day chart looks like:

If you’re a bull and felt a little panic after the chart closed below the bull flag for the second time in a row, you had a good reason to.
Currently, bulls have pushed the market back into the bull flag, which begs a couple of questions:
- Is this a retest of the breakout? If so, bears need to close this 3-day candle below the bull flag to get sellers back in.
- Is this a shallow, false breakout south that turns into a broader bullish continuation? If it is, bears and bulls will need to watch what happens near the 1.278 trillion value area. Fireworks could happen.