Chainlink and Solana have been big movers lately and have been outperforming their peers by large margins. ⤴️
Do they still have room to go? If so, how far? If they retrace, where might it find some support? Let’s look.
Chainlink
$LINK has been in a league of its own over the past seven days with how it’s performed: +43.8%.
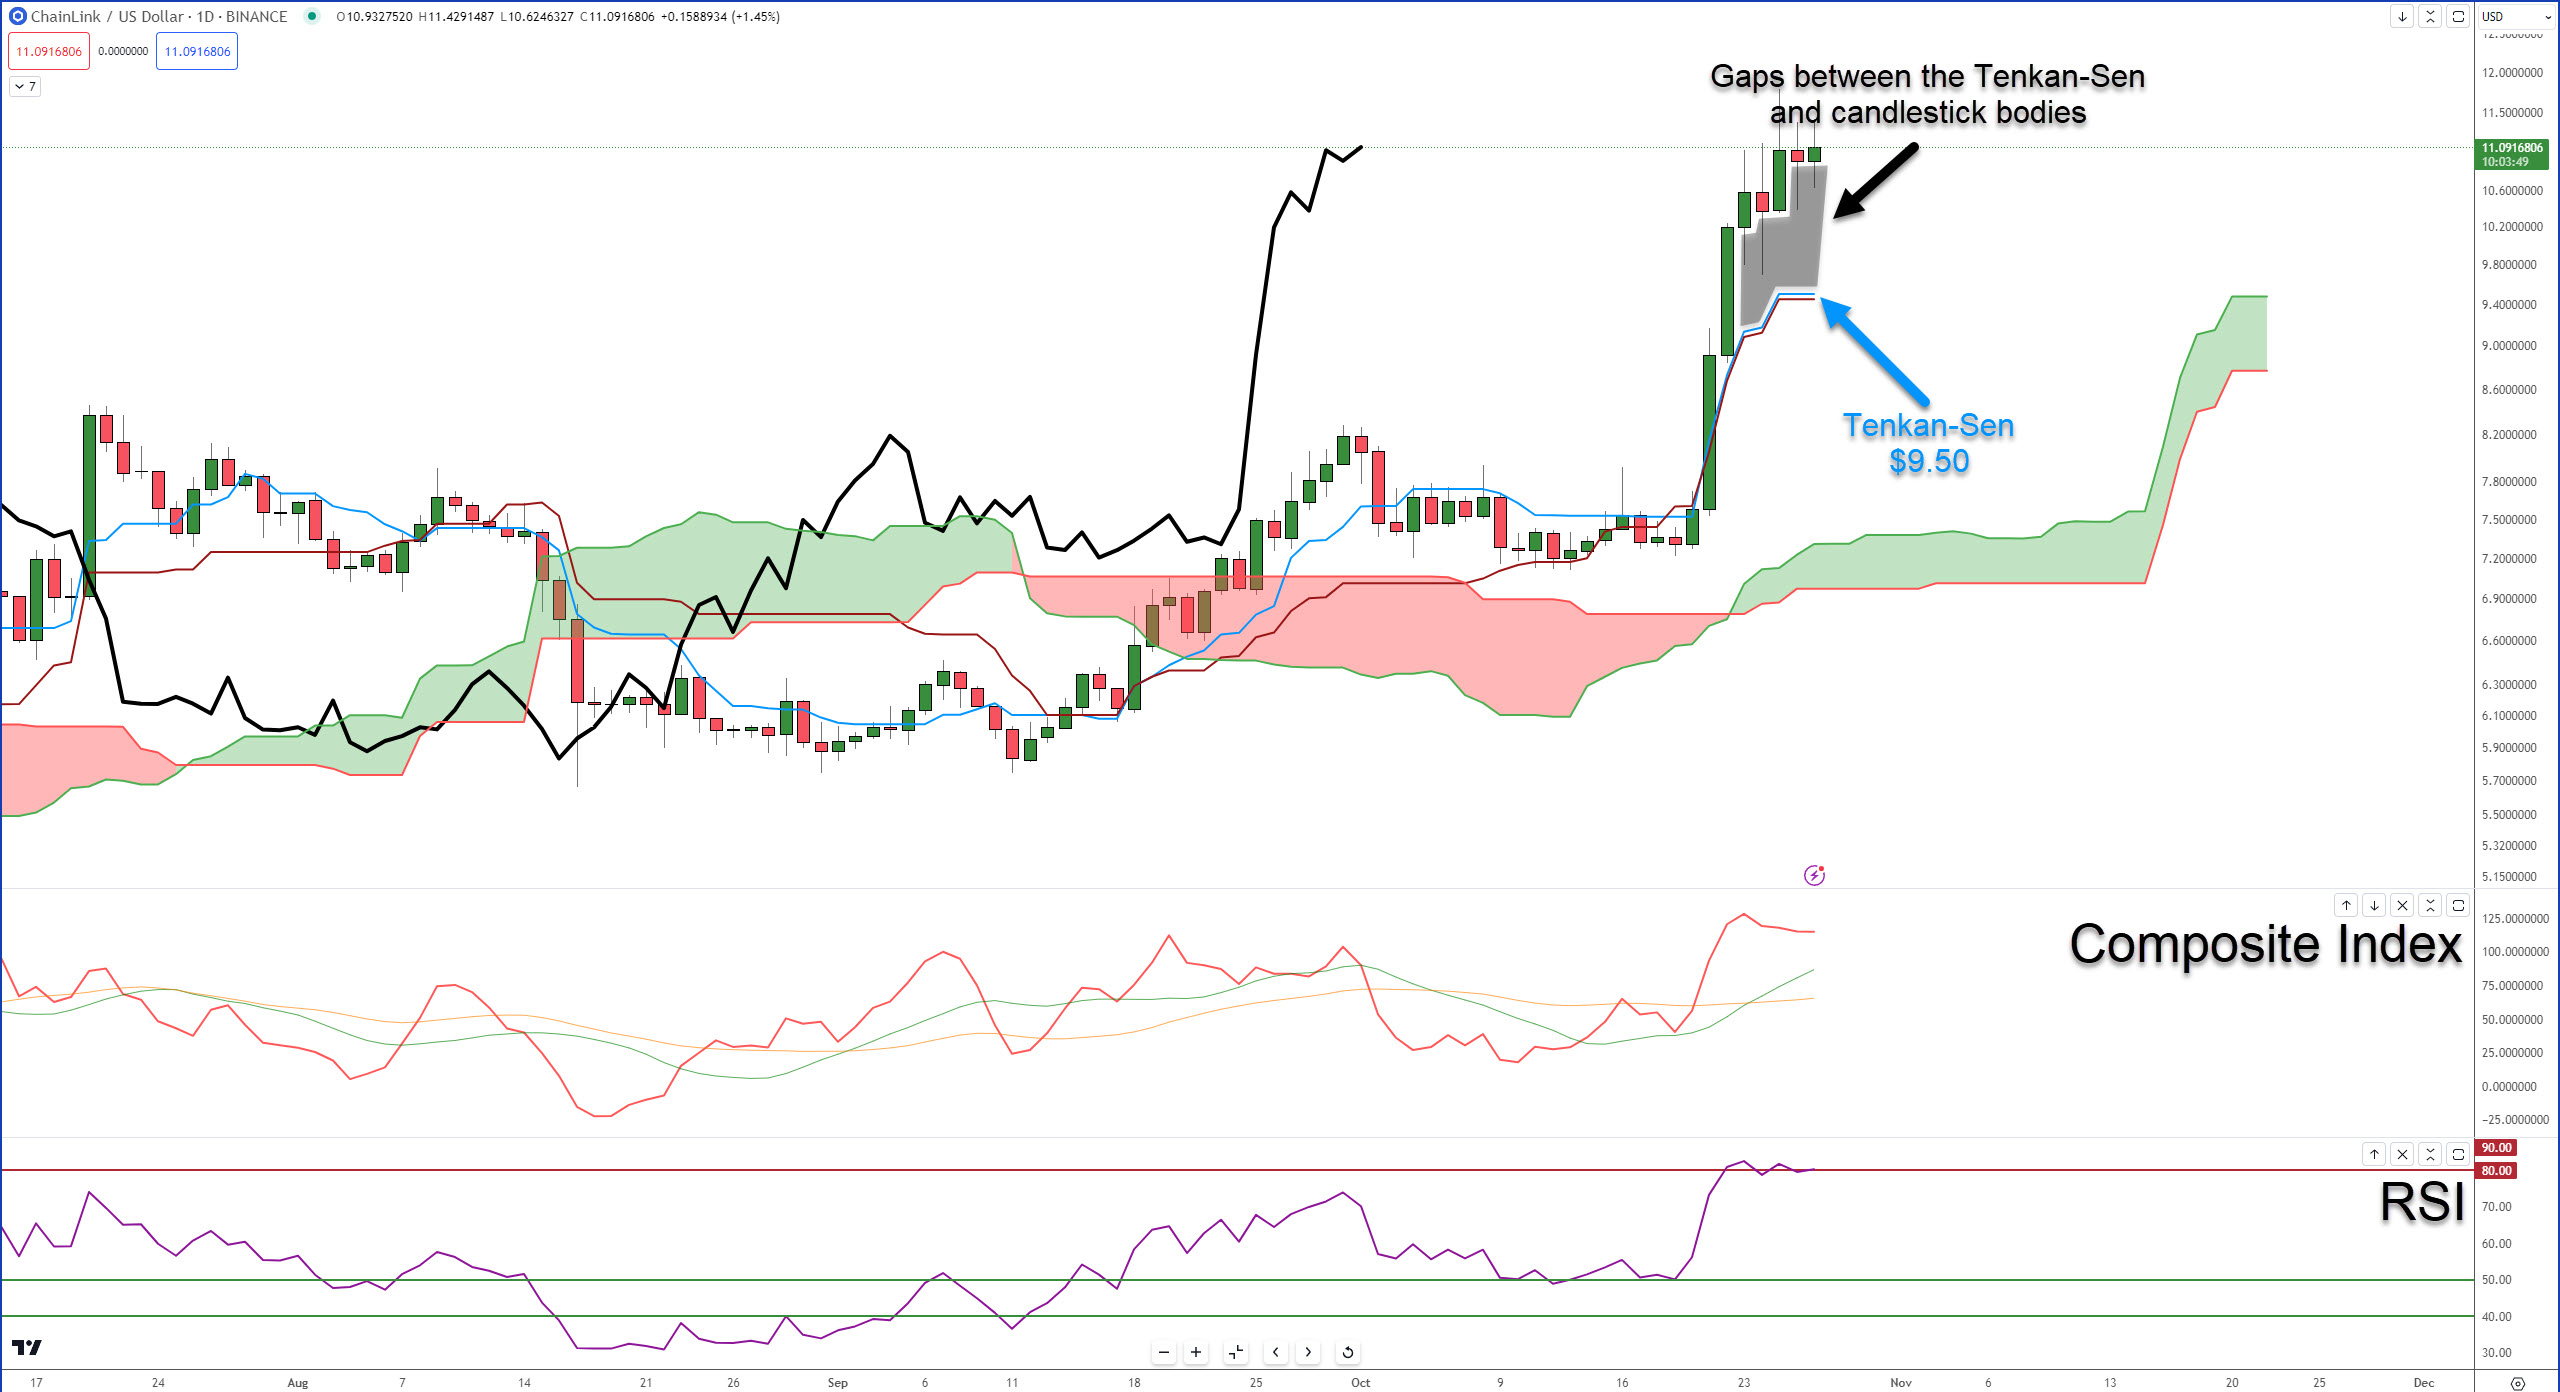
On its daily chart, there are large gaps between the bodies of the candlesticks and the Tenkan-Sen – a short-term warning sign the move higher might halt or pull back.
Additionally, the daily RSI for Chainlink is right up against its first oversold level (80) – the first time it’s traded at the level since August 2020. Similarly, there’s some regular bearish divergence forming on the Composite Index.
While the daily chart shows price action may be a tad overdone, the weekly chart shows there may be some room to run.

A resistance cluster between $15.50 and $17.30 contains two critical Fibonacci levels and the Chikou Span’s next resistance level, Senkou Span B. 🥓
Near-Term Support: $9.50
Near-Term Resistance: $15.50 – $17.30
Solana
$SOL has moved an insane 50% since October 16 and has nearly identical technical conditions within the Ichimoku Kinko Hyo system, the Composite Index, and the RSI. 👀
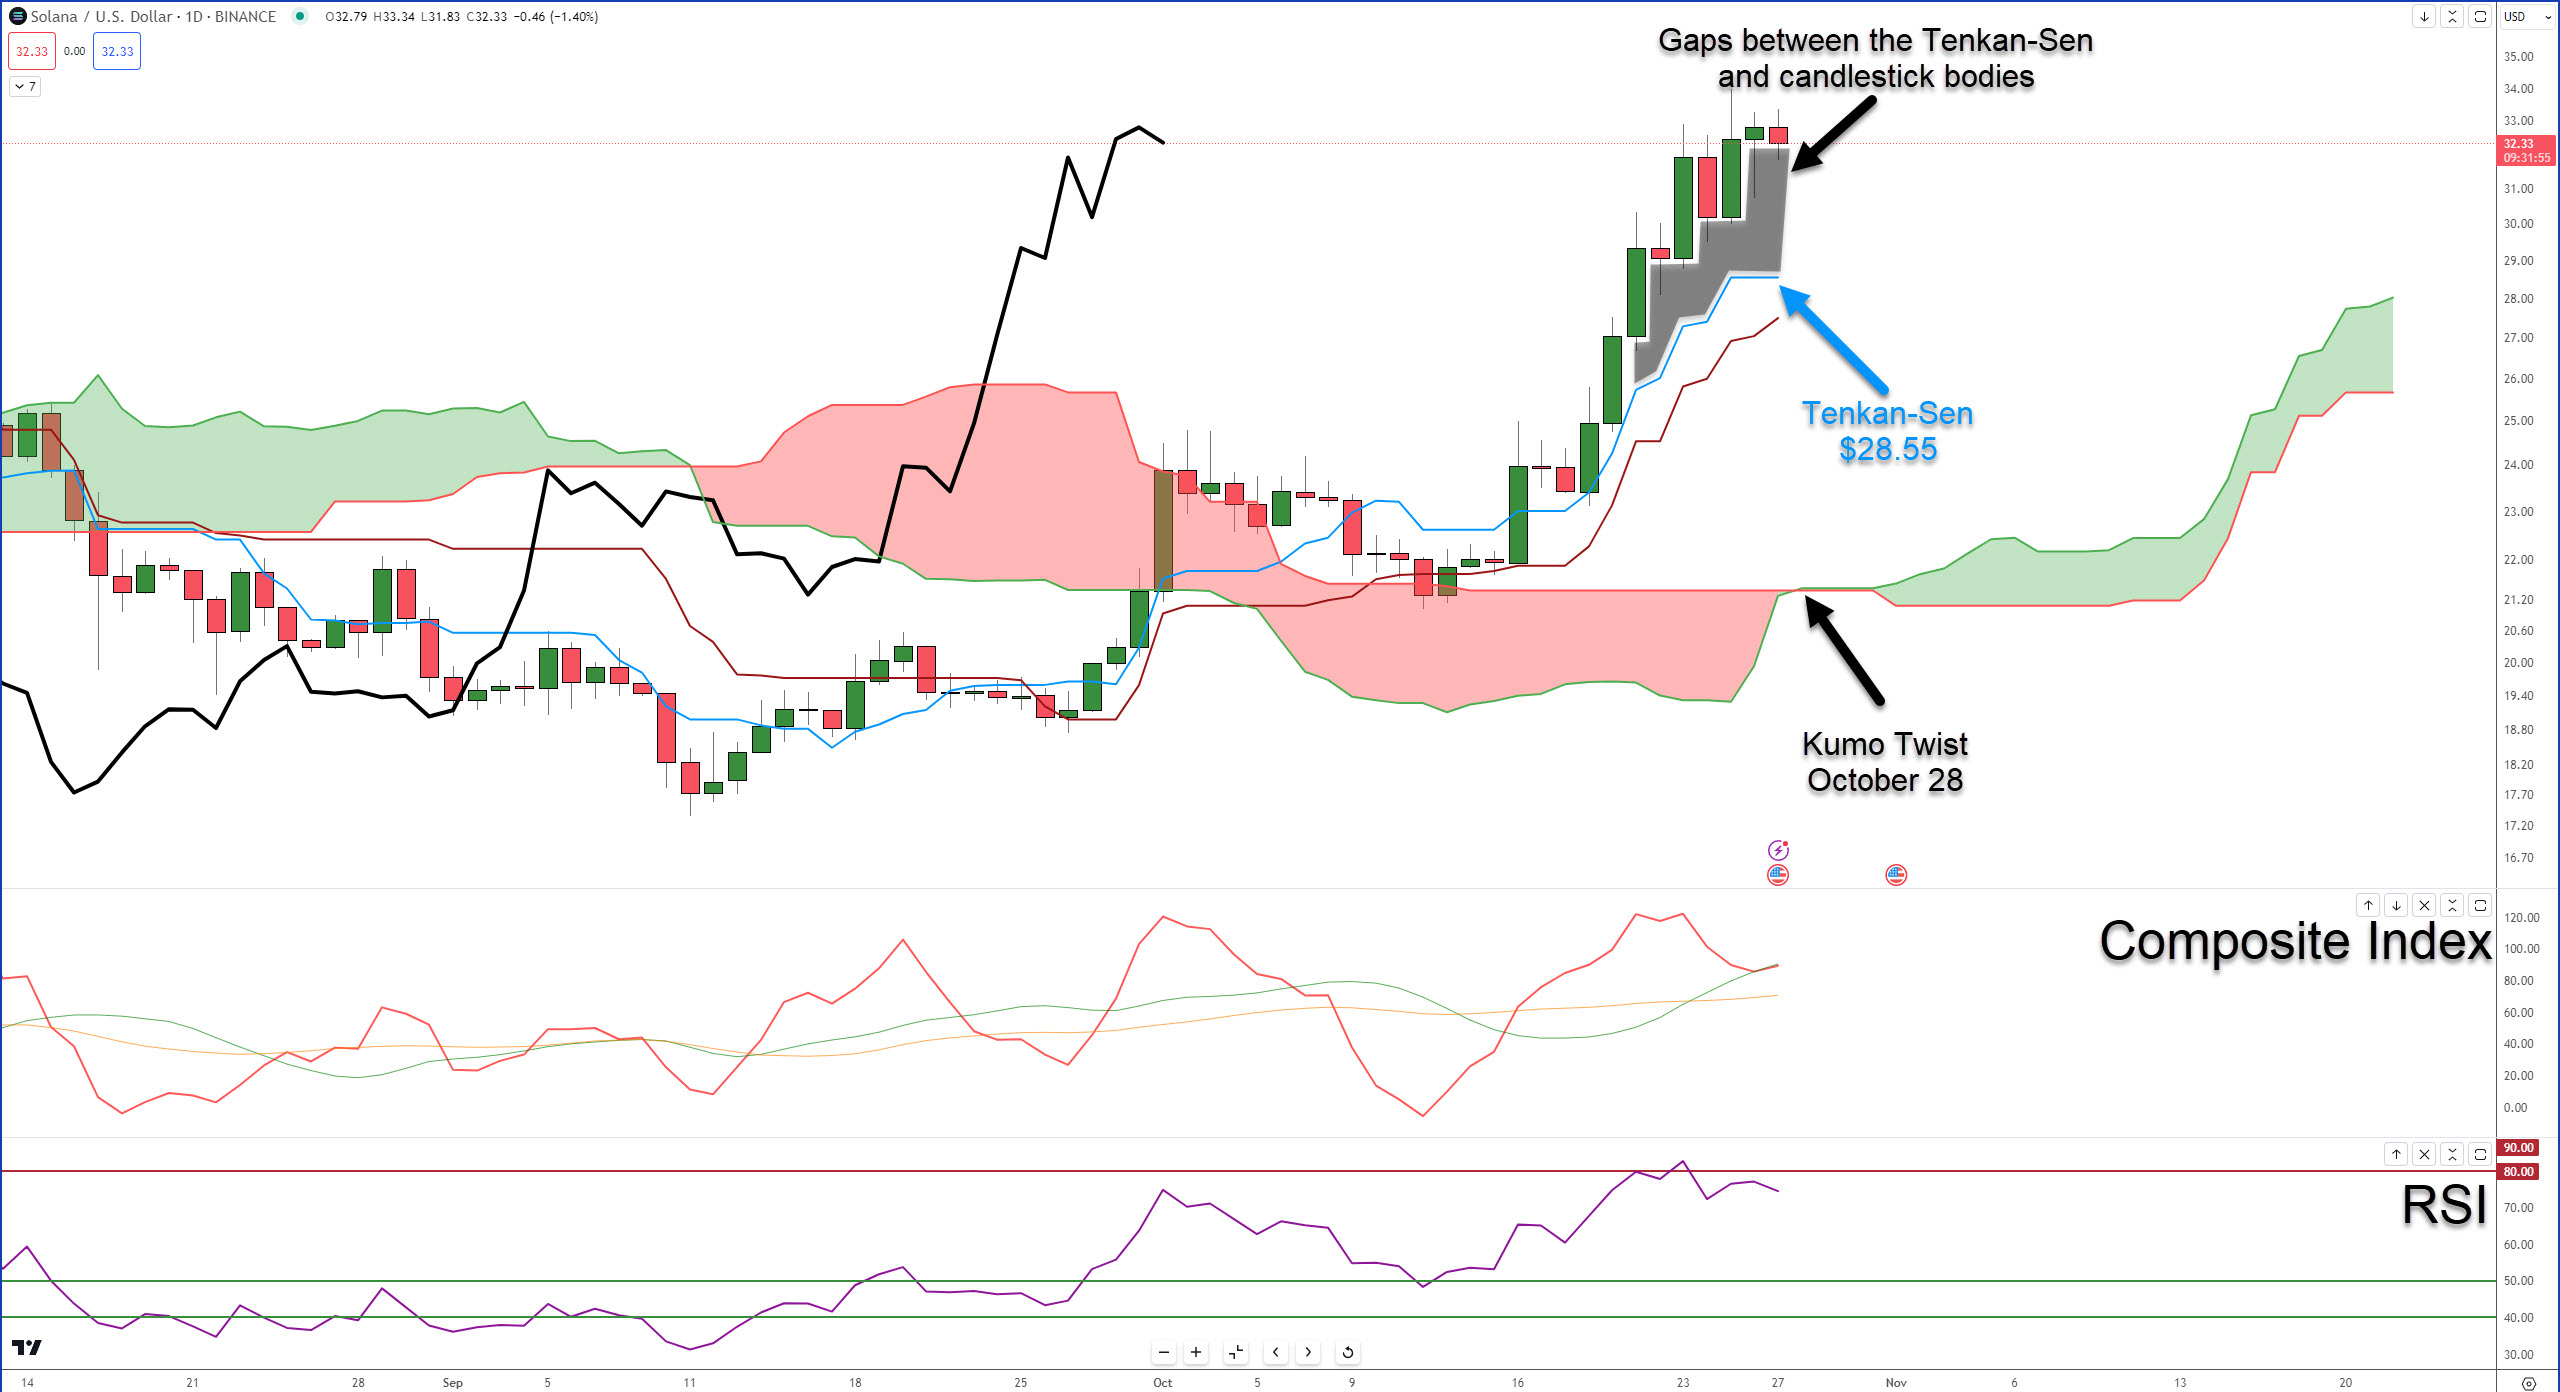
The only major difference is that Solana’s RSI has fallen below 80; tested it again and found resistance. There is also a Kumo Twist that occurs on October 28. When an instrument is trending strongly into the date of a Kumo Twist, that can often be where a new swing low/high develops.
The similarities between Solana and Chainlink diverge when looking at their weekly charts. 🛑
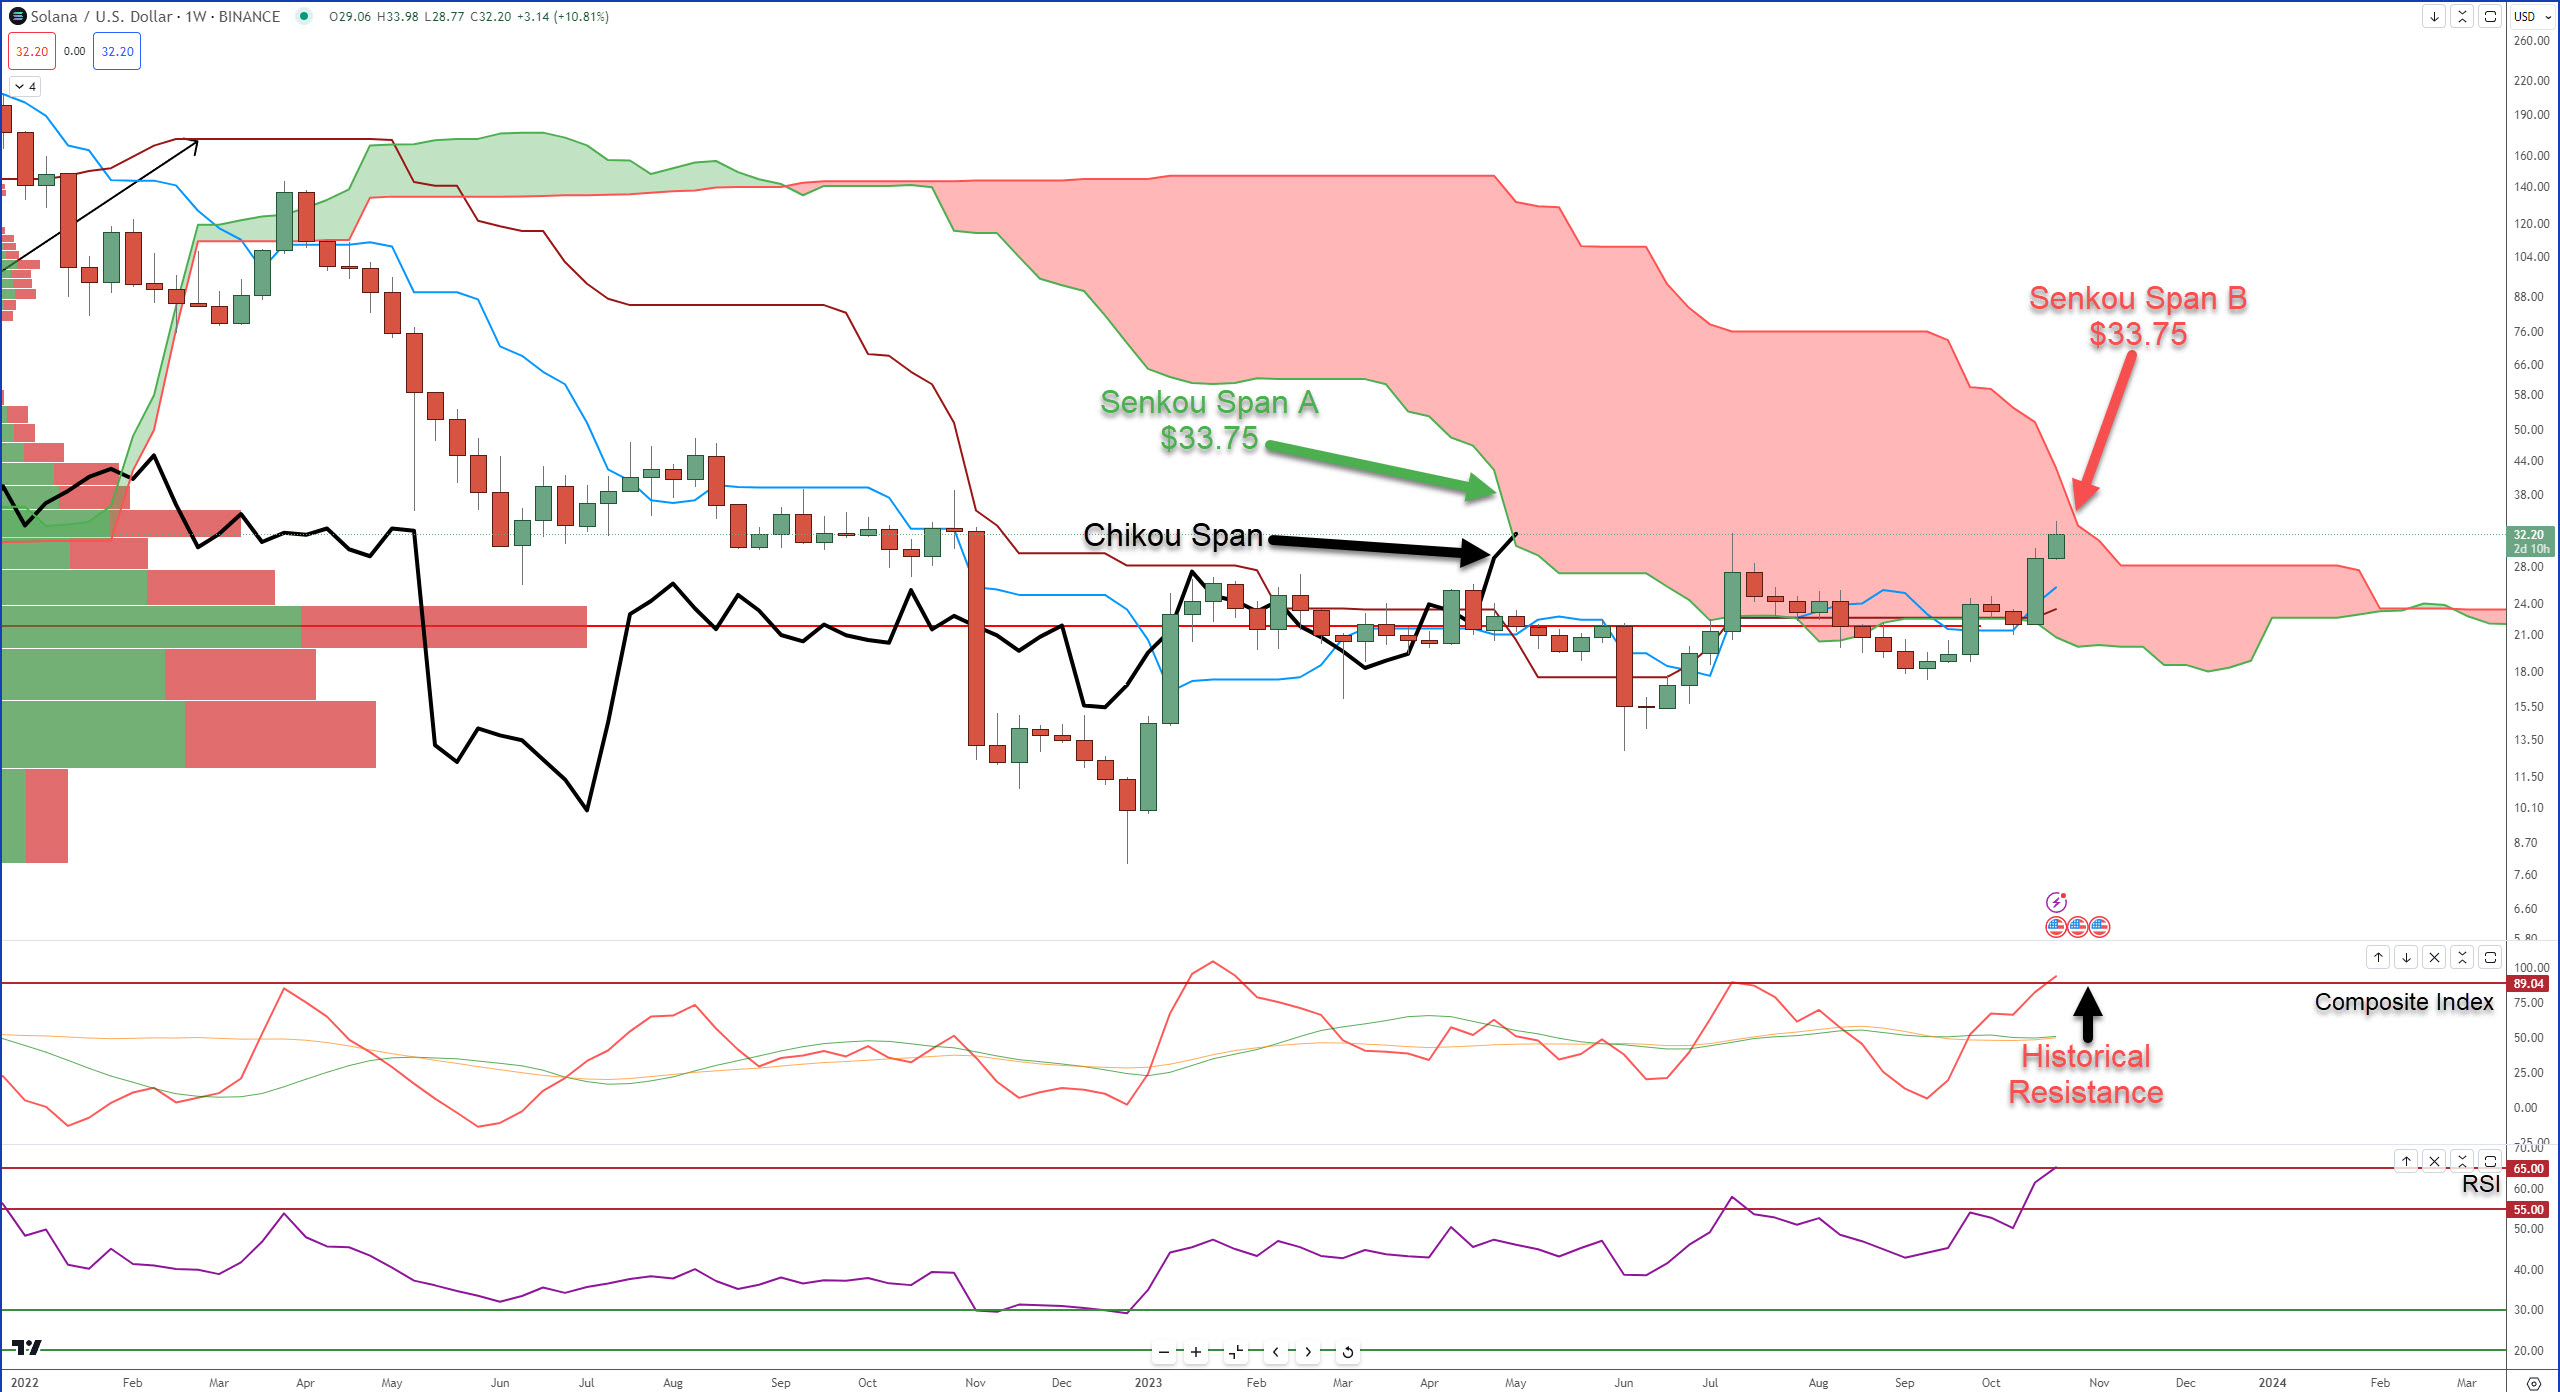
Solana’s still stuck inside the Cloud and faces the ugly double resistance of the Chikou Span hitting Senkou Span A and price hitting Senkou Span B.
The Composite Index and RSI are both against resistance zones – which doesn’t necessarily mean things will pull back. On the contrary, Solana’s attempting a breakout from a consolidation zone it has been stuck in since January 2023.
Additionally, Solana is close to completing one of the most sought-after bullish confirmation signals within the Ichimoku system: the Ideal Bullish Ichimoku Breakout. 🐂
Near-Term Support: $28.55
Near-Term Resistance: $33.75