If the culmination of all known and unknown variables is represented through price action, then yesterday’s Binance and CZ FUD was a nothing burger. 🍔
Binance, Kraken, the SEC, crime, bla bla bla bla, just noise – let’s look at some of the charts and see what price is doing, not how much noise the news is making.
0x
From an Ichimoku perspective, $ZRX is in no man’s land – above the Cloud but below the Tenkan-Sen and Kijun-Sen. ☁️
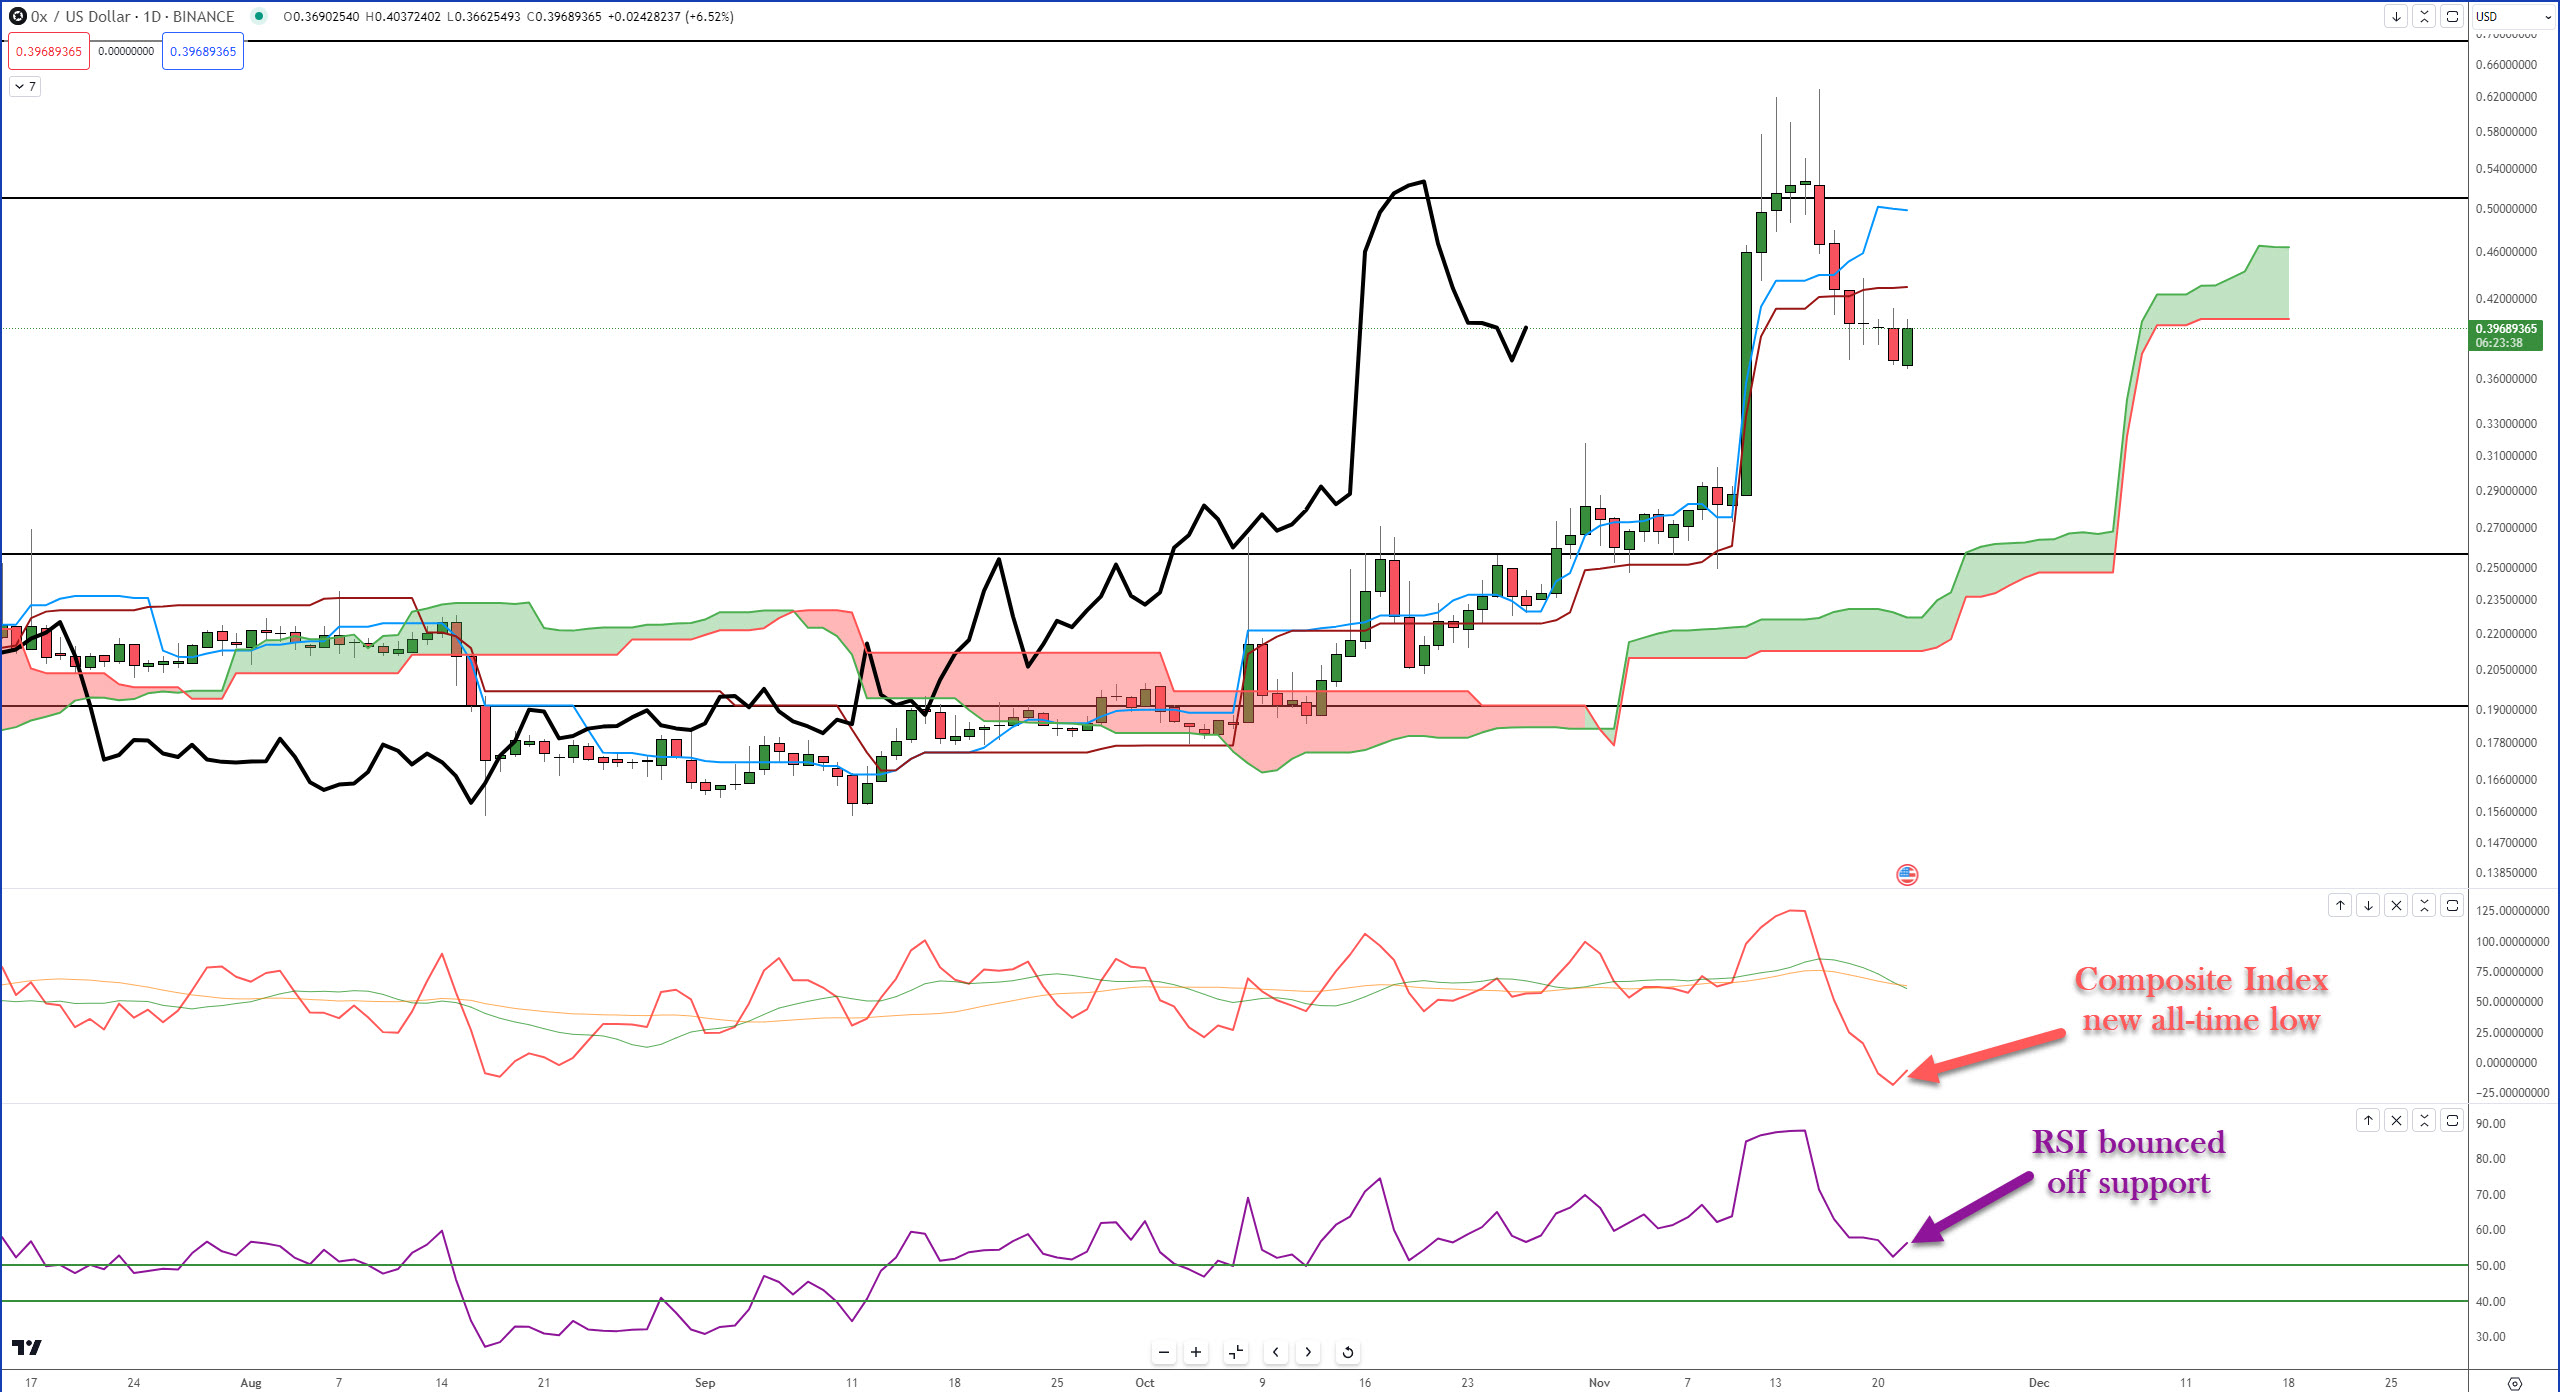
For bulls, there is some evidence that the recent move lower this week is just a retracement and that further upside movement has a high probability of returning.
First, the RSI is showing signs of finding support against the first oversold level in a bull market, 50. But the piece of data that is most interesting is the Composite Index.
Yesterday’s close didn’t just put the CI in a historical support zone – it made a new all-time low. In a nutshell, things look supportive for a return to the prior trend.
Yes, it looks bullish, but read the warning at the end of this Technically Speaking. 🔴
Uniswap
The world’s biggest CEX, Binance, is facing big withdrawals, and the world’s largest DEX, $UNI, is experiencing massive activity. 📈
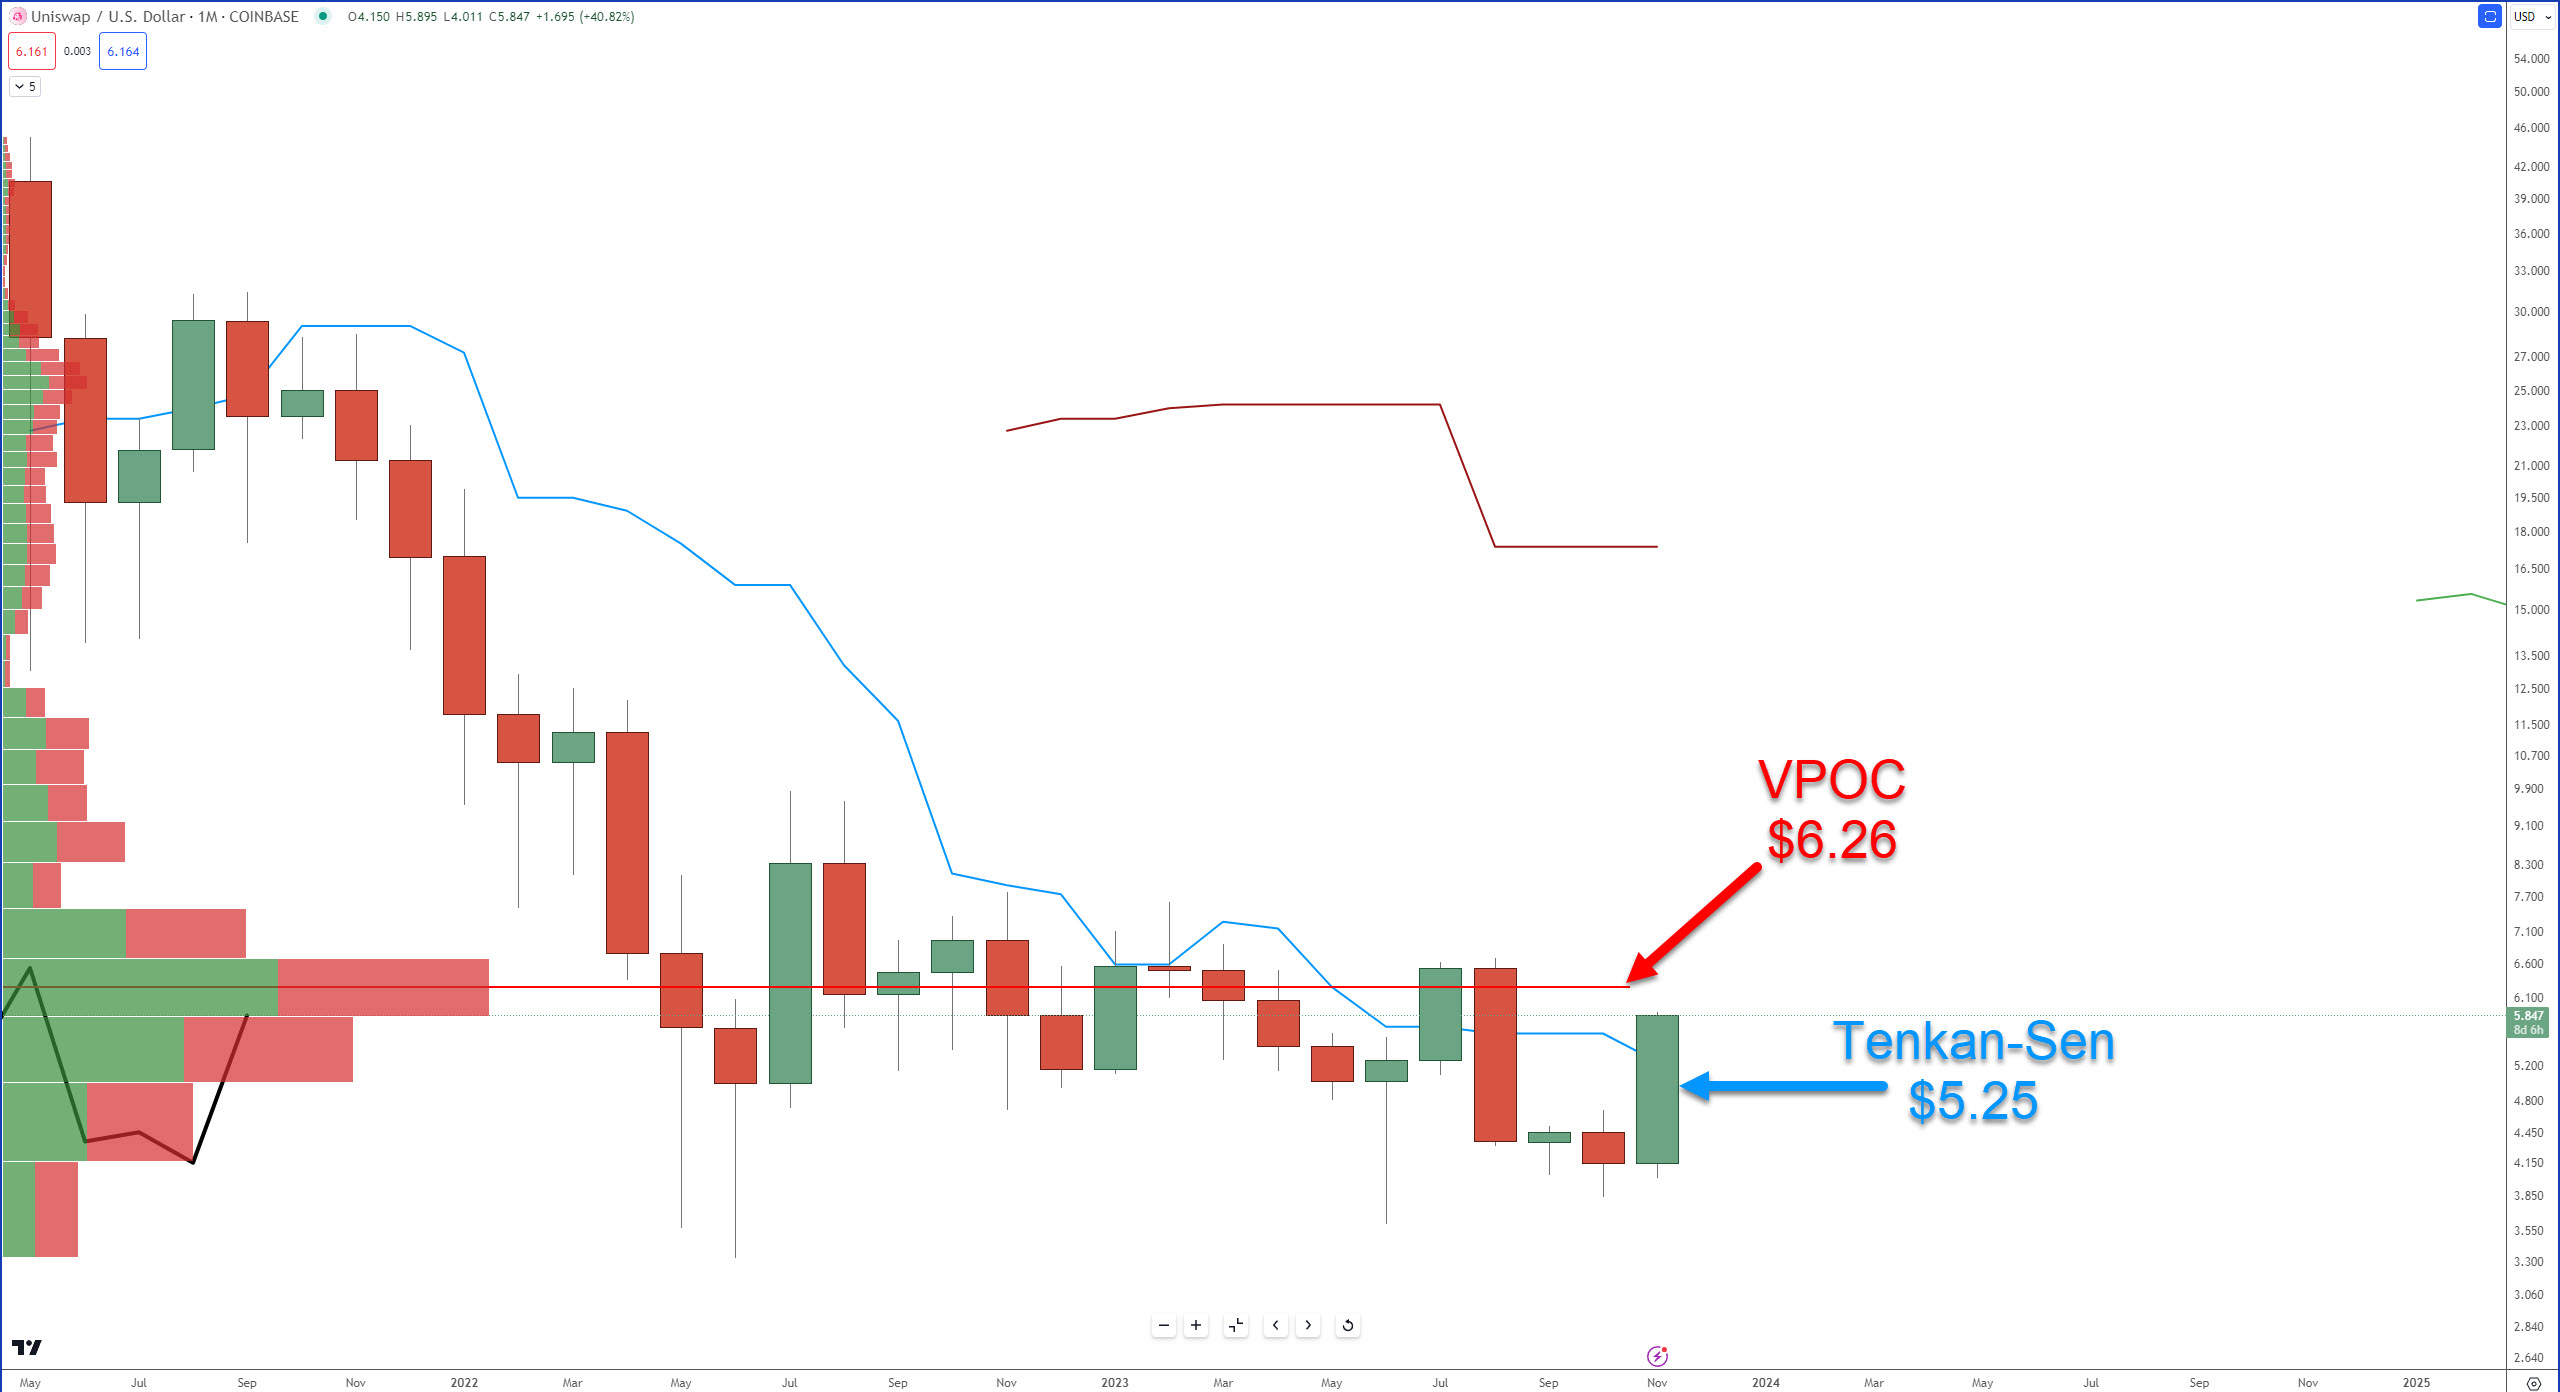
And it’s being reflected in the price action, up +24% at the time of writing. And if you go back to the November 6 Technically Speaking, Uniswap might just be getting started.
With roughly a week left in the month, Uniswap’s bulls are making an attempt to close above the monthly Tenkan-Sen for only the second time since July 2021.
Cardano
In the November 3, Technically Speaking, this is what Cardano’s weekly chart looked like 🔭:

Concerns about Cardano’s further upside potential were raised primarily due to the RSI and Composite Index (CI) resistance levels.
Bears have certainly made some strong attempts to keep $ADA out of and below the weekly Cloud – but the bulls have been playing a strong defense. Here’s what the current weekly chart looks like:
Despite the Composite Index sitting near historical resistance, the RSI has flat up against the final oversold level in a bear market (65) and is showing signs of breaking out above it.
Additionally, the Cloud is thin, giving bulls the best opportunity to break out above the Cloud for the first time since June 2020. 😲
AAVE
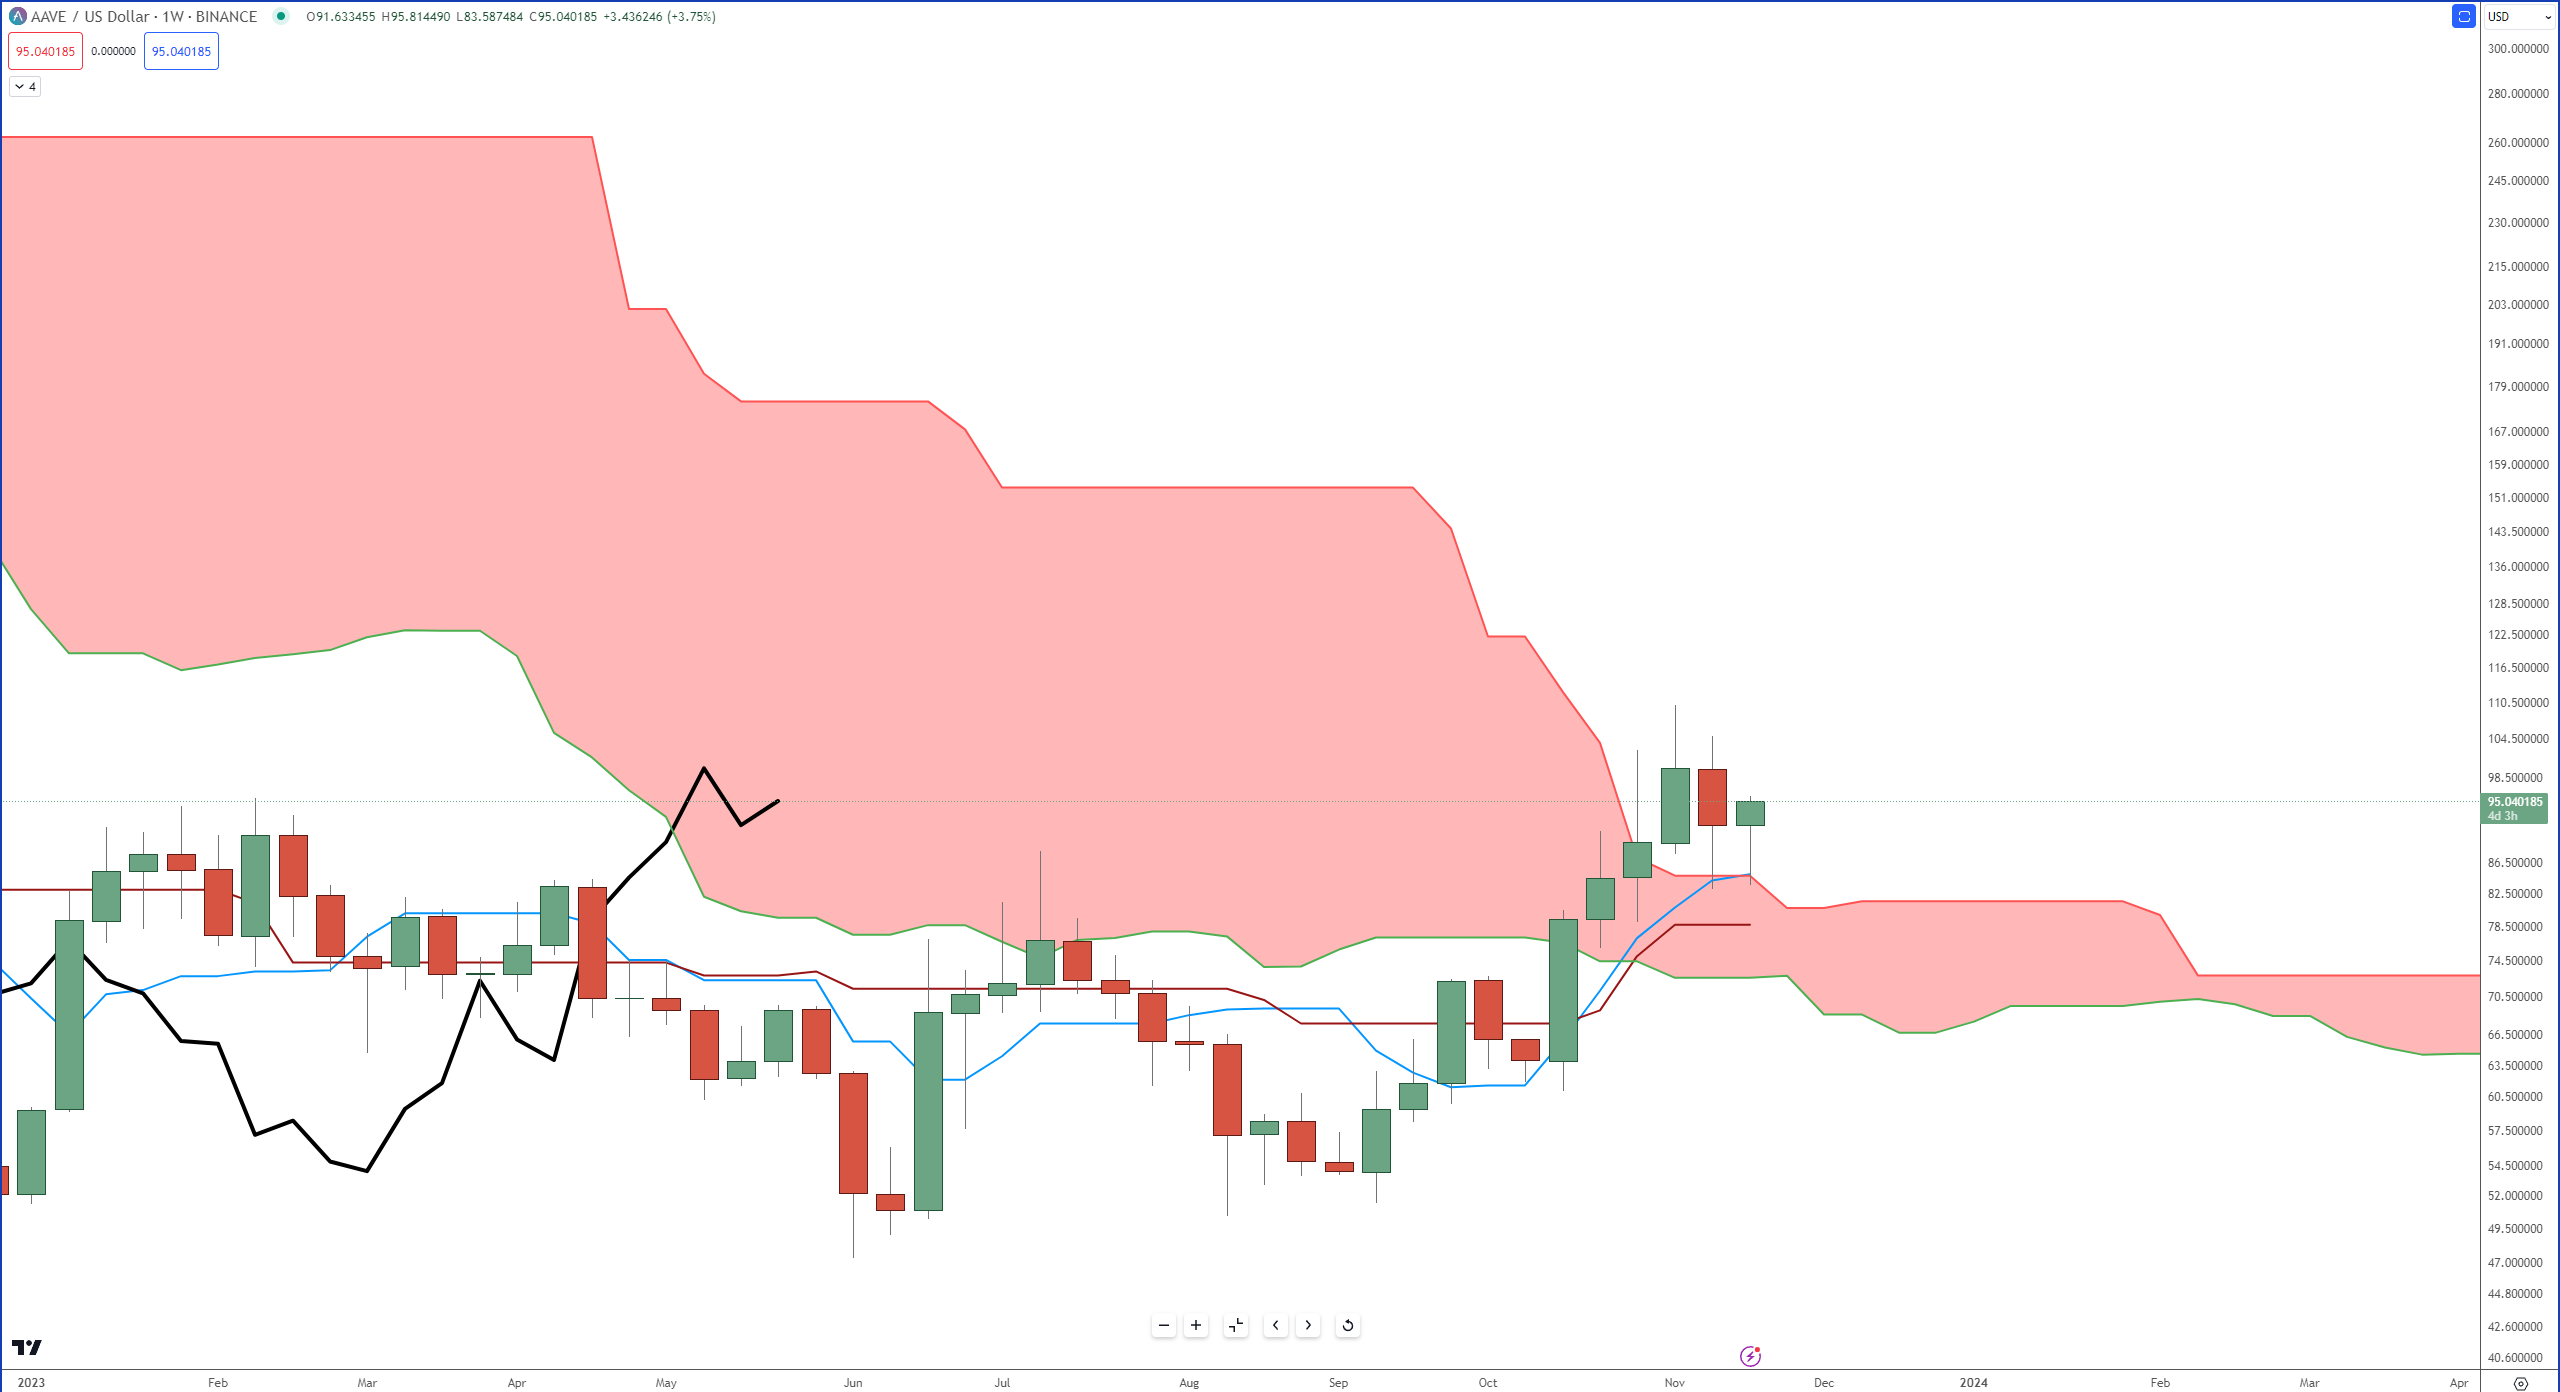
No need to dive deep into $AAVE‘s weekly chart – but it’s a good representation of a big section of the altcoin market because it looks just like AAVE’s.
There’s one chunk of the altcoin market sitting below the Cloud, waiting to catch up, and there’s another chunk, like AAVE, that has broken out above the Cloud and testing the legitimacy of that breakout.
Warning
Weekends are notorious in crypto for being bloody and ugly, with some of the most dramatic moves occurring over weekends – most often bearish. 🐻
Throw in the Thanksgiving holiday combined with Friday; there are four days’ worth of shenanigans this market can play. Despite a great many charts showing probable bullish continuation – keep an eye on what happens over the holiday weekend because that’s when rugs get pulled, bulls get turned into steak, and people’s fists and/or phones go flying out of anger.
Keep your eyes peeled. 👀