It’s a busy week of economic data, with yesterday’s focus on consumer prices. Today, we got an update on producer prices and much more, so let’s go through it. 📝
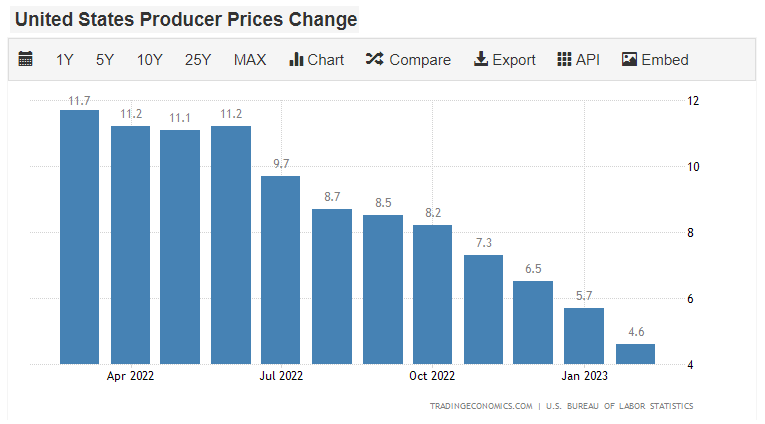
The headline producer price index (PPI) fell 0.1% MoM and was up 4.6% YoY. Analysts had expected February’s gain to match January’s at 0.3%. Meanwhile, core producer prices which exclude food and energy, were flat MoM and up 4.4% YoY. The market was expecting a 0.4% MoM gain.
Final demand goods prices fell by 0.2%, while final demand services prices dropped by 0.1%. Driving a good portion of the decline was egg prices finally cracking, falling 36.1% amid supply chain improvements. 🐣
Overall the continued downward progress is a welcome sign for the Federal Reserve. Producer prices tend to lead consumer prices, so hopefully, this means that a further deceleration is ahead. 🤔
As we discussed yesterday with consumer prices, crude oil began another leg lower. Today’s weekly petroleum data from the Energy Information Administration (EIA) showed a surprise crude oil inventory build of 1.6 million barrels. That pressured prices further, with them down six of the last seven days. If prices settle at these lower levels (or continue declining), that will be a tailwind for consumer and producer price inflation readings in the coming months. 🛢️
February retail sales fell by 0.4% MoM, following a revised 3.2% rise in January. After January’s strong rebound in auto sales, a decline of 1.8% in February dragged down the headline number.
Excluding autos, retail sales fell 0.1%. Driving that decline was sales at department stores (-4.0%), furniture stores (-2.5%), and restaurants (-2.2%). On the other hand, the report showed an uptick in spending online and at electronics stores, health and beauty stores, and food retailers. 🛍️
Consumer spending has been easing, particularly on discretionary goods and non-essential purchases. Retailers across the spectrum have offered more cautious outlooks for 2023, citing inflationary pressures, macroeconomic uncertainty, and a weak(er) housing market. If the market volatility continues and this bank sector situation turns into a full-blown crisis, that will likely keep a lid on consumers’ confidence and willingness to spend. 👎
U.S. business inventories fell for the first time in nearly two years in January. The Commerce Department report showed they dropped 0.1% MoM, marking their first decline and the weakest reading since April 2021. Wall Street was expecting that inventories would be unchanged MoM. 📦
This weakness matters because inventories are a critical factor in the calculation of GDP. Last quarter inventories accounted for half of the 2.7% YoY growth in GDP. However, businesses may need to liquidate the excess inventory they accumulated last quarter and order less. That would likely weigh on the first quarter’s GDP print. 🔻
Manufacturing activity remains volatile. The New York Fed’s empire state survey fell well short of the -7.9 reading expected, coming in at -24.6 for March. Driving March’s decline was the New Orders Index (-13.9 MoM), the Shipments Index (-13.5 MoM), and the Number of Employees Index (-3.5 MoM).
One positive aspect of manufacturing activity cooling down is less upward pressure on inflation. The current Prices Paid Index fell by 3.1 points MoM, and expectations for the index six months ahead fell by 18.1 points to the lowest since late 2020. 🏭
The U.S. manufacturing sector is expected to remain volatile. January’s report showed activity in the NY region slipped to its lowest level since the pandemic began, reaffirming its downward trend.
And last and sort of least, let’s touch on housing. The National Association of Home Builders (NAHB) reported its housing market index (HMI) rose from 42 in February to 44 in March. Analysts were expecting a decline to 40. The way this measure is interpreted is that any number below 50 indicates that more builders surveyed view conditions as poor than good. And vice versa. 🏘️
Driving the increase was an uptick in single-family homes from 47 to 49. And the traffic of prospective buyers jumped from 28 to 31. Meanwhile, single-family home sales expectations for the next six months ticked down from 48 to 47. Overall, the unexpected improvement in traffic was the differentiating factor in this month’s report.