We’ve written extensively about the U.S. housing market’s troubles over the last eighteen months. But we saw a visual created by Michael McDonough and shared by Cullen Roche that really highlights just how rough things have gotten for homebuyers. 😬
Below is a chart that looks to track an “average” home purchase over the last 20+ years. It calculates the monthly mortgage payment using median existing home prices, assuming a 20% down payment and average 30-year mortgage rates.
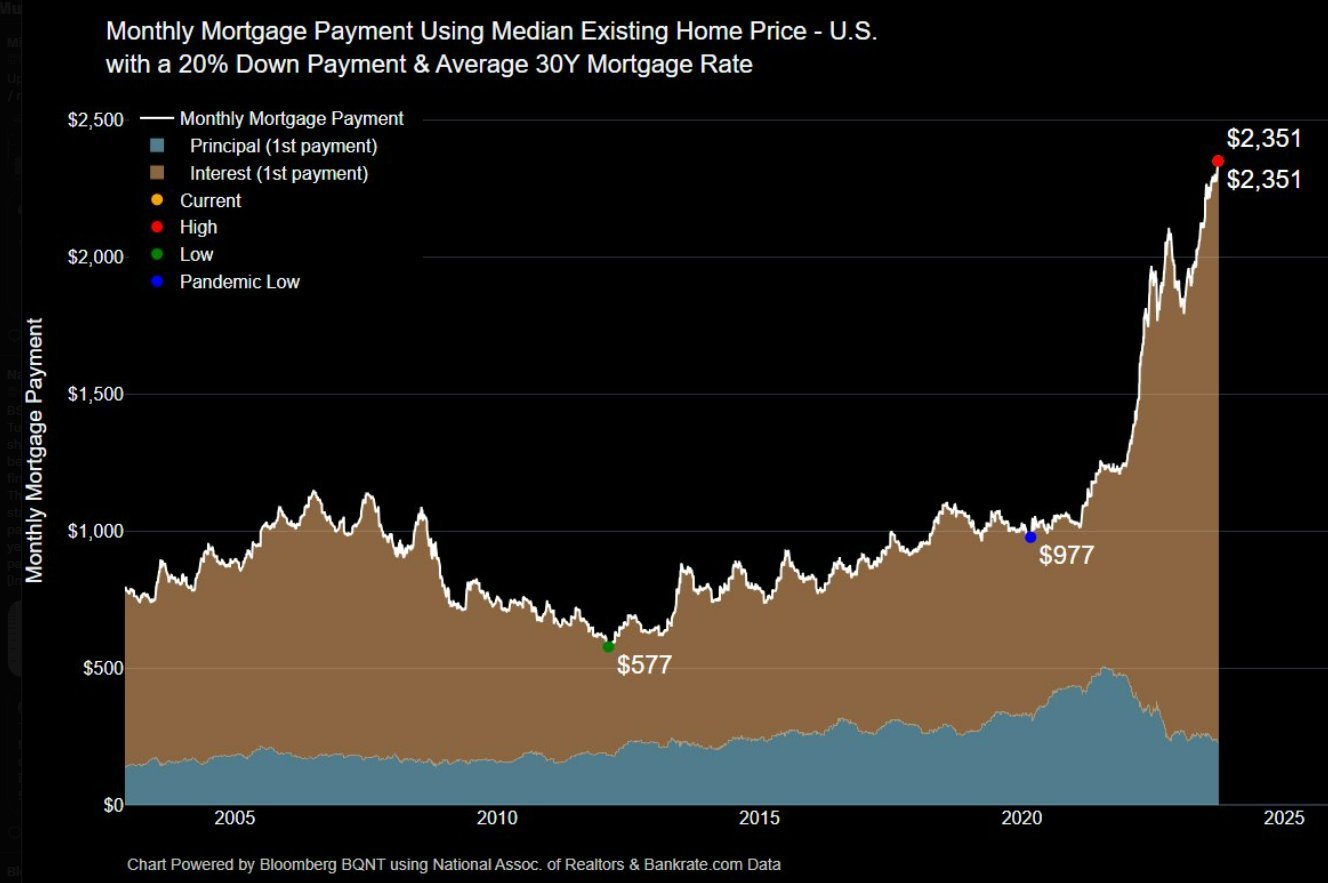
After the great financial crisis, low home prices and interest rates were significant tailwinds for keeping this value in a reasonable range. But during the pandemic, there was an explosion in demand for homes, driving up prices. And then the Fed lifted interest rates at their fastest pace ever, causing a major double-whammy for homebuyers. 😬
The result? The average monthly mortgage payment is up 141% from its pandemic low of $977. That’s the type of increase that previously took years to take place. And yet it’s happened in about three years, as shown by the parabolic rise in this chart since then. 📈
For those who already own a home and are locked in low rates, this dramatically boosts their net worth. But for those Millennials and Gen Zers looking to purchase their first home, form families, and begin having kids, they’re facing the worst affordability in decades.
This chart is a stark reminder of the current U.S. housing environment and the potential economic impact of those who want to form households not being able to do so at current prices. The current headwinds will unlikely improve until a financial shock or economic downturn “forces” people to sell their homes. Barring builders creating a lot more new construction, that’s about the only thing that will improve existing inventory levels, as current owners have little incentive to move. 🏘️
As for today’s housing-related data, pending home sales fell 7.1% MoM and 18.7% YoY in August, as average mortgage rates rose to twenty-three-year highs. In most parts of the country, it’s more affordable to rent than buy at current prices. Especially when considering the many other costs associated with owning, like property taxes, insurance, repairs, etc. 💸