How Stocks Ended “Ooptober”

Well, it was another wild month for the markets in October. Seasonally, it tends to be a rough period for the stock market, so it certainly lived up to that by crushing investors’ hopes for an “Uptober.” Let’s see how the various asset classes did. πŸ‘‡

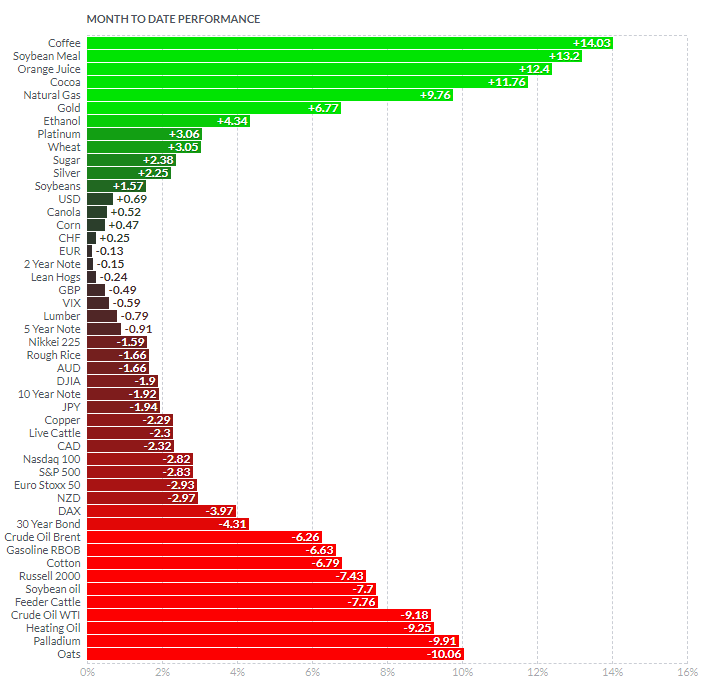
First, we’ll start with the Finviz futures chart summarizing the major asset classes. As we can see, October was a good month for several commodities but pretty rough for the rest of the market. Bonds continued their decline, while the average stock continued to struggle.

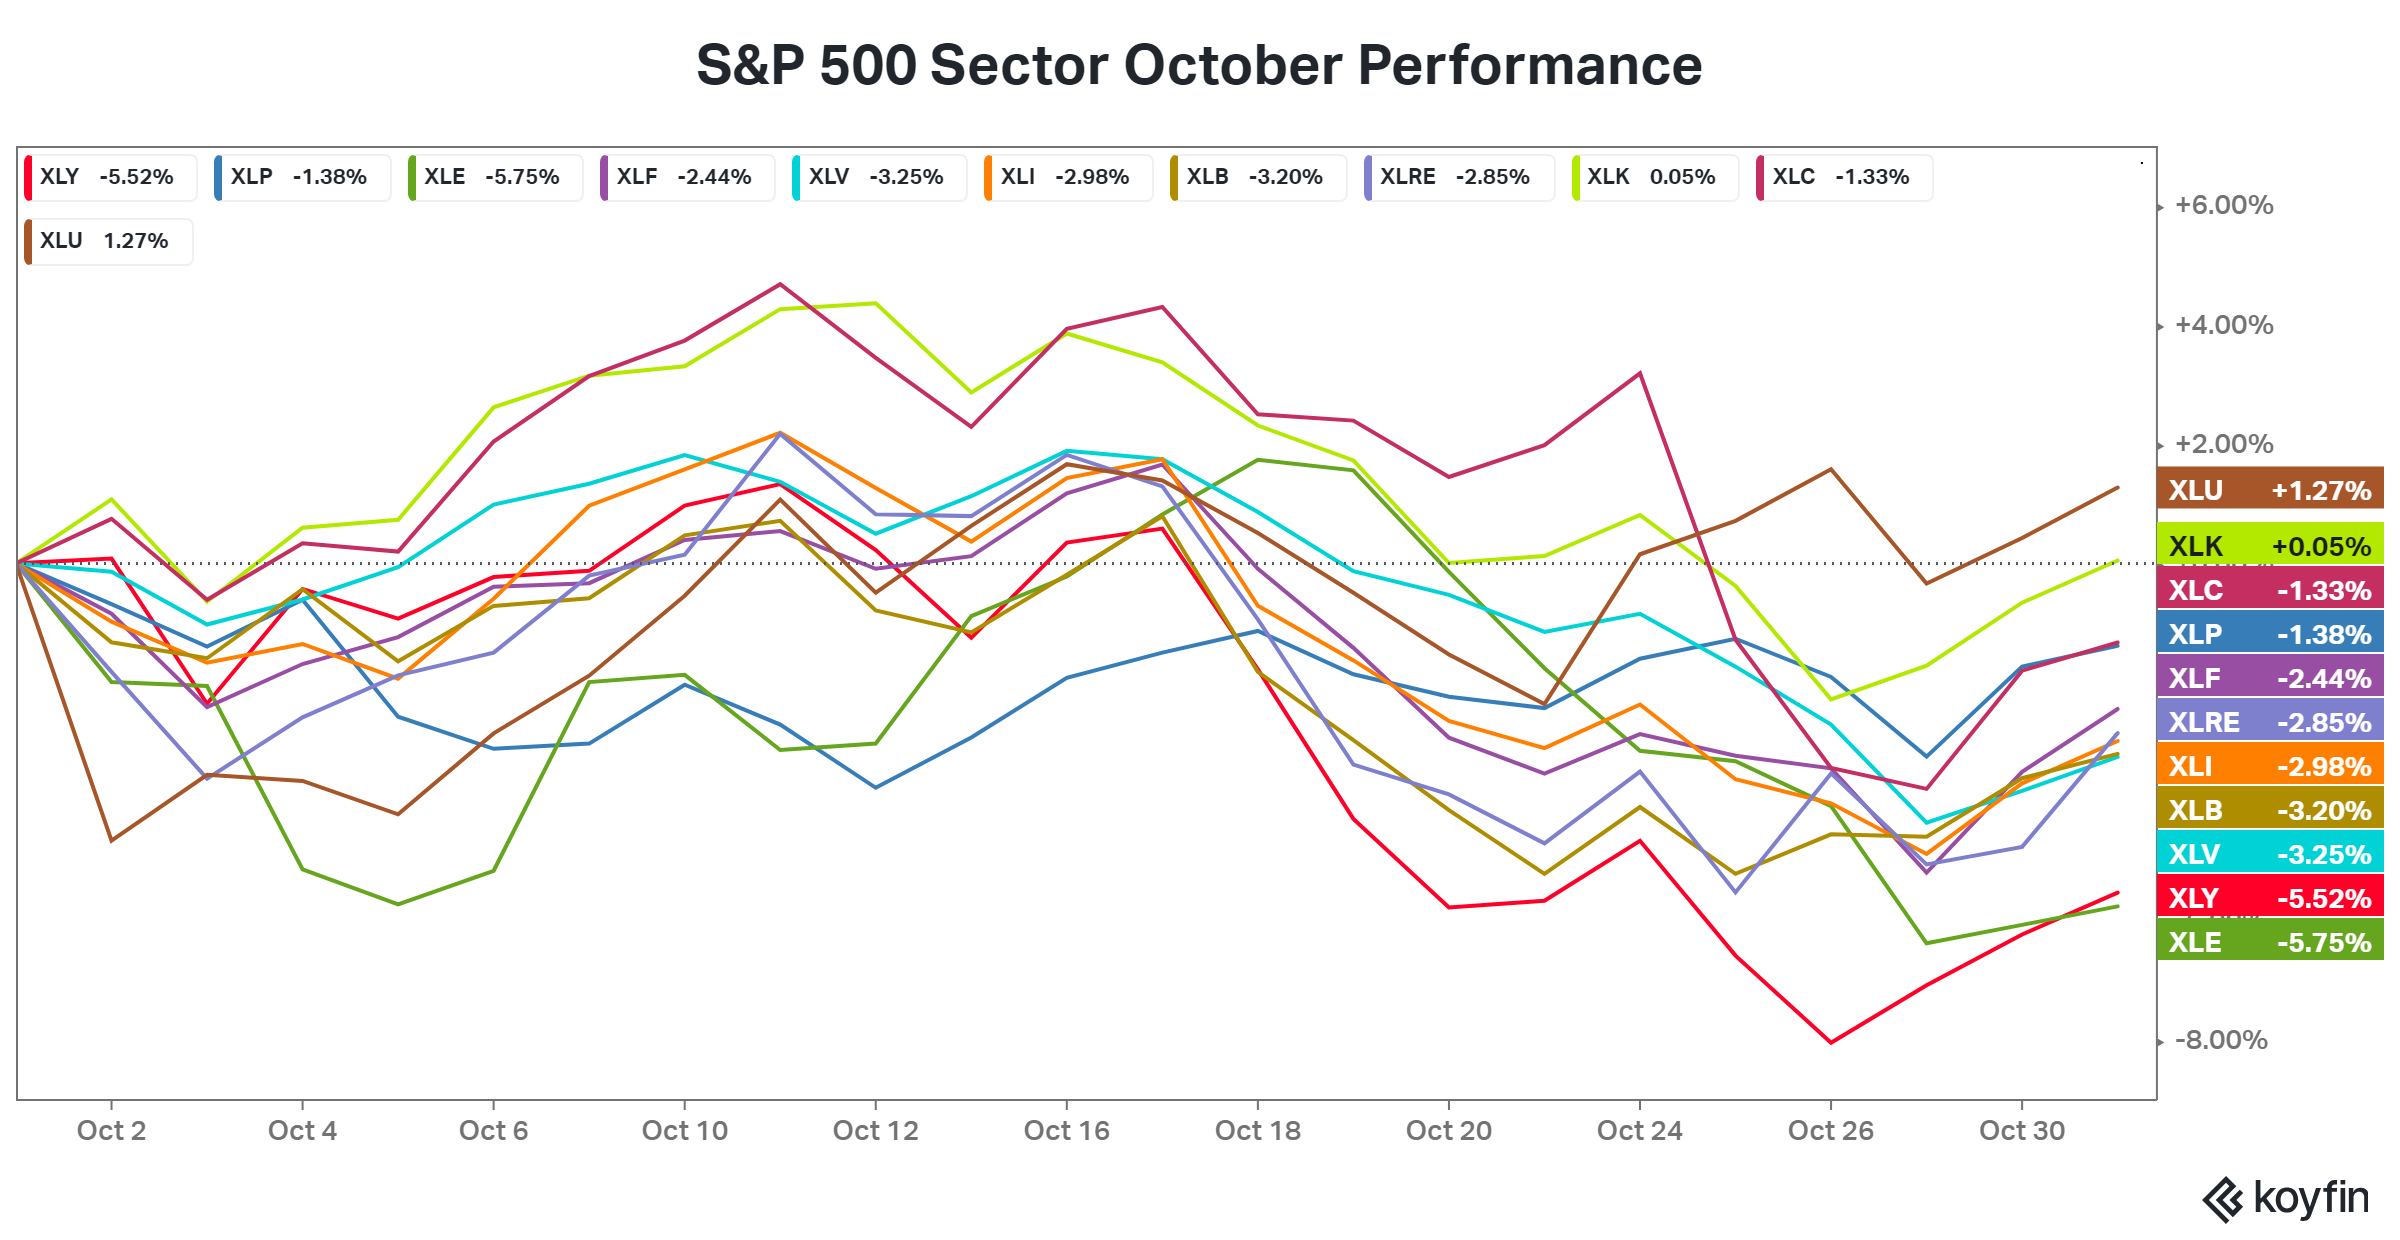
Until last week, the “magnificent seven” mega-cap technology stocks had been holding up the Nasdaq 100 and S&P 500, but earnings finally gave bears an edge there too. 🐻

Meanwhile, consumer discretionary and energy led the sector declines while utilities and technology managed to eke out a small gain. Interest rates and earnings continue to drive sector performance right now, which has been leaning more defensive as global recession fears reverberated again. πŸ“Š

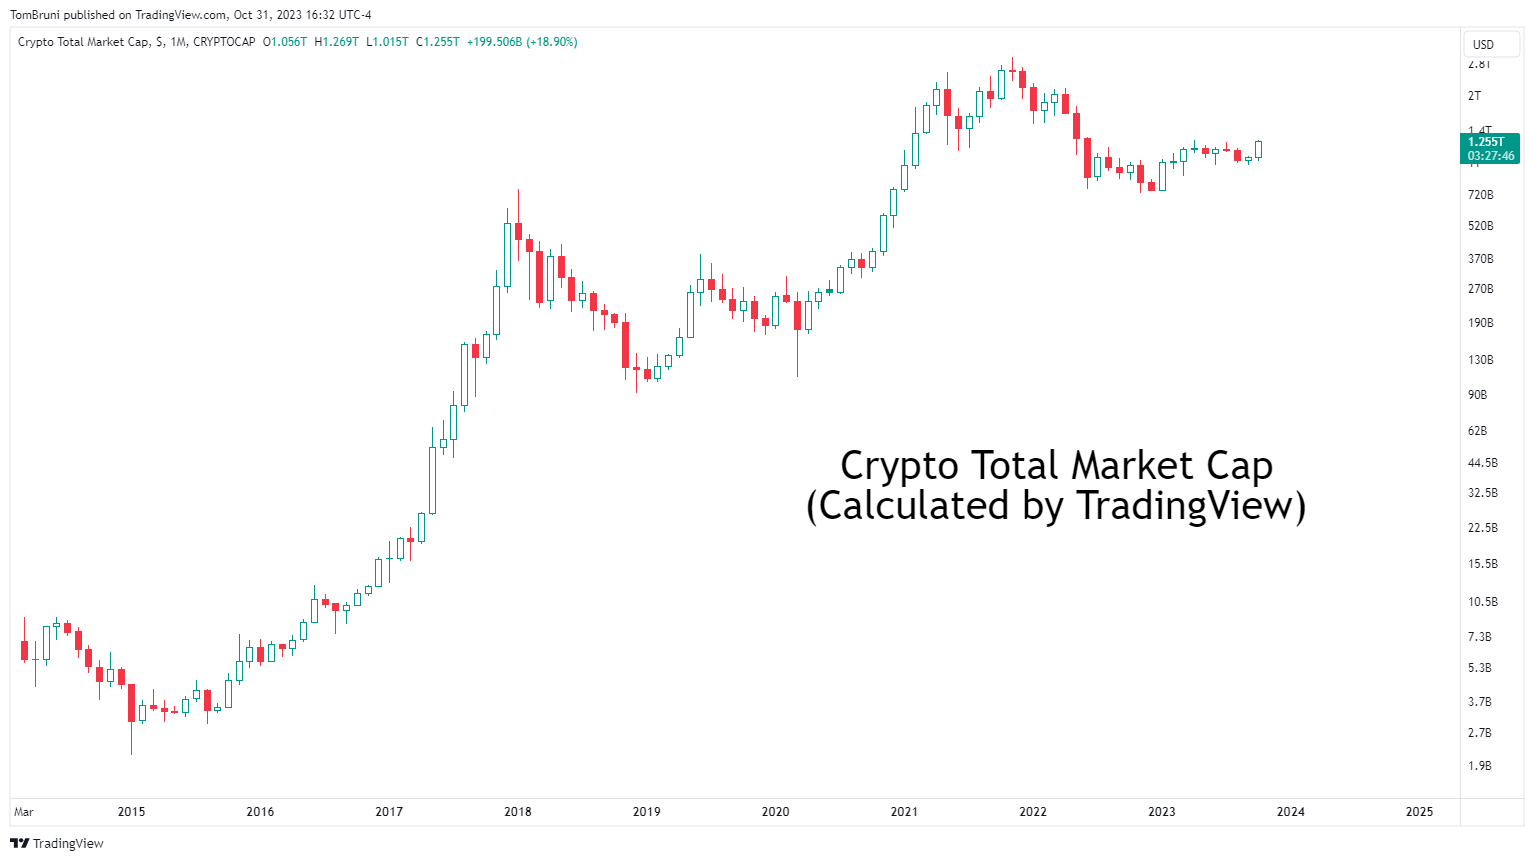
The only market to experience a significant “Uptober” was crypto, which saw its total market cap increase by a whopping 19%. That brought it firmly back above the $1 trillion mark as optimism grows that a spot Bitcoin ETF will be approved sometime soon. β‚Ώ

Overall, it was a messy month of October. With two months left in the year, there are a lot of money managers that need to catch their benchmarks. Combine that with the many macroeconomic and geopolitical concerns facing the world, and we’ve got a recipe for continued volatility. 😬

Learn More About...

More in   Stocks

View All

The Tale Of Three IPOs

We last talked about the U.S.’s largest initial public offerings (IPOs) a month ago, when their results failed to inspire confidence among investors. However, we wanted to bring them back this week because at least one of them is perking up. πŸ‘€

The chart below shows Arm Holdings closing at its highest level since coming public, now firmly in positive territory. Klaviyo, which started off hot, is between its highs and lows. But Instacart remains on a downward path, making fresh lows this week before rebounding marginally. πŸ“Š

Read It

Traders’ Updated S&P 500 Roadmap

Just because the calendar changes dates doesn’t mean the market’s trends do. As such, now seems like a great time to update the S&P 500 roadmap many traders used throughout 2023. πŸ—ΊοΈ

Below is a two-year daily candlestick chart with a few key indicators. The first is the 200-day moving average (blue), which traders use to track the long-term trend in the market. The next two are the anchored volume weighted average price (AVWAP) from the market’s 2022 highs and 2022 lows. Traders use this to track how the average buyer/seller has fared in the market from a specific date.

Read It

International Markets Are Partying, Too

There are plenty of U.S. stocks for investors to focus on. However, occasionally, international stocks will pop up on the radar. And this year is one of those times. ⌚

Below are four examples of international indexes hitting new all-time highs, including Germany’s DAX, Poland’s Warsaw Stock Index, Brazil’s Bovespa, and India’s Nifty 50. It shows a range of both developed and emerging markets seeing strong demand from investors around the globe. πŸ“ˆ

Read It

Traders Eye IPOs Into 2024

After a rough patch from late 2021 through 2022, this year, the initial public offering (IPO) tried to make a comeback. Now, traders say 2024 could be the year this turnaround really comes. πŸ‘Β 

Below is a chart of the Renaissance IPO ETF ($IPO), which is up about 53% so far this year. But technical analysts and traders say that its recent breakout to roughly eighteen-month closing highs signals a critical trend change in prices. They argue that prices staying above the 35-37 range, which has previously served as an inflection point in the stock, would suggest momentum has shifted firmly to the upside.Β πŸ™ƒ

Read It