Advertisement|Remove ads.
Is Silver's Recent Double-Top Formation Concerning? Ole Hansen Talks About Some Important Levels To Watch Out For

- Hansen noted that to avoid triggering the bearish setup, silver needs to stay above $48.92 mark.
- Over the last six months, silver prices have surged nearly 60%.
- The expert noted that on the upside, if silver pulls back slightly and then rebounds around $51 per ounce, it would signal a strong bullish signal.
Advertisement|Remove ads.
Driven by concerns surrounding geopolitical turmoil, safe-haven assets have been drawing investor interest, as reflected in the sharp rise in gold and silver prices. Over the last six months, silver prices have surged nearly 60%, including a 10% jump this week.
However, the spot silver chart suggests a double-top pattern, a formation that often precedes a downturn.
Advertisement|Remove ads.
In a post on X on Friday, veteran commodities expert and Head of Commodity Strategy for Saxo Bank, Ole Hansen, flagged key levels to watch out for. Hansen stated that to avoid triggering that bearish setup, silver needs to stay above $48.92 per ounce during this equity-driven risk-off phase. Ideally, prices should remain above the $ 50-per-ounce mark, Hansen added.
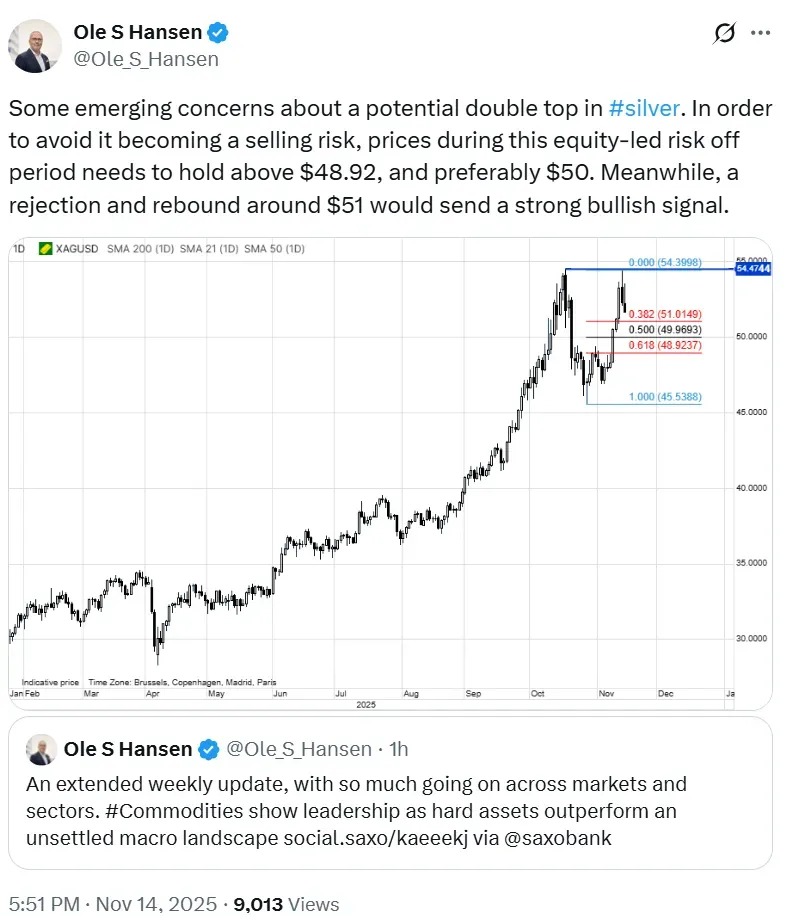
At the time of writing, spot silver (XAG/USD) was down 3% at $50.70 per ounce.
Advertisement|Remove ads.
The expert noted that on the upside, if silver pulls back slightly and then rebounds around $51 per ounce, it would signal a strong bullish signal.
Silver Leads Commodities Rally
In a Saxo Bank report on Friday, Hansen noted the Bloomberg Commodity Index is heading for its best week since June and is up more than 15% this year, with nearly every major commodity category contributing to the rally, including precious metals, energy, grains, and industrial metals.
Silver, natural gas, sugar, gold, and soybeans are among the top performers. This broad strength stands out against the weakness in tech stocks and crypto, he wrote. Silver prices are set to rise for the seventh consecutive month and for the ninth time in the past eleven months. On Thursday, silver prices jumped to an all-time high of $54.42 per ounce.
Advertisement|Remove ads.
Silver has significantly outperformed gold over the past six months, with 27.6% gains – more than double those of gold (XAU/USD).
For updates and corrections, email newsroom[at]stocktwits[dot]com.
Comments posted here will also appear on symbol pages.
Latest News
/filters:format(webp)https://news.stocktwits-cdn.com/large_Getty_Images_2225258760_jpg_e1ca6549bf.webp)
/filters:format(webp)https://st-everywhere-cms-prod.s3.us-east-1.amazonaws.com/IMG_9209_1_d9c1acde92.jpeg) Yuvraj Malik·34m ago
Yuvraj Malik·34m ago/filters:format(webp)https://news.stocktwits-cdn.com/large_pharma_stock_jpg_490939e580.webp)
/filters:format(webp)https://news.stocktwits-cdn.com/IMG_8805_JPG_6768aaedc3.webp) Deepti Sri·35m ago
Deepti Sri·35m ago/filters:format(webp)https://news.stocktwits-cdn.com/large_oil_stocks_jpg_6935abe231.webp)
/filters:format(webp)https://news.stocktwits-cdn.com/Aashika_Suresh_Profile_Picture_jpg_2acd6f446c.webp) Aashika Suresh·40m ago
Aashika Suresh·40m ago/filters:format(webp)https://news.stocktwits-cdn.com/large_Getty_Images_2272001852_jpg_239080114e.webp)
/filters:format(webp)https://news.stocktwits-cdn.com/shivani_photo_jpg_dd6e01afa4.webp) Shivani Kumaresan·55m ago
Shivani Kumaresan·55m ago/filters:format(webp)https://news.stocktwits-cdn.com/large_starlink_jpg_781ee1fb72.webp) Deepti Sri·1h ago
Deepti Sri·1h ago/filters:format(webp)https://news.stocktwits-cdn.com/large_Getty_Images_2252194207_jpg_9605cd50d5.webp)
/filters:format(webp)https://st-everywhere-cms-prod.s3.us-east-1.amazonaws.com/unnamed_jpg_9dff551b50.webp) Anan Ashraf·3h ago
Anan Ashraf·3h ago