Advertisement|Remove ads.
MapmyIndia Shares: SEBI RA Harika Enjamuri Sees Nearly 20% Upside If ₹1,950 Is Breached


All eyes are on MapmyIndia as the digital map data provider gears up to report fourth-quarter results on Friday.
The counter has been on a strong uptrend, rallying over 7% in the past week and clocking a near 10% gain in the last month.
SEBI-registered analyst Harika Enjamuri notes that strong institutional interest and the growing adoption of MapmyIndia’s solutions across both government and private sectors position the company to capitalize on India’s ongoing digital transformation.
Advertisement|Remove ads.
On the technical front, she observes that the stock has recently broken above the ₹1,600–₹1,760 range, with sustained momentum pushing it past all major moving averages on the daily chart — the 9, 70, and 100-day Exponential Moving Averages — a sign of trend strength.
“The RSI is currently at 68, just below the overbought mark, which suggests there’s still buying interest but also the need for caution at elevated levels,” she said.
On the weekly chart, MapmyIndia is nearing a crucial resistance zone between ₹1,948 and ₹2,068, with the 70-week moving average at ₹1,914 acting as a near-term hurdle.
Advertisement|Remove ads.
Enjamuri adds, “A decisive close above ₹1,950 could open the gate for a rally towards ₹2,065 and eventually ₹2,270 in the medium term. But if it fails to break past rejection near ₹1,950, a pullback towards ₹1,840 or even ₹1,760 is possible.”
For Friday’s session, if the broader market remains stable, the stock could attempt the ₹1,940–₹1,950 levels.
Enjamuri advises investors that while the overall trend remains bullish, traders are advised to watch for profit booking or reversal signs near key resistance zones.
Advertisement|Remove ads.
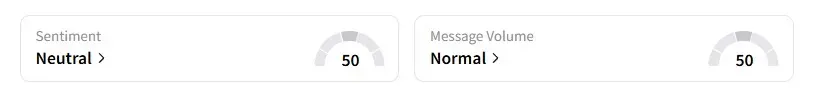
Data on Stocktwits shows retail sentiment remains ‘neutral’ on this counter.
MaymyIndia shares have gained 17% year-to-date (YTD).
Advertisement|Remove ads.
For updates and corrections, email newsroom[at]stocktwits[dot]com.
Comments posted here will also appear on symbol pages.
Latest News
/filters:format(webp)https://news.stocktwits-cdn.com/large_Getty_Images_2222922178_jpg_42dd8f319f.webp)
/filters:format(webp)https://news.stocktwits-cdn.com/unnamed_jpg_9dff551b50.webp) Anan Ashraf·44m ago
Anan Ashraf·44m ago/filters:format(webp)https://news.stocktwits-cdn.com/large_Getty_Images_2268819372_jpg_5a03fc4a3d.webp) Anan Ashraf·1h ago
Anan Ashraf·1h ago/filters:format(webp)https://news.stocktwits-cdn.com/large_Michael_Bury_resized_jpg_14e6fc7c2b.webp)
/filters:format(webp)https://news.stocktwits-cdn.com/Whats_App_Image_2026_05_11_at_09_45_43_1_jpeg_a08c0cf251.webp) Aveek Bhowmik·2h ago
Aveek Bhowmik·2h ago/filters:format(webp)https://news.stocktwits-cdn.com/large_nyse_OG_2_jpg_0e4e1c68f2.webp)
/filters:format(webp)https://news.stocktwits-cdn.com/1707726834303_jpg_11f20a9aa9.webp) Shashank Nayar·2h ago
Shashank Nayar·2h ago/filters:format(webp)https://news.stocktwits-cdn.com/large_rivian_r2_jpg_135a2923eb.webp) Anan Ashraf·3h ago
Anan Ashraf·3h ago/filters:format(webp)https://news.stocktwits-cdn.com/Getty_Images_2250240969_jpg_dd9be8c5ea.webp) Shashank Nayar·4h ago
Shashank Nayar·4h ago