


Advertisement|Remove ads.
A Key Semiconductor Index Has Reportedly Triggered A Bearish Technical Sign – BTIG Sees A Potential 17% Decline


- BTIG noted patterns concerning SOX’s moving averages could indicate that momentum is fading and a near-term pullback is becoming more likely.
- Recently, “The Big Short” investor Michael Burry warned that semiconductor and AI stocks have become extremely overvalued.
- Burry also spoke about SOX’s historically high extension above the 200-day moving average.
Advertisement|Remove ads.
BTIG stated on Friday that the Philadelphia SE Semiconductor Index (SOX) could be headed for a correction after flashing a bearish technical signal that may trigger a 17% pullback, according to a CNBC report.
SOX was down 0.9% at the time of writing.

BTIG Says High Volatility Could Precede Sharp Drawdowns
The investment bank noted that the SOX has posted moves of at least 3% on 15 occasions over the past 30 trading sessions, highlighting increased volatility.
Advertisement|Remove ads.
“The only other periods we have seen 15 days of 3% or greater moves within a 30-day period while being above the 200-day moving average was Feb./March ’99 and Feb. to July ’00,” said BTIG’s chief market technician, Jonathan Krinsky, as quoted by CNBC.
“While this was too early of a signal in ’99, it had ominous outcomes in ’95, ’97, ’00, ‘20, and ’24 preceding -17% or worse drawdowns,” he added.
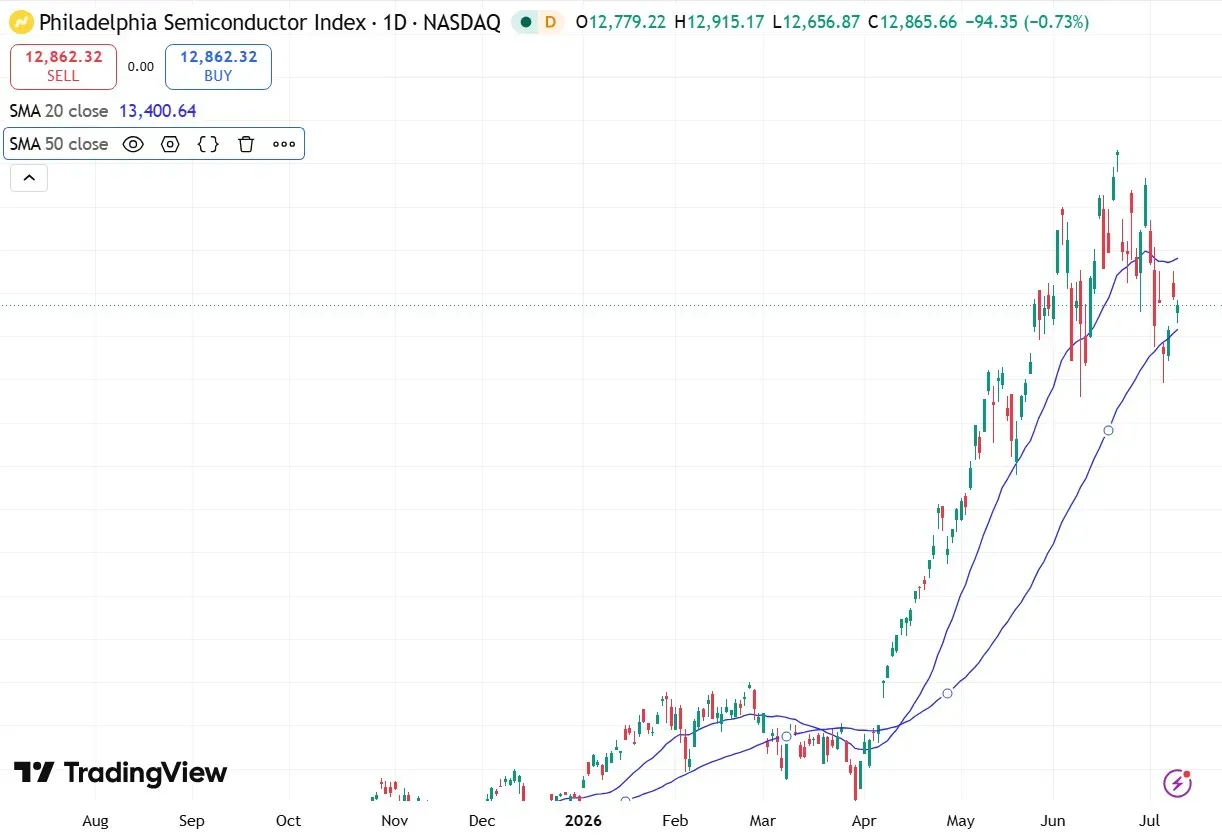
After gaining around 22% in May and 11% in June, the SOX is down more than 9% so far in July.
Advertisement|Remove ads.
Near-Term Pullback On The Cards
On Thursday, the index climbed above its 50-day and 200-day moving averages but remained below its 20-day moving average. BTIG said this pattern, following a strong rally, could indicate that momentum is fading and a near-term pullback is becoming more likely.
Source: TradingView
Advertisement|Remove ads.
Valuation Concerns Cast Shadow Over Chip Stocks
Chip stocks have also come under pressure from growing valuation concerns. Recently, “The Big Short” investor Michael Burry warned that semiconductor and AI stocks have become extremely overvalued, comparing them to the dot-com bubble of 2000. He also disclosed short positions in Nvidia (NVDA), Applied Materials (AMAT), and the iShares Semiconductor ETF (SOXX).
“The Philadelphia Semiconductor Index is at a historically high extension above its 200-day moving average. A level not seen since 2000,” Burry wrote in a Substack post earlier this month. Historically, similar setups have often been followed by 30% or larger declines in semiconductor stocks, he added.
At the time of writing, the SPDR S&P 500 ETF (SPY), which tracks the S&P 500 index, edged 0.02% lower; the Invesco QQQ Trust ETF (QQQ) was down 0.2%; and the SPDR Dow Jones Industrial Average ETF Trust (DIA) gained 0.1%.
Advertisement|Remove ads.
For updates and corrections, email newsroom[at]stocktwits[dot]com.
Comments posted here will also appear on symbol pages.

Latest News
/filters:format(webp)https://news.stocktwits-cdn.com/large_kroger_resized_jpg_df58ccdaf5.webp)
/filters:format(webp)https://news.stocktwits-cdn.com/1707726834303_jpg_11f20a9aa9.webp) Shashank Nayar·53m ago
Shashank Nayar·53m ago/filters:format(webp)https://news.stocktwits-cdn.com/large_Getty_Images_2271872828_24a8400504.jpg)
/filters:format(webp)https://news.stocktwits-cdn.com/unnamed_jpg_9dff551b50.webp) Anan Ashraf·55m ago
Anan Ashraf·55m ago/filters:format(webp)https://news.stocktwits-cdn.com/large_Seagate_jpg_50a56724b4.webp) Shashank Nayar·3h ago
Shashank Nayar·3h ago/filters:format(webp)https://news.stocktwits-cdn.com/large_Getty_Images_2128530471_1b79e1b428.jpg) Anan Ashraf·3h ago
Anan Ashraf·3h ago/filters:format(webp)https://news.stocktwits-cdn.com/large_qualcomm_jpg_bf257cee94.webp) Shashank Nayar·3h ago
Shashank Nayar·3h ago/filters:format(webp)https://news.stocktwits-cdn.com/large_Getty_Images_1321754803_jpg_a6258004b8.webp)
/filters:format(webp)https://news.stocktwits-cdn.com/Anushka_Basu_make_me_smile_in_the_picture_b92832aa_af59_4141_aacc_4180d2241ba8_1_2_png_1086e0ed8c.webp) Anushka Basu·3h ago
Anushka Basu·3h ago