The recent carnage in the energy sector has been lost in the shuffle, so let’s take a quick look.
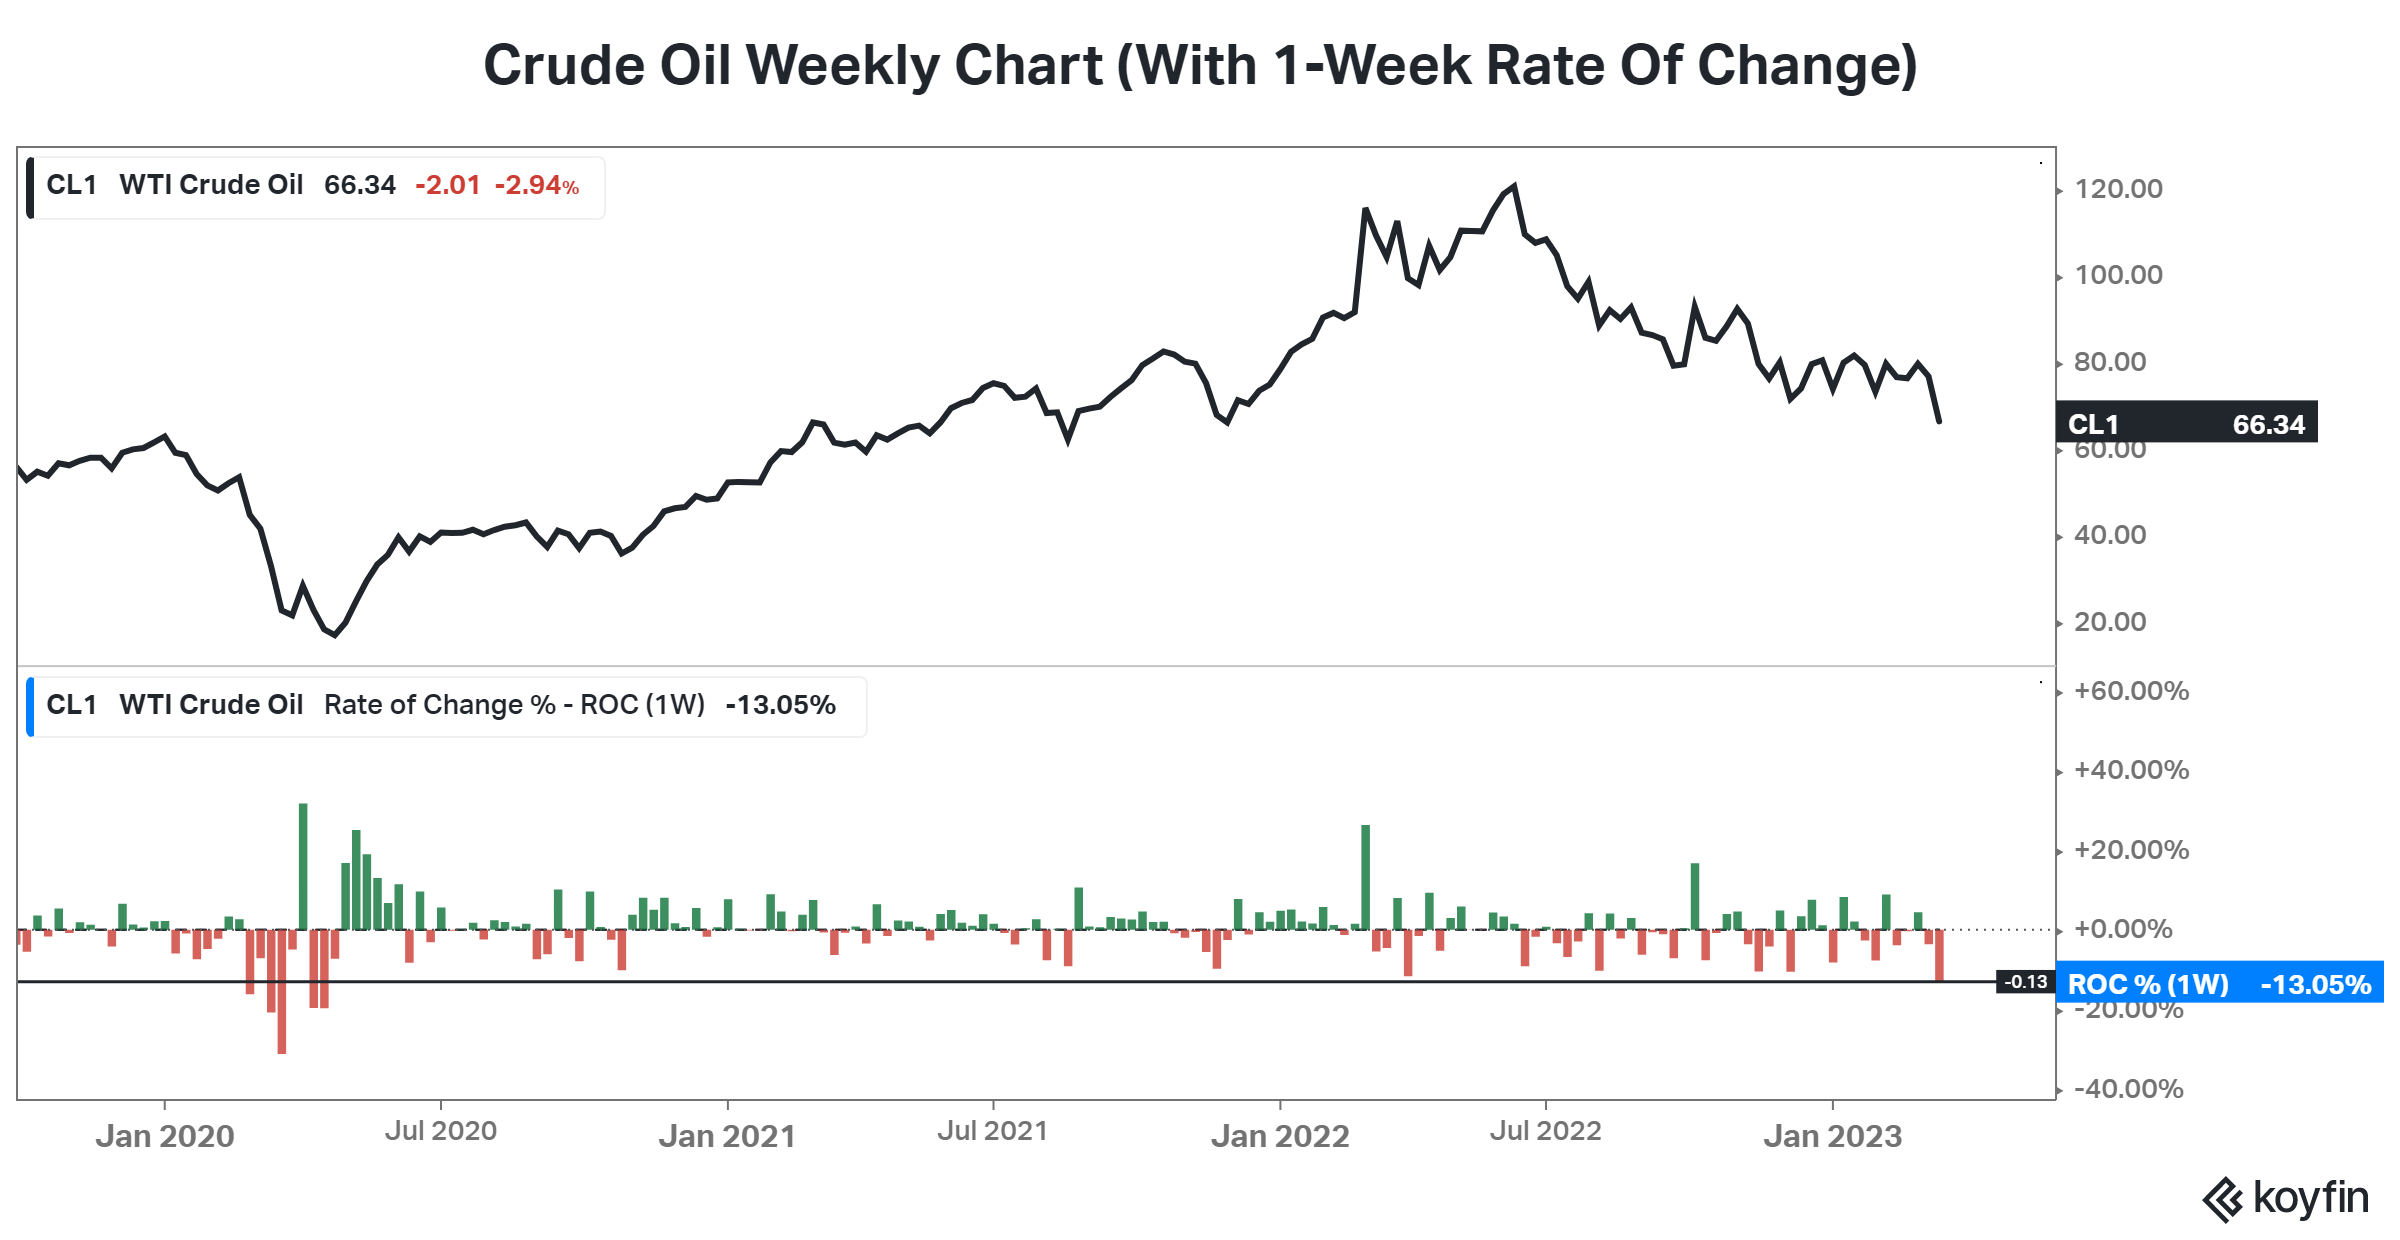
Below is a chart of crude oil’s weekly chart dating back three years. With this week’s decline, prices fell to their lowest level since December 2021. And the one-week rate of change shows this is the largest one-week decline since early 2020. 😬
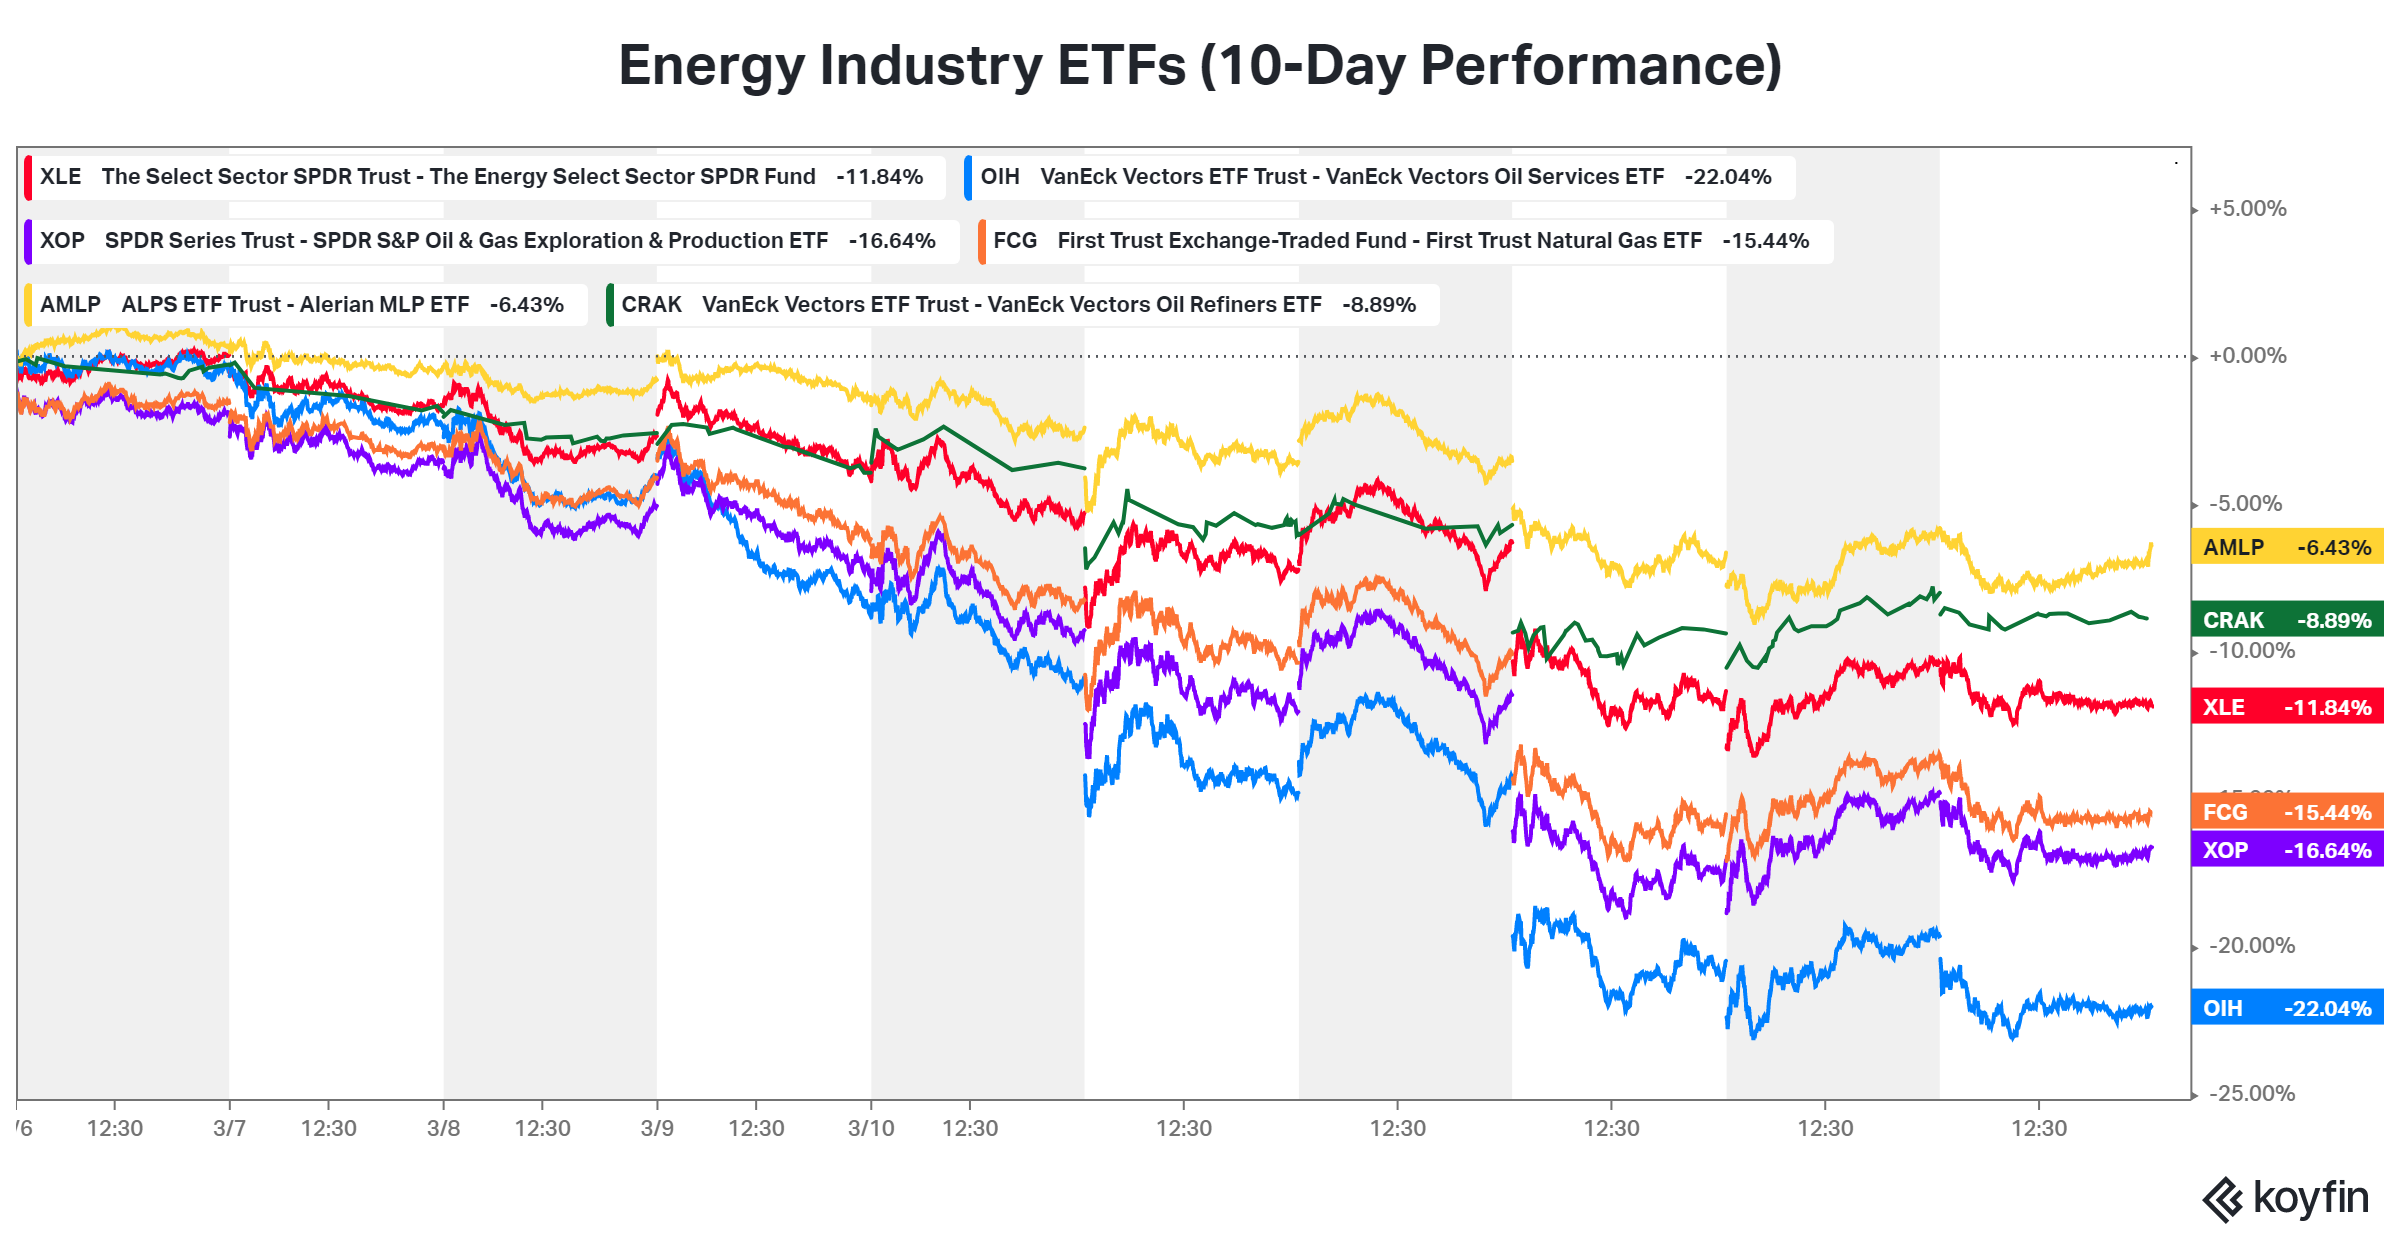
We mention it because the oil price decline is also showing up in energy-related ETFs. Their 10-day performance shows declines ranging from 6% to 22%. 🔻
With the energy sector shifting from last year’s best performer to this year’s worst, many investors are trying to determine whether the downward trend will continue or if this is a potential buying opportunity. For now, we’ll have to wait and see. 👀