Oil Returns To The Status Quo

The U.S. oil market is returning to its pre-pandemic norms, at least according to the manager of the popular oil ETF $USO. ๐Ÿ›ข๏ธ

The United States Oil Fund ($USO) has been around since April 2006 and is a futures-based ETF that looks to track the price of U.S. crude oil. It does so by purchasing the front-month sweet light crude oil (WTI) contract, holding it, and then rolling its holdings to the following contract before expiration.ย 

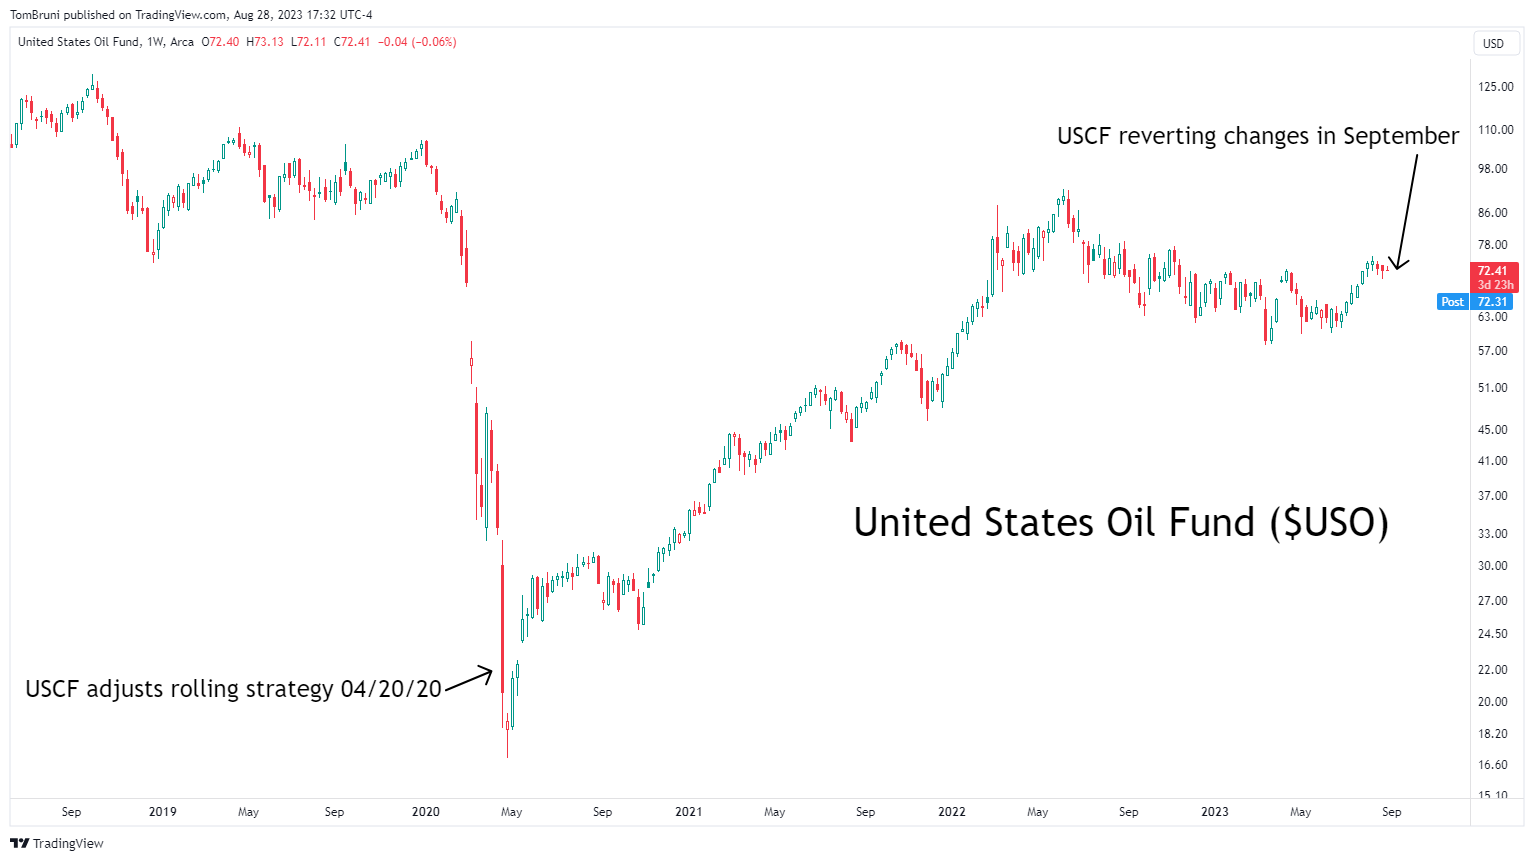
That was how it operated until the COVID-19 pandemic sent the oil market into a tailspin. As a result of the drastic selling in April 2020, futures prices went negative and left the United States Oil Fund with more than 25% of that month’s futures contract. ๐Ÿ˜ฎ

Because of that, it inadvertently violated Commodity Futures Trading Commission (CFTC) regulations that no single investor can purchase over 25% of a given futures contract. As a result, asset manager United States Commodity Funds (USCF) committed to spreading the ETF’s exposure out across several futures contracts. ๐Ÿ—“๏ธ

The move helped it comply with regulations and diversify its risk in a turbulent market, but it also reduced the fund’s ability to track front-month (AKA spot) oil prices accurately.

And the fund has been operating that way for the last three years.

However, it apparently feels as if the market is stable enough to return to its old ways of operating. Today, it announced that beginning in September, it will start reallocating most of its holdings to the front-month oil contract rather than spreading out its exposure. โ—€๏ธ

After this process is completed, this popular trading vehicle will more accurately track the spot price of oil. But it will also be exposed to outsized tail risks, as we saw during the pandemic.

We’ll have to wait and see if traders pile back into it as energy remains atop everyone’s radars after a strong 2021 and 2022. ๐Ÿ—“๏ธ

Learn More About...

Are Investors Sleeping On Commodities?

We know pulling people’s attention away from stocks is tough, especially when they’re rallying. But as we close out the week, we wanted to point out that many of this week’s top-performing assets were commodities.

The chart below from Finviz shows that nine of the top ten performers this week were commodity futures, with Natural Gas topping the list at +16.19%. ๐Ÿคฉ

Read It

Gold Shimmers Around $2,000/Oz

Precious metals have not gotten much fanfare lately, especially with palladium in a downtrend and platinum and silver stuck in messy ranges. ๐Ÿ’ค

However, one that continues to pop up on investor and trader radars is gold, which is once again trying to break above $2,000/oz. Below is a chart showing prices stuck in a range for the last 2.5 years, each time failing to sustain a break above resistance. ๐Ÿ”

Read It

Oil & Gas Sector Loses Its Energy

After a strong run throughout the summer, it’s been a rough two weeks for energy-related commodities and stocks. Today, an accelerating decline helped bring the sector back to the forefront of investors’ conversation. Let’s take a look at why. ๐Ÿ‘‡

In very short-term fundamental news, gasoline inventories surprised to the upside today on weak demand. That caused the commodity to extend its recent selloff. But more importantly, we also saw heating oil and crude oil selloff in tandem after holding relatively strong during gasoline’s pullback.

Read It

Sugar Hits Sweet Spot As Gold Shines

It was a slow day out there, but several commodities caught traders’ eyes. Let’s see which ones. ๐Ÿ‘€

First up is sugar futures, which have experienced a nearly 30% decline since the beginning of November. While its major decline is one reason to be on people’s radars, technical traders say prices have reached the 20-20.50 area that served as an inflection point over the last two years.

Read It