As mentioned at the beginning of this Litepaper, this new and truly exciting nerd fest section is for all of you technical analysis chart junkies – my kind of people. We’re breaking this down into three categories.
Category one for beginners: Think of this category as ‘Your Baby’s First Book on Technical Analysis’ – it will include basic trendlines and moving averages.
Category two for people who know some stuff: If you think, “Oscillators and indicators are kind of cool,” then this is for you – this will include RSI (Relative Strength Index), Fibonacci retracements, and extensions.
Category three is for full-blown nerd mode geek stuff: “OMG, WTF is this? I don’t even… why does it look like a toddler’s coloring placemat from IHOP?!” This section will include concepts like the Ichimoku Kinko Hyo system, Point and Figure charting, Gann Analysis, and other bizarre stuff that you may or may not know, but we will break down into a TL;DR version.
Beginners Technical Analysis
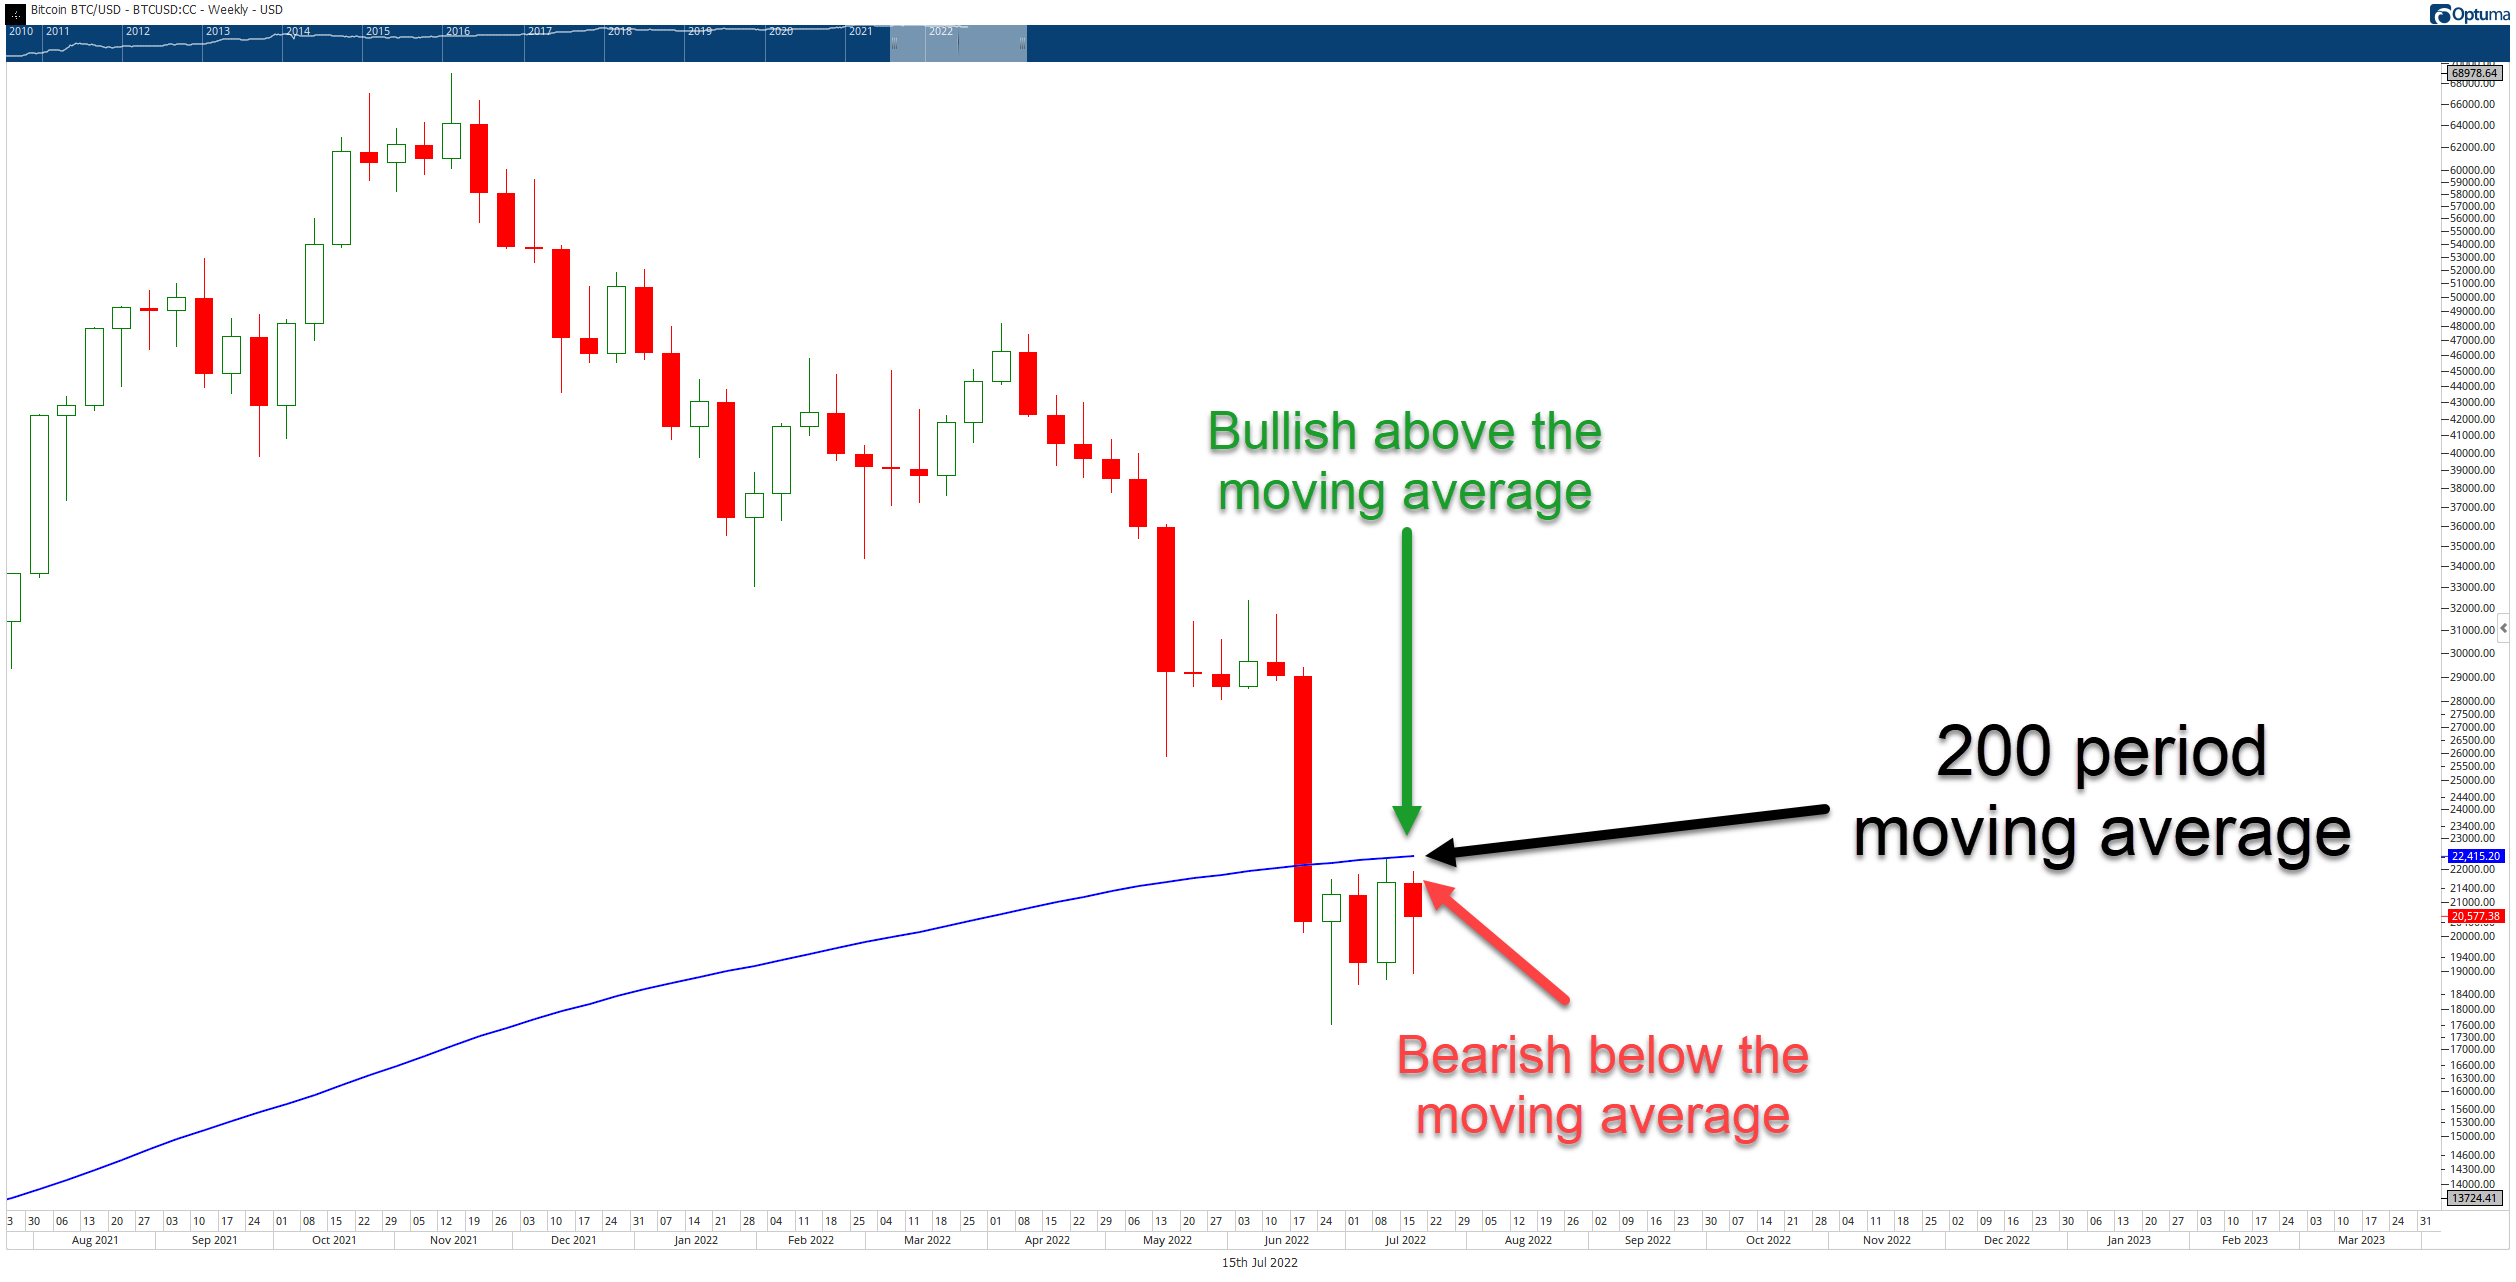
The chart above is Bitcoin’s ($BTC.X) weekly chart. The blue line on the chart is the 200-period moving average. That moving average is the average price of the past 200 weekly candles.
Analysts view the 200-period moving average as a sort of barometer to determine if a trend is bullish or bearish. Bitcoin has closed below the 200-period moving average for five consecutive weeks – that’s a record. To some analysts, failure to move and close above that moving average is extremely bearish.
People Who Know Some Stuffs Analysis
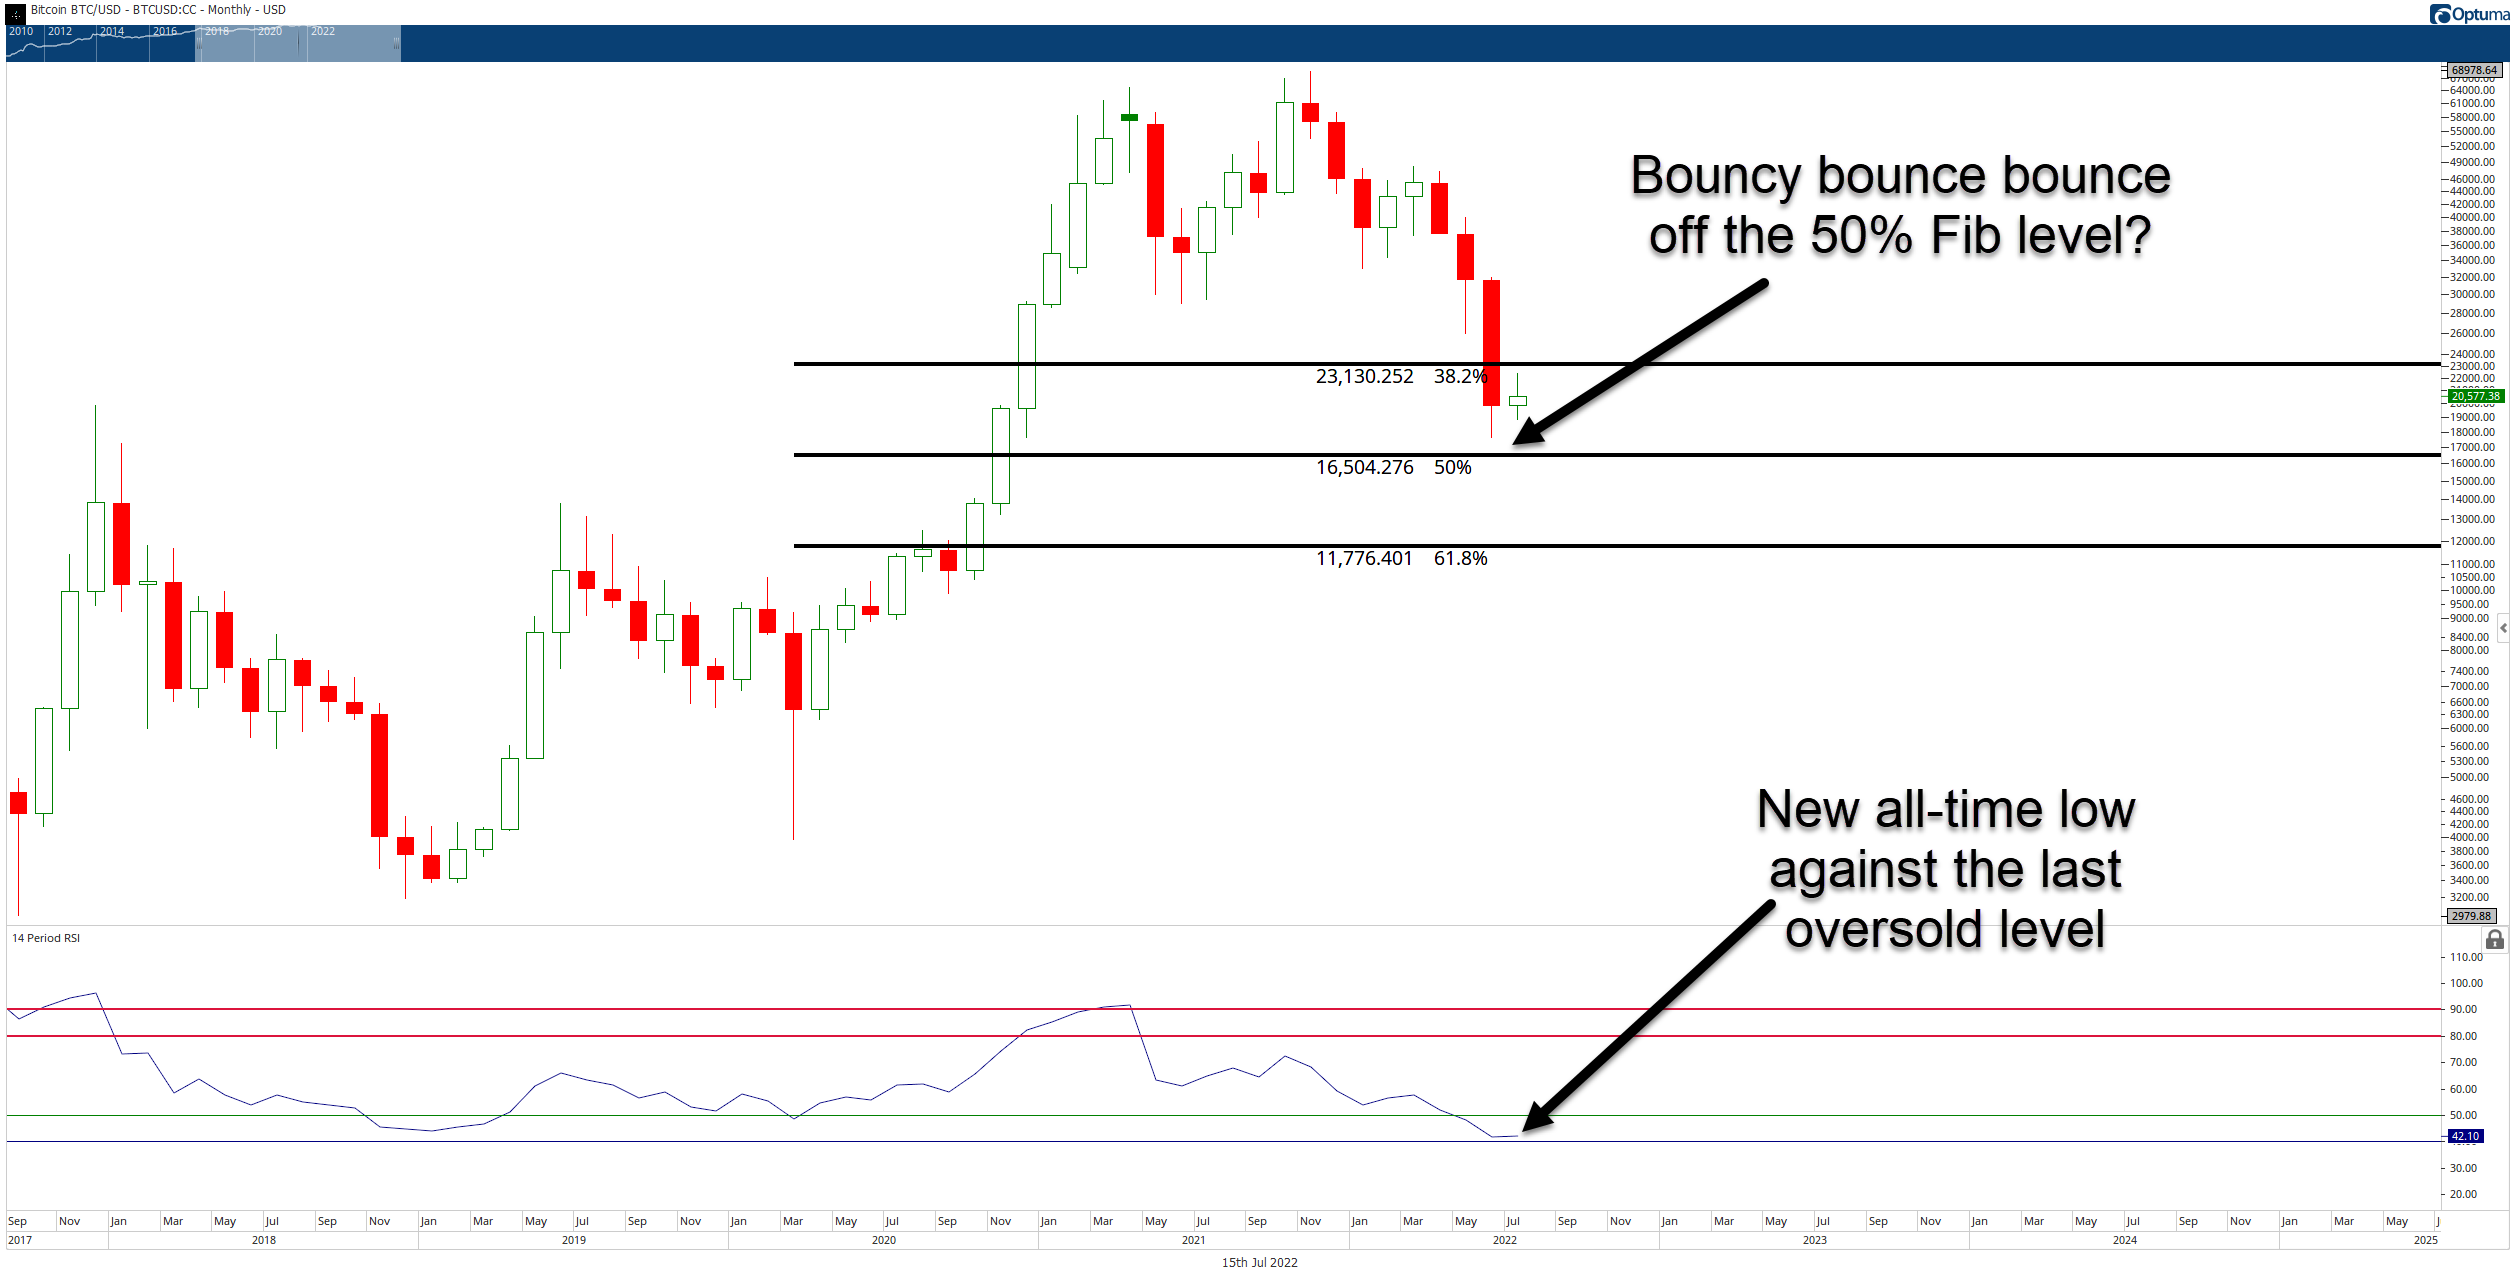
The chart above is still Bitcoin, but it’s the monthly candlestick chart. In technical analysis, many analysts view the 50% Fibonacci retracement as a strong support and resistance level.
In other words, if the price moves down to the 50% Fib level, analysts anticipate a high likelihood of it finding support and bouncing off of it to move higher.
The Relative Strength Index (RSI) is a momentum oscillator. Analysts and traders use the RSI to help determine whether something has moved too far up (overbought) or too far down (oversold). Overbought indicates prices may be reversing lower; oversold indicates prices may turn around and move higher.
On Bitcoin’s monthly chart, many analysts believe that because price is close to the 50% Fibonacci retracement and because the RSI is at new all-time lows and just above the final oversold level, the market is severely oversold, and a move higher could occur.
However, oversold does not necessarily mean prices will reverse. Instead, some analysts believe that a lack of conviction from buyers near historical lows is evidence of continued lower prices.
Super Duper Exciting Nerd Analysis 9000
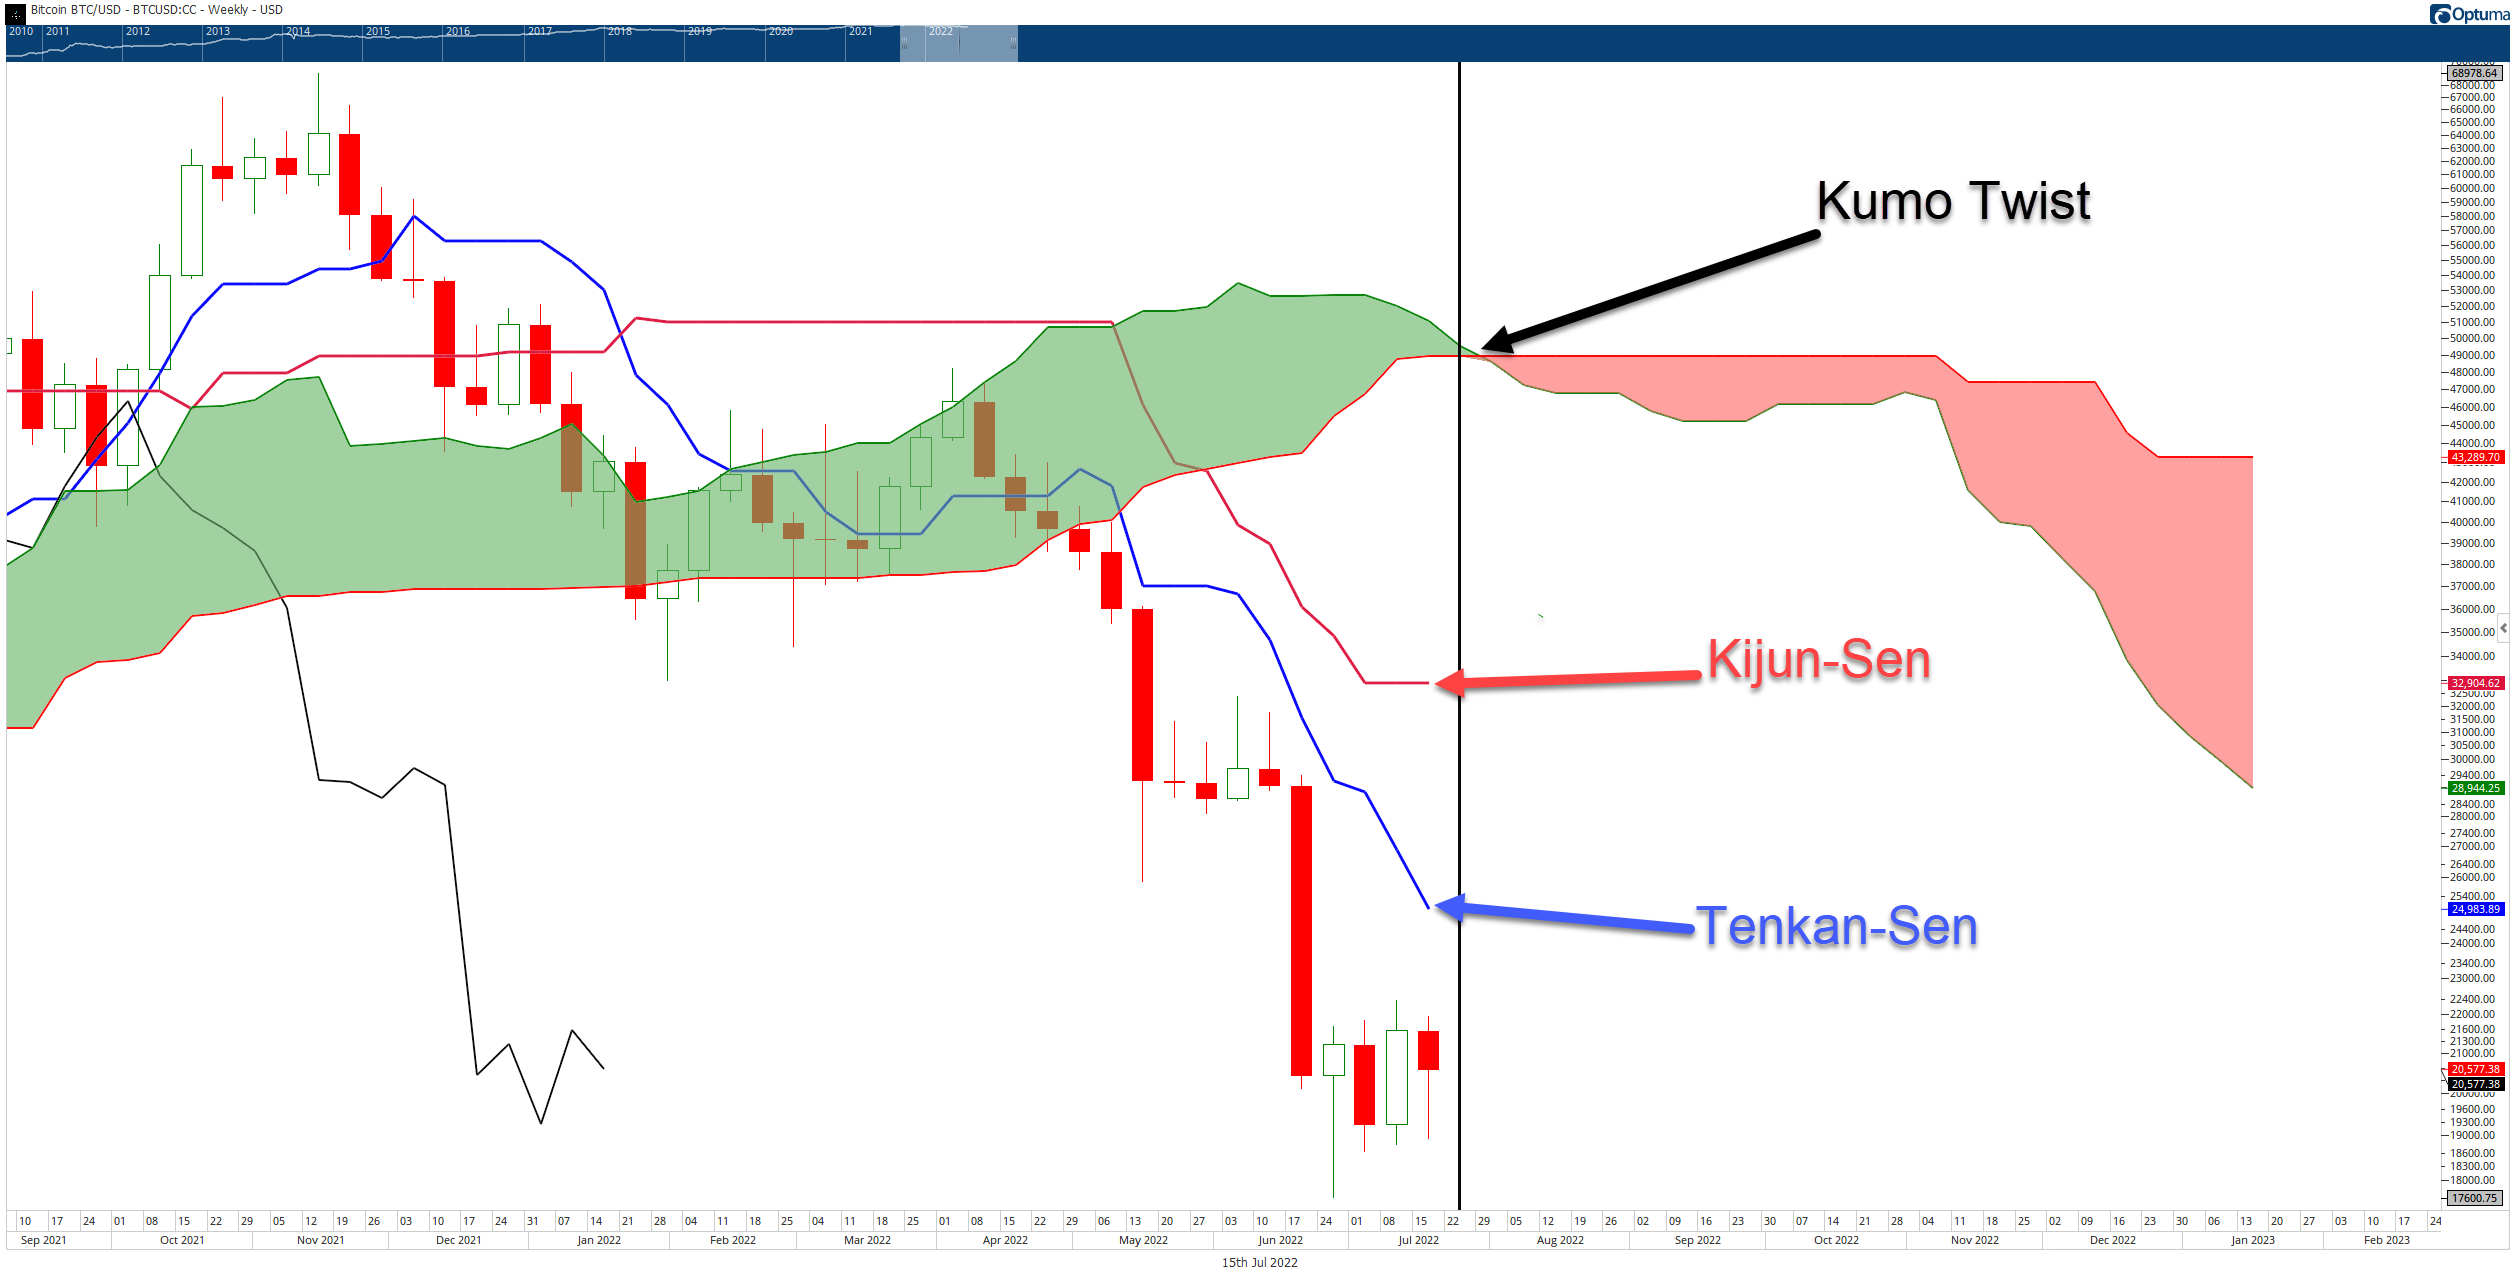
Taking another look at the weekly Bitcoin chart, this time using the Japanese technical trading system and analysis style known as the Ichimoku Kinko Hyo system. If you don’t know what the blobs of color and all the other components are, you can skip to the last part of the Super Duper Exciting Nerd Analysis 9000 for the TL;DR summary.
The gaps between the bodies of the candlesticks and the Tenkan-Sen remain large and unresolved – out of equilibrium. You can think of price and the Tenkan-Sen attached by a rubber band. The further price moves from the Tenkan-Sen, the harder it is to move further away and the increased likelihood that price will ‘snap’ back to the Tenkan-Sen and return the market to equilibrium.
The Ichimoku System does not tolerate large gaps between the bodies of the candlesticks and the Tenkan-Sen, which often resolve within three to five candles. But what if price fails to move back to the Tenkan-Sen? In the absence of price returning to the Tenkan-Sen, the factor of time will return the instrument to equilibrium.
For Bitcoin, that would mean instead of price moving up to the Tenkan-Sen, Bitcoin’s price action would likely consolidate and rest until the Tenkan-Sen moves down to price.
The Kumo Twist is the most important factor on Bitcoin’s weekly Ichimoku chart. A Kumo Twist is an event where the Cloud changes color from red to green or green to red. The black vertical line shows where the current twist is at.
Ichimoku traders and analysts look for Kumo Twists to identify possible turns in a market. For example, if an instrument is trading near a major/minor swing high/low near the time of a Kumo Twist, then there is a high probability of a major move occurring soon.
TL;DR Summary For Bulls
Analysts continue to point at new all-time lows found on the monthly RSI and continue to point at extreme oversold levels. Price action, likewise, continues to display evidence that a bottom of the current bear market may be complete or is nearing completion.
TL;DR Summary For Bears
While oscillators and price action may point to a strong case for a near-term bullish bias, oversold conditions do not guarantee an end to selling pressure. The consolidation and formation of a floor may just be consolidation that occurs before another leg down.
From an Ichimoku perspective, because the Tenkan-Sen is acting as a resistance level, the closer it gets to the price, the more likely price is to remain away from the Tenkan-Sen – thereby moving lower. ⏰