This Wednesday edition of the Litepaper dives hard and deep into the technicals. There are some extremely interesting bullish and bearish conditions across the crypto space, so let’s jump right in and look at some of them.
Bitcoin
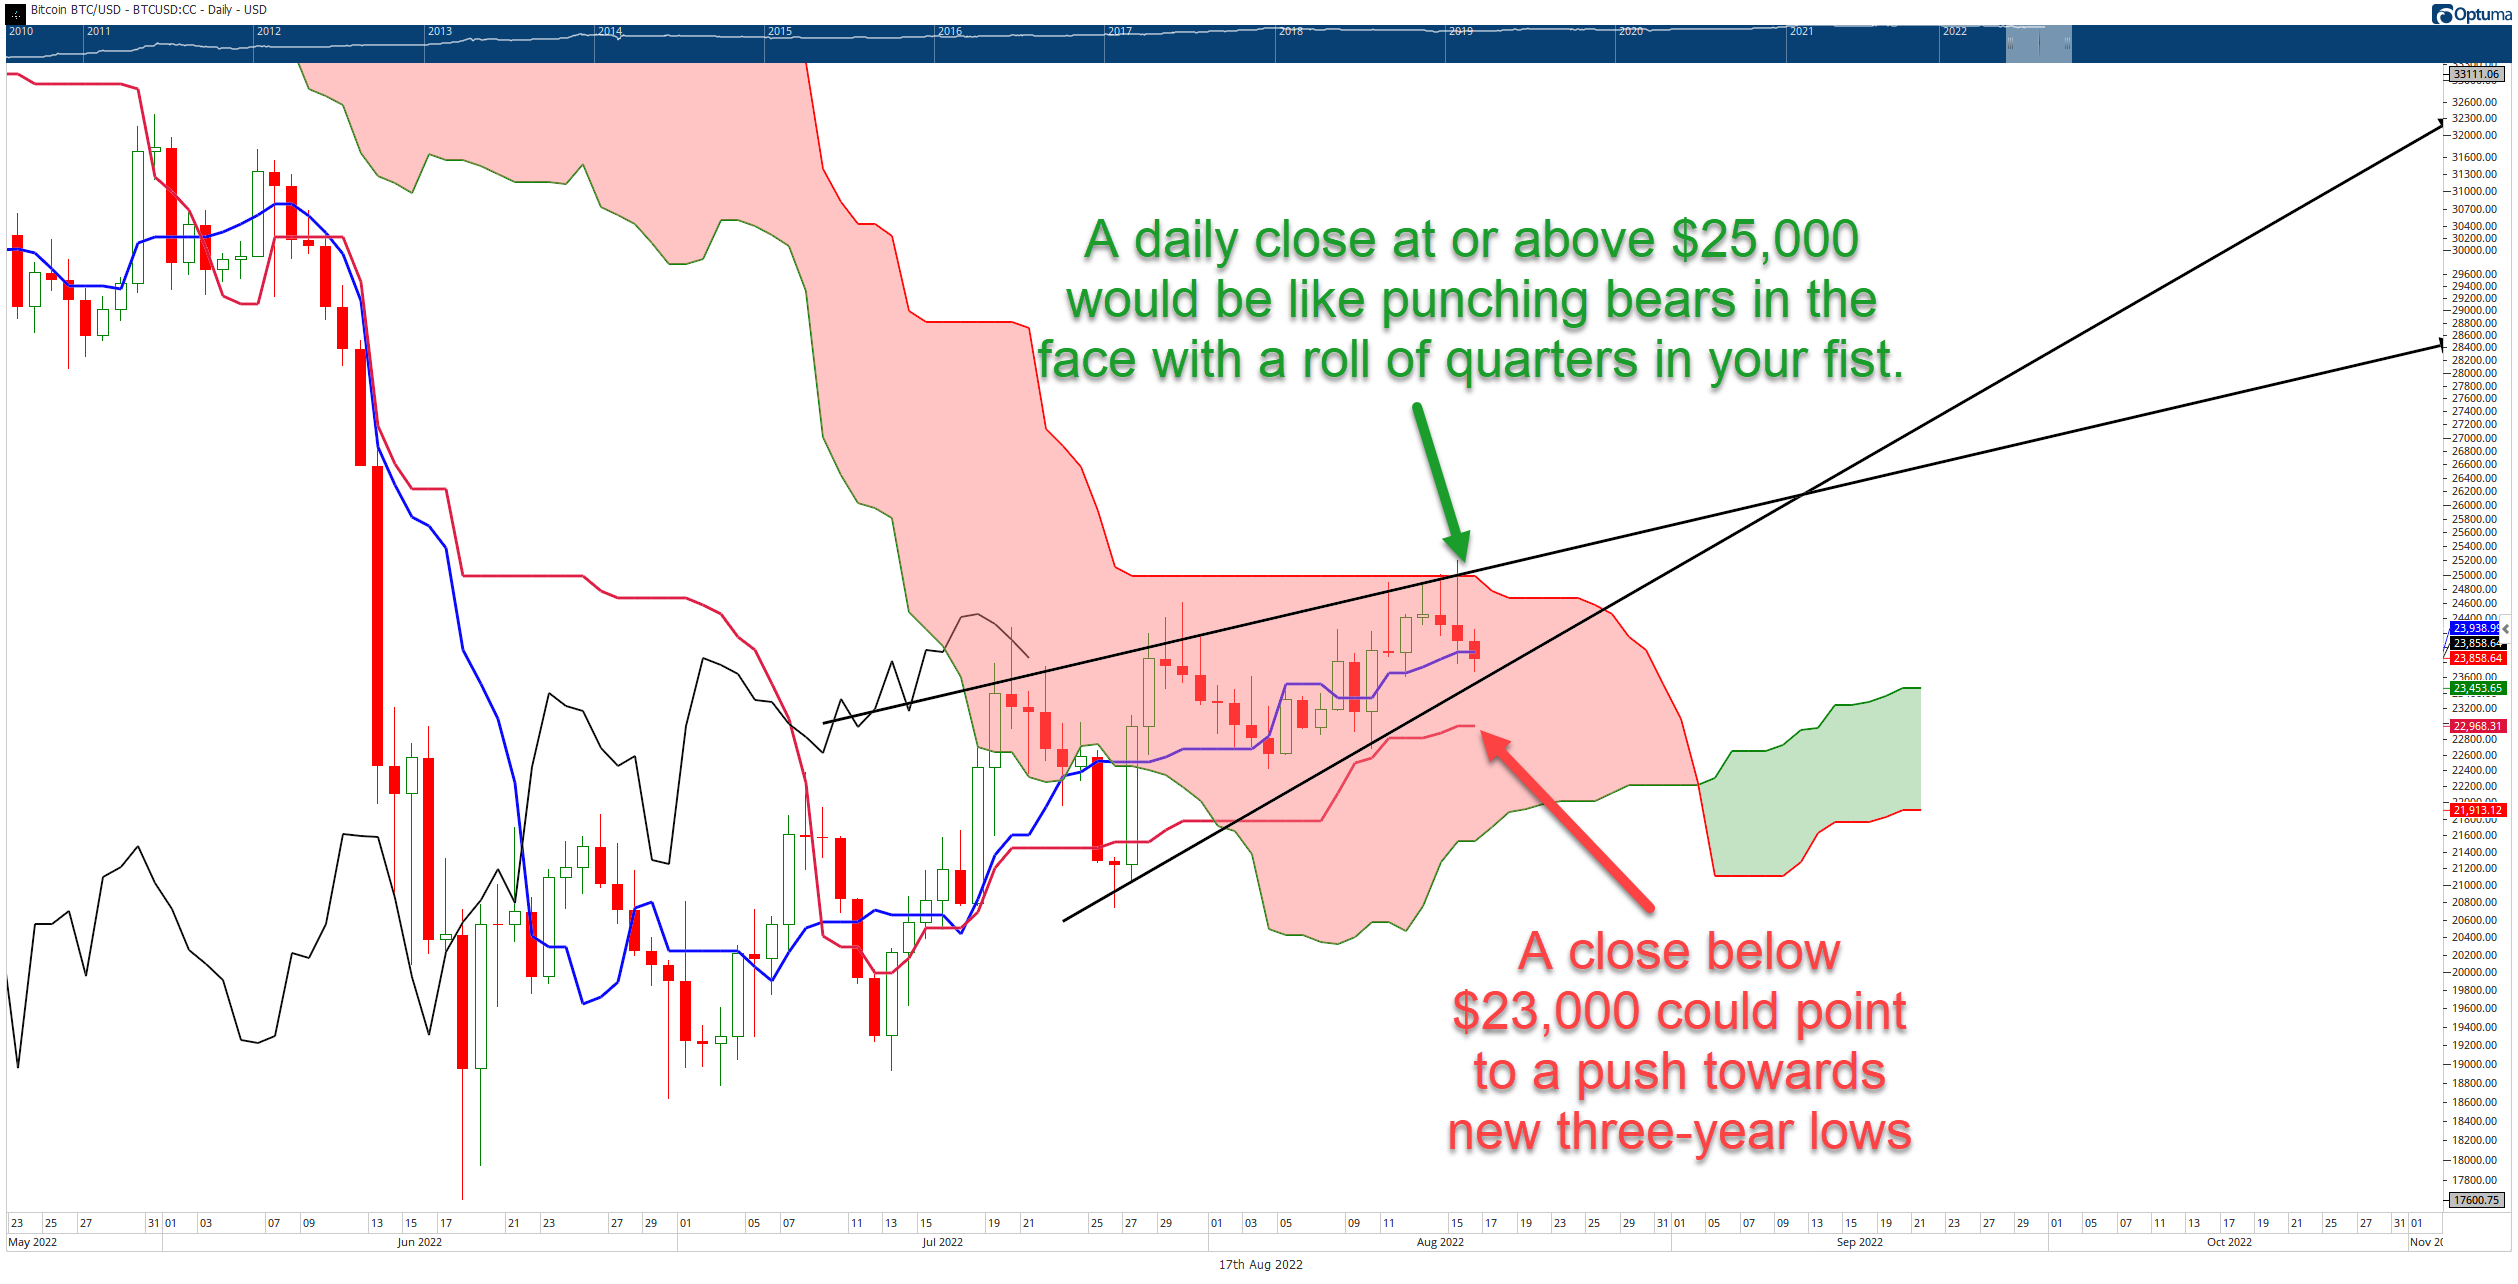
Of all the ‘standard’ chart patterns that exist, none is more bearish than the rising wedge pattern. And for Bitcoin ($BTC.X) bulls, it’s a troubling pattern. Additionally, the consistent rejection against the top of the Ichimoku Cloud (Senkou Span B) exacerbates the feelings of an imminent collapse.
The psychologically important $25,000 value area includes the top of the rising wedge and the top of the Ichimoku Cloud, creating a trifecta of strong resistance.
Bears are likely feeling fairly comfortable here but shouldn’t get too comfortable. Even if Bitcoin closes below the bottom of the resign wedge, bears will have to contend with the Kijun-Sen at $23,000 as a support level – which will likely be the make-or-break point for Bitcoin to bounce or face a probable move towards new three-year lows.
For the bulls, if (and that’s a big if) they pull off a close at or above $25,000, that would likely generate some substantial upside momentum.
TL;DR – Bulls want a close at or above $25,000 to send a clear signal that further downside pressure is unlikely. Bears need a close below $23,000, but even then, price needs to move a good amount lower to get outside the Cloud.
Ethereum
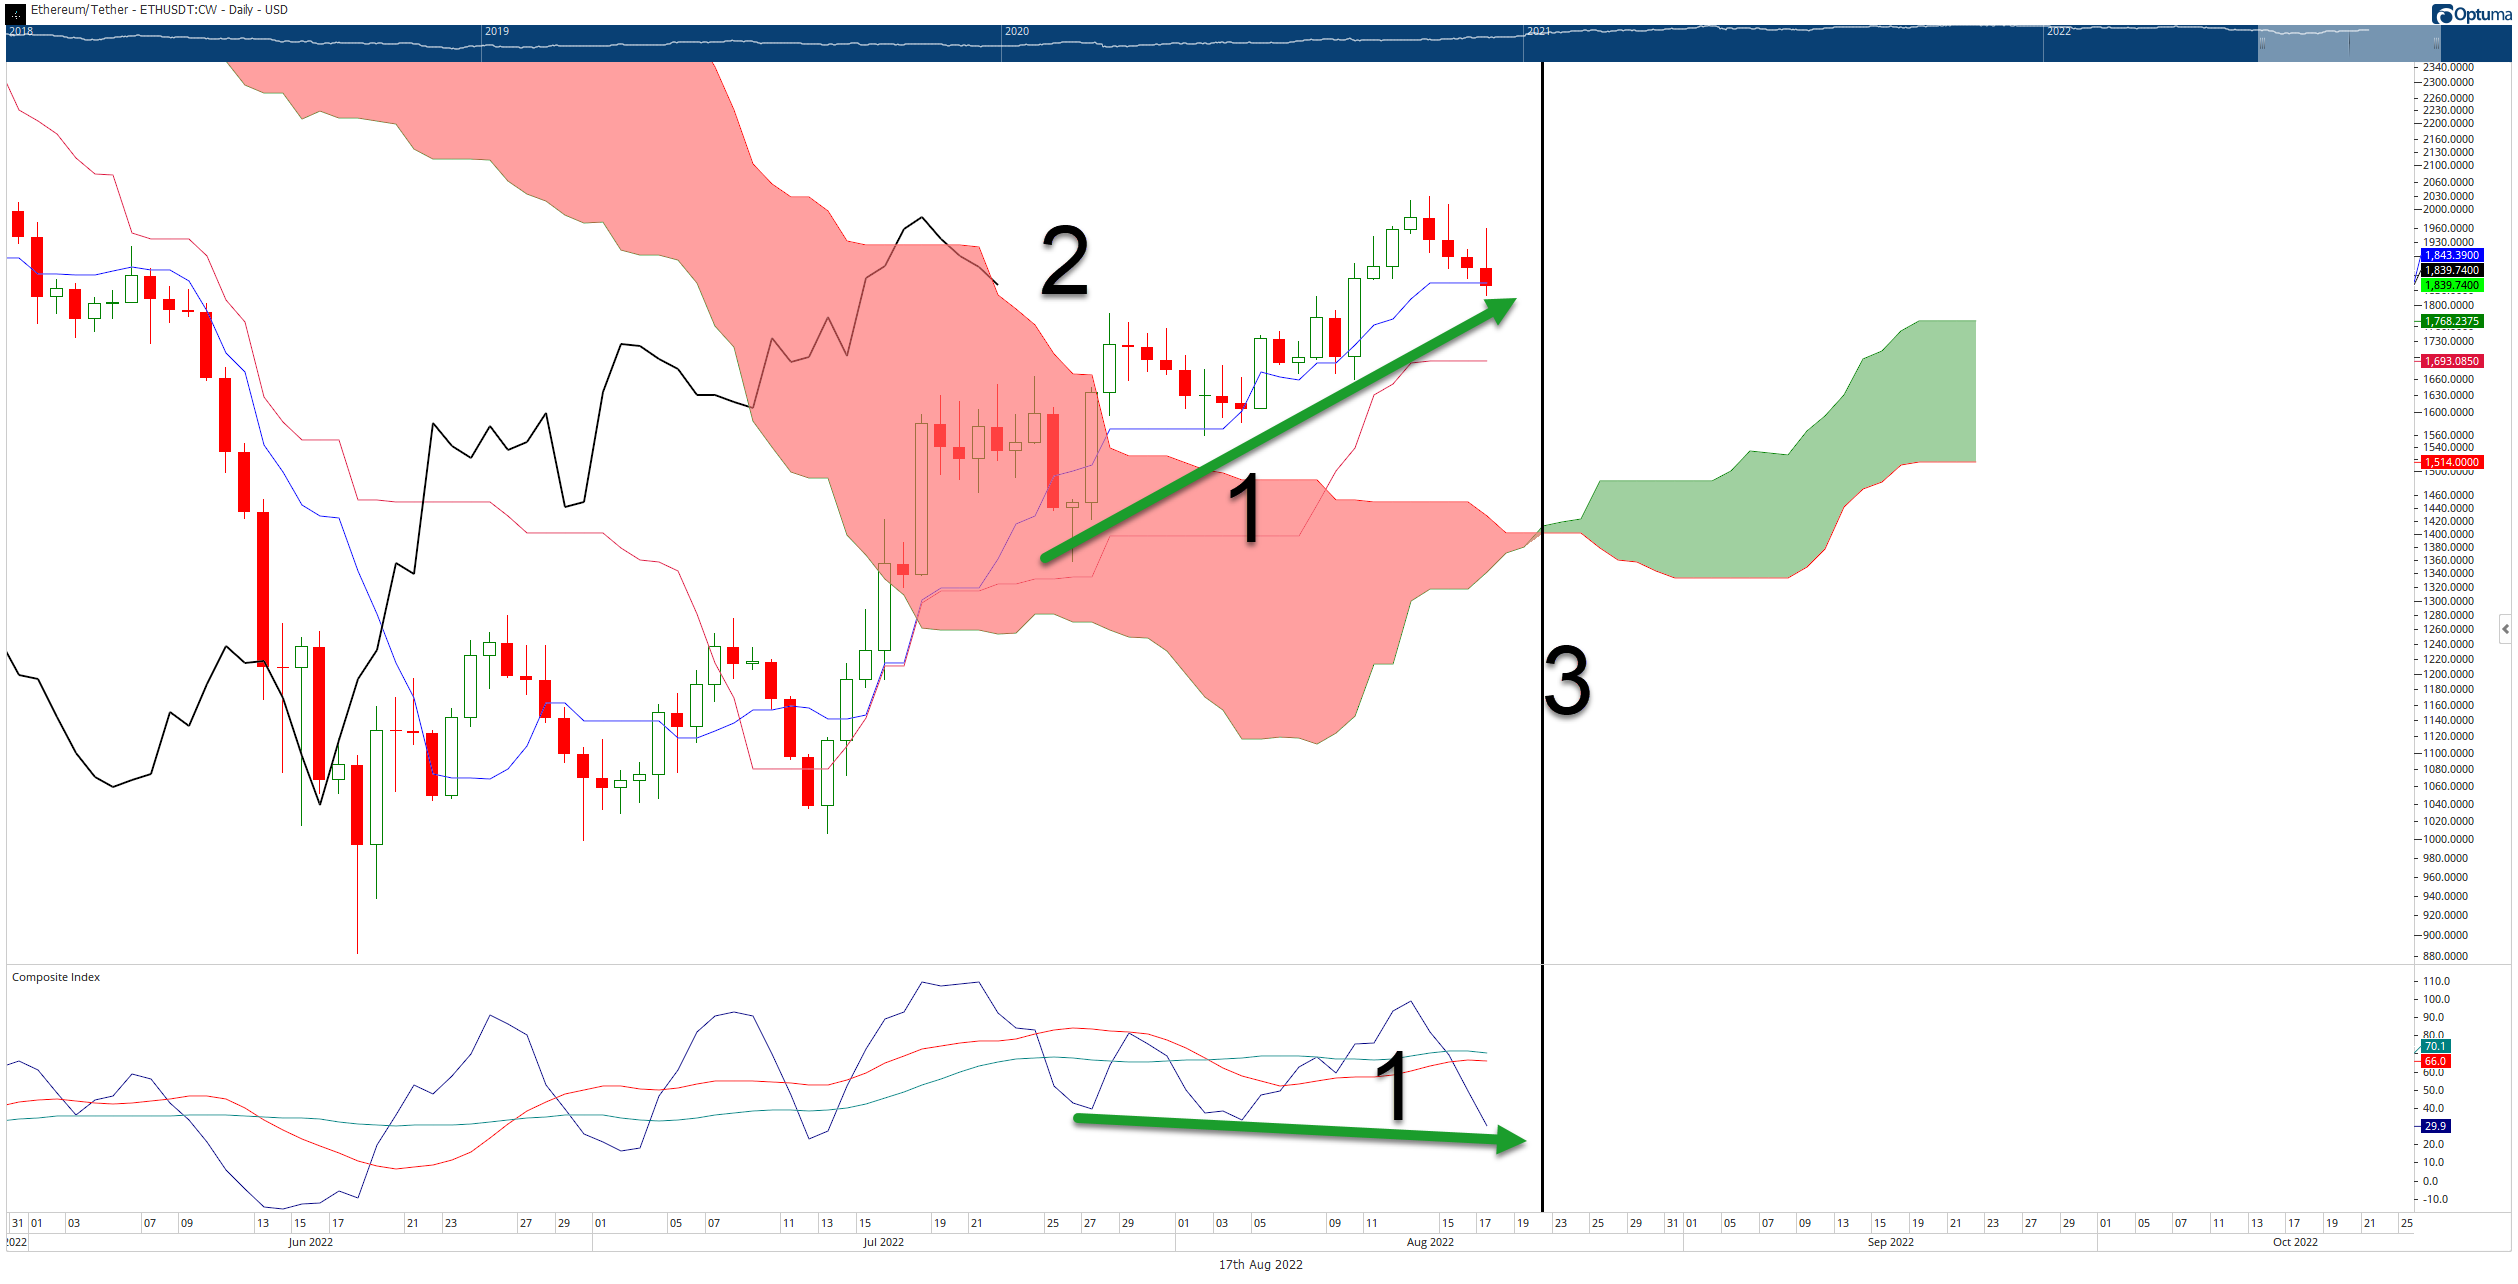
Alright, we’ve got a bunch of hoopla going on with this Ethereum ($ETH.X) chart. So I’ve numbered them on the chart to correspond to the numbers below:
- Hidden Bullish Divergence occurs when the price chart shows higher lows, but the oscillator shows flat or lower lows. Hidden Bullish Divergence is a warning sign that the current pullback will likely convert and resume an uptrend. Not a guarantee, but a high probability.
- The Chikou Span (which looks like a black moving average in the middle of nowhere) remains above the Cloud and appears like it wants to treat the Cloud as support.
- Kumo Twist – Kumo Twists occur when Senkou Span A crosses Senkou Span B (the color changes, too). Kumo Twists can be the earliest signal that a change in trend may occur soon, especially if an instrument is trading in a clear direction around the date of the Kumo Twist.
If Ethereum continues its slow slide south, then the date of the Kumo Twist (August 20) may become increasingly important. The $1,700 value area is the strongest near-term support zone between now and August 20 because it contains the Kijun-Sen and the top of the Ichimoku Cloud, where the Chikou Span is.
Failure to hold $1,700 could see Ethereum collapse into the Cloud itself near the $1,300 value area.
Bulls have the advantage of a clear breakout above the Ichimoku Cloud, a return to equilibrium within the Ichimoku system, and strong hidden bullish divergence. Failure to capitalize on these strong technicals and break through the $2,000 resistance zone would be a huge sign of weakness.
TL:DR – Bulls need to see a clear buyer response between now and August 20. Failure could see the bears take over and push down to $1,300.
Polkadot
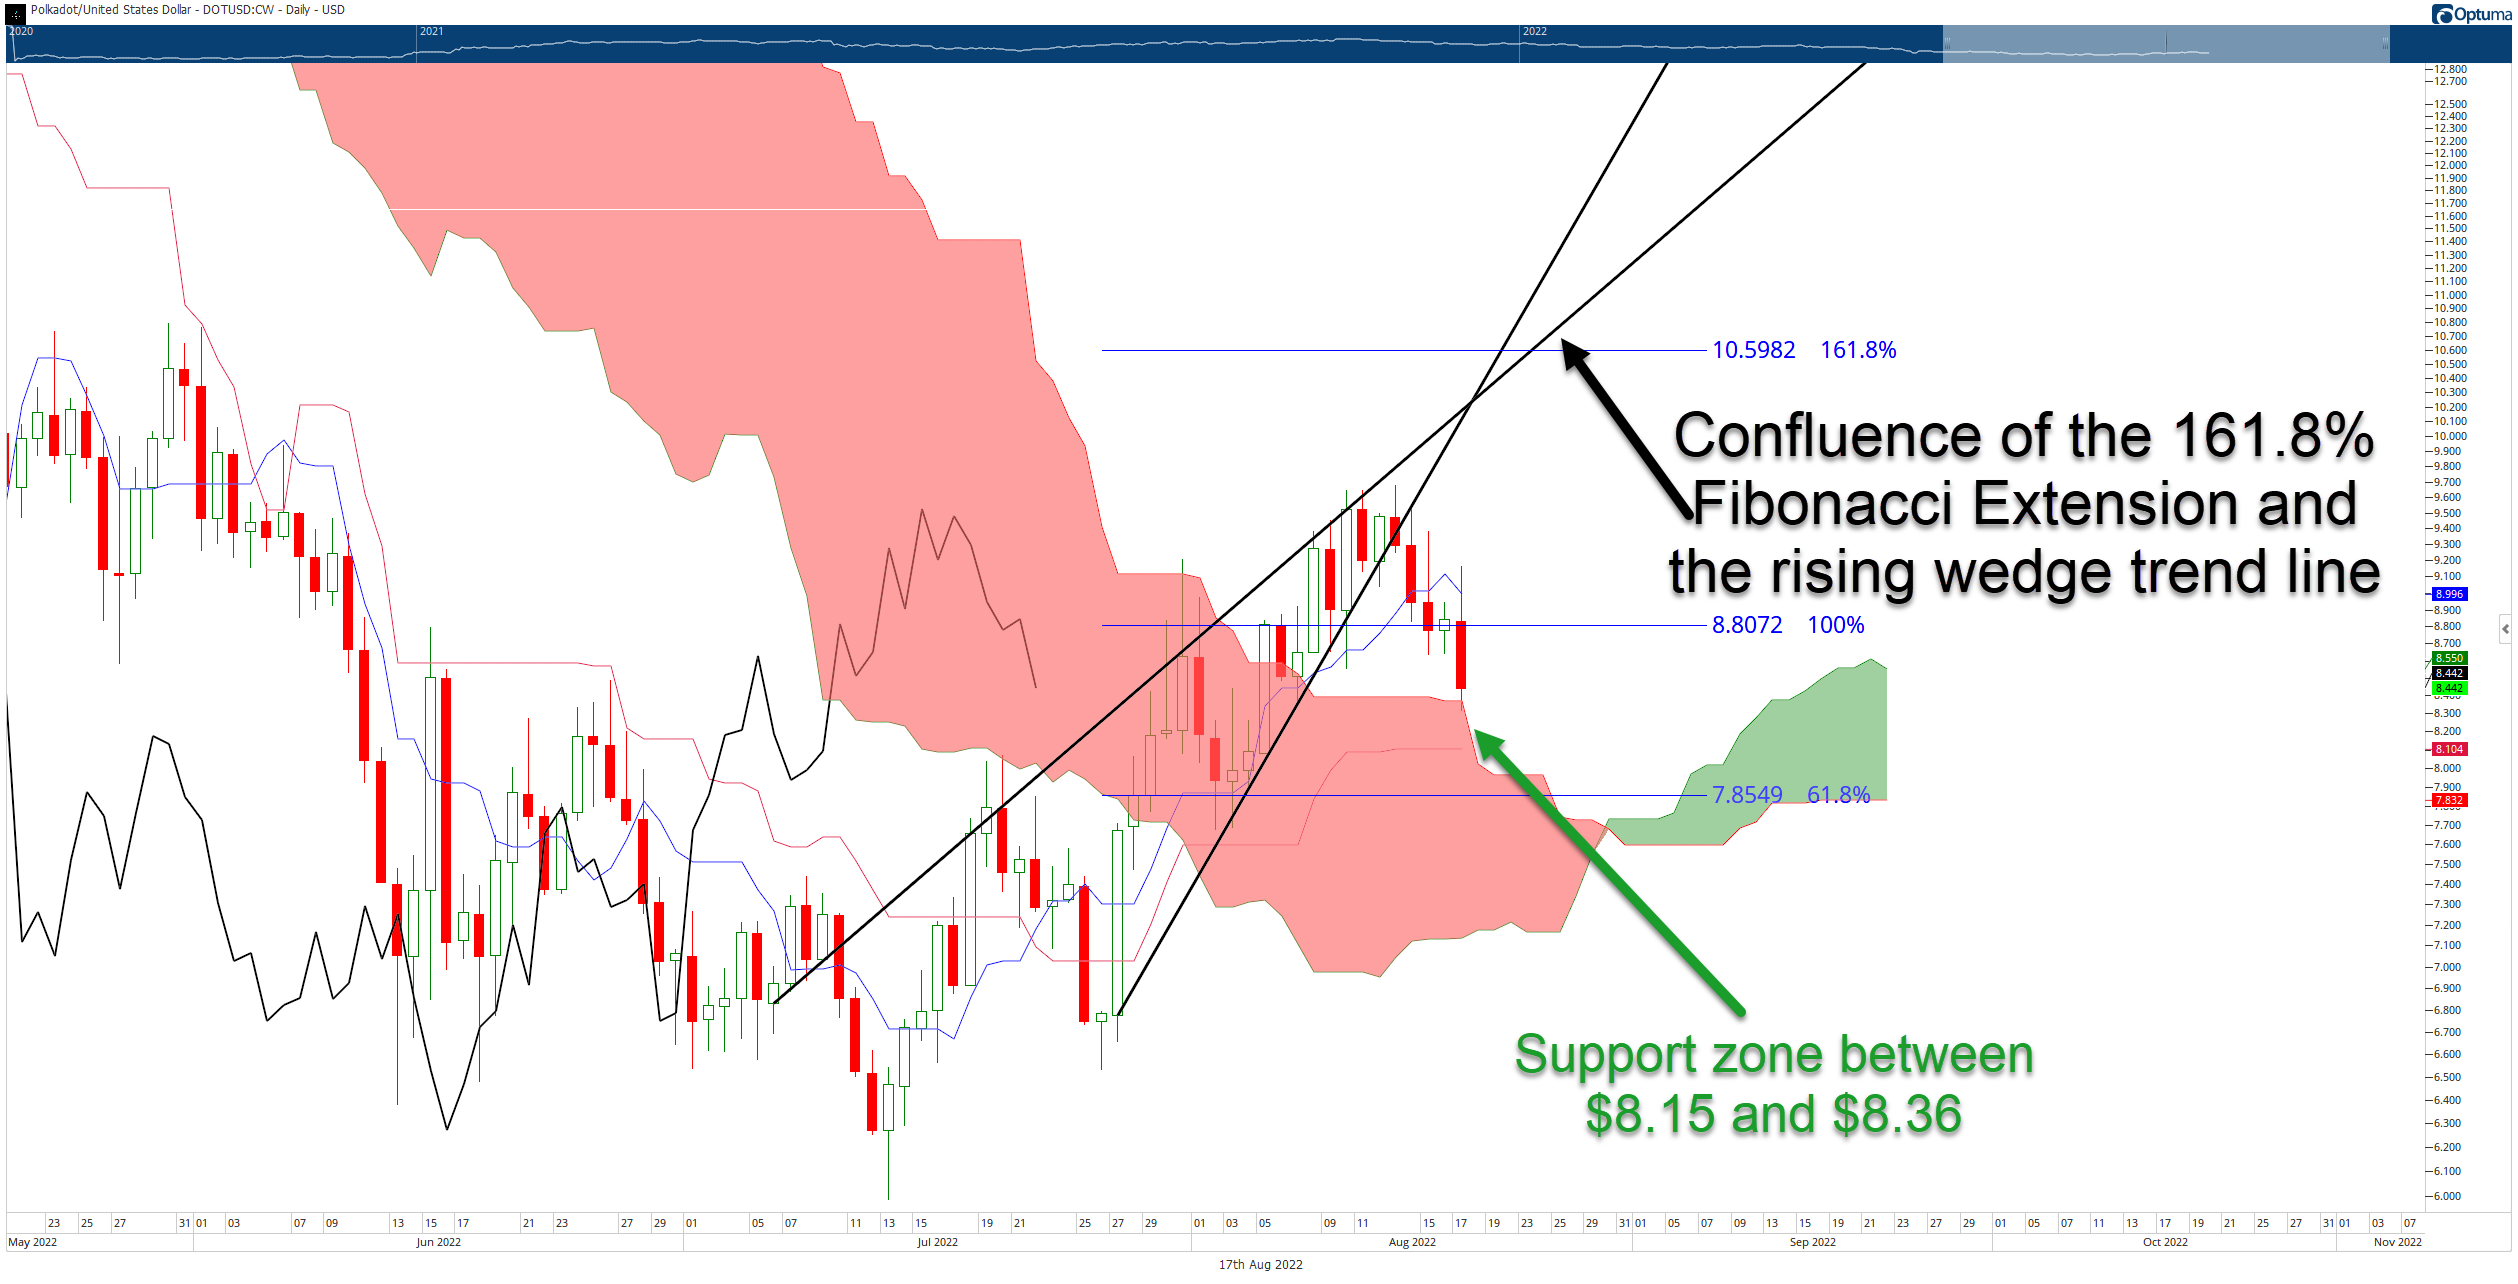
The thing that Bitcoin bulls don’t want to see happen has already happened on Polkadot’s ($DOT.X) chart: a fall below the rising wedge. However, Polkadot’s collapse means we can see how this important altcoin will react to support.
The top of the Ichimoku Cloud (Senkou Span B) and the Kijun-Sen create a strong support zone between the $8.15 and $8.36 value areas. It looks like a normal pullback during a bull market – but confirmation is needed.
If the bulls hold support, a big bounce is the probable next move. However, the rise may be limited to a confluence zone at the $10.60 value area. $10.60 contains the 161.8% Fibonacci Extension and a trendline from the previous rising wedge pattern.
The likelihood of $10.60 acting as the next primary resistance level is increased if DOT is trading near that level around the date of the Kumo Twist on August 30. Conversely, if DOT fails to find support between $8.15 and $8.36, DOT may drift to the next support level at the 61.8% Fibonacci Extension at $7.85.
Hence, according to the Ichimoku system and how to interpret Kumo Twists, a reversal or correction becomes highly probable if DOT is trading around the 61.8% Fib level around August 30.
TL;DR – Kind of a mixed bag. If bulls rally here, they face the risk of some cyclical selling pressure due to the Kumo Twist on August 30. On the other hand, if bears take over, the exact inverse is true. 🤓