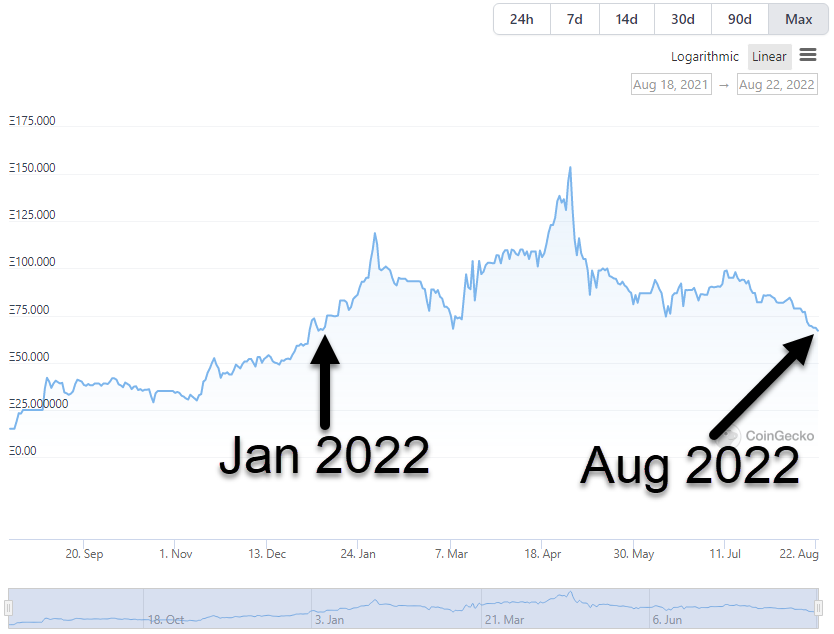
Before diving into ApeCoin’s ($APE.X) daily chart, I want to call your attention to the Bored Ape Yacht Club’s ($BAYC.NFT) floor price chart above. The current floor price of $67 Ethereum ($ETH.X) matches the lows found in January 2022.
There are legitimate fears in the NFT space that people who use their BAYC NFTs as collateral may face liquidation. The bearish environment extends to ApeCoin as well.
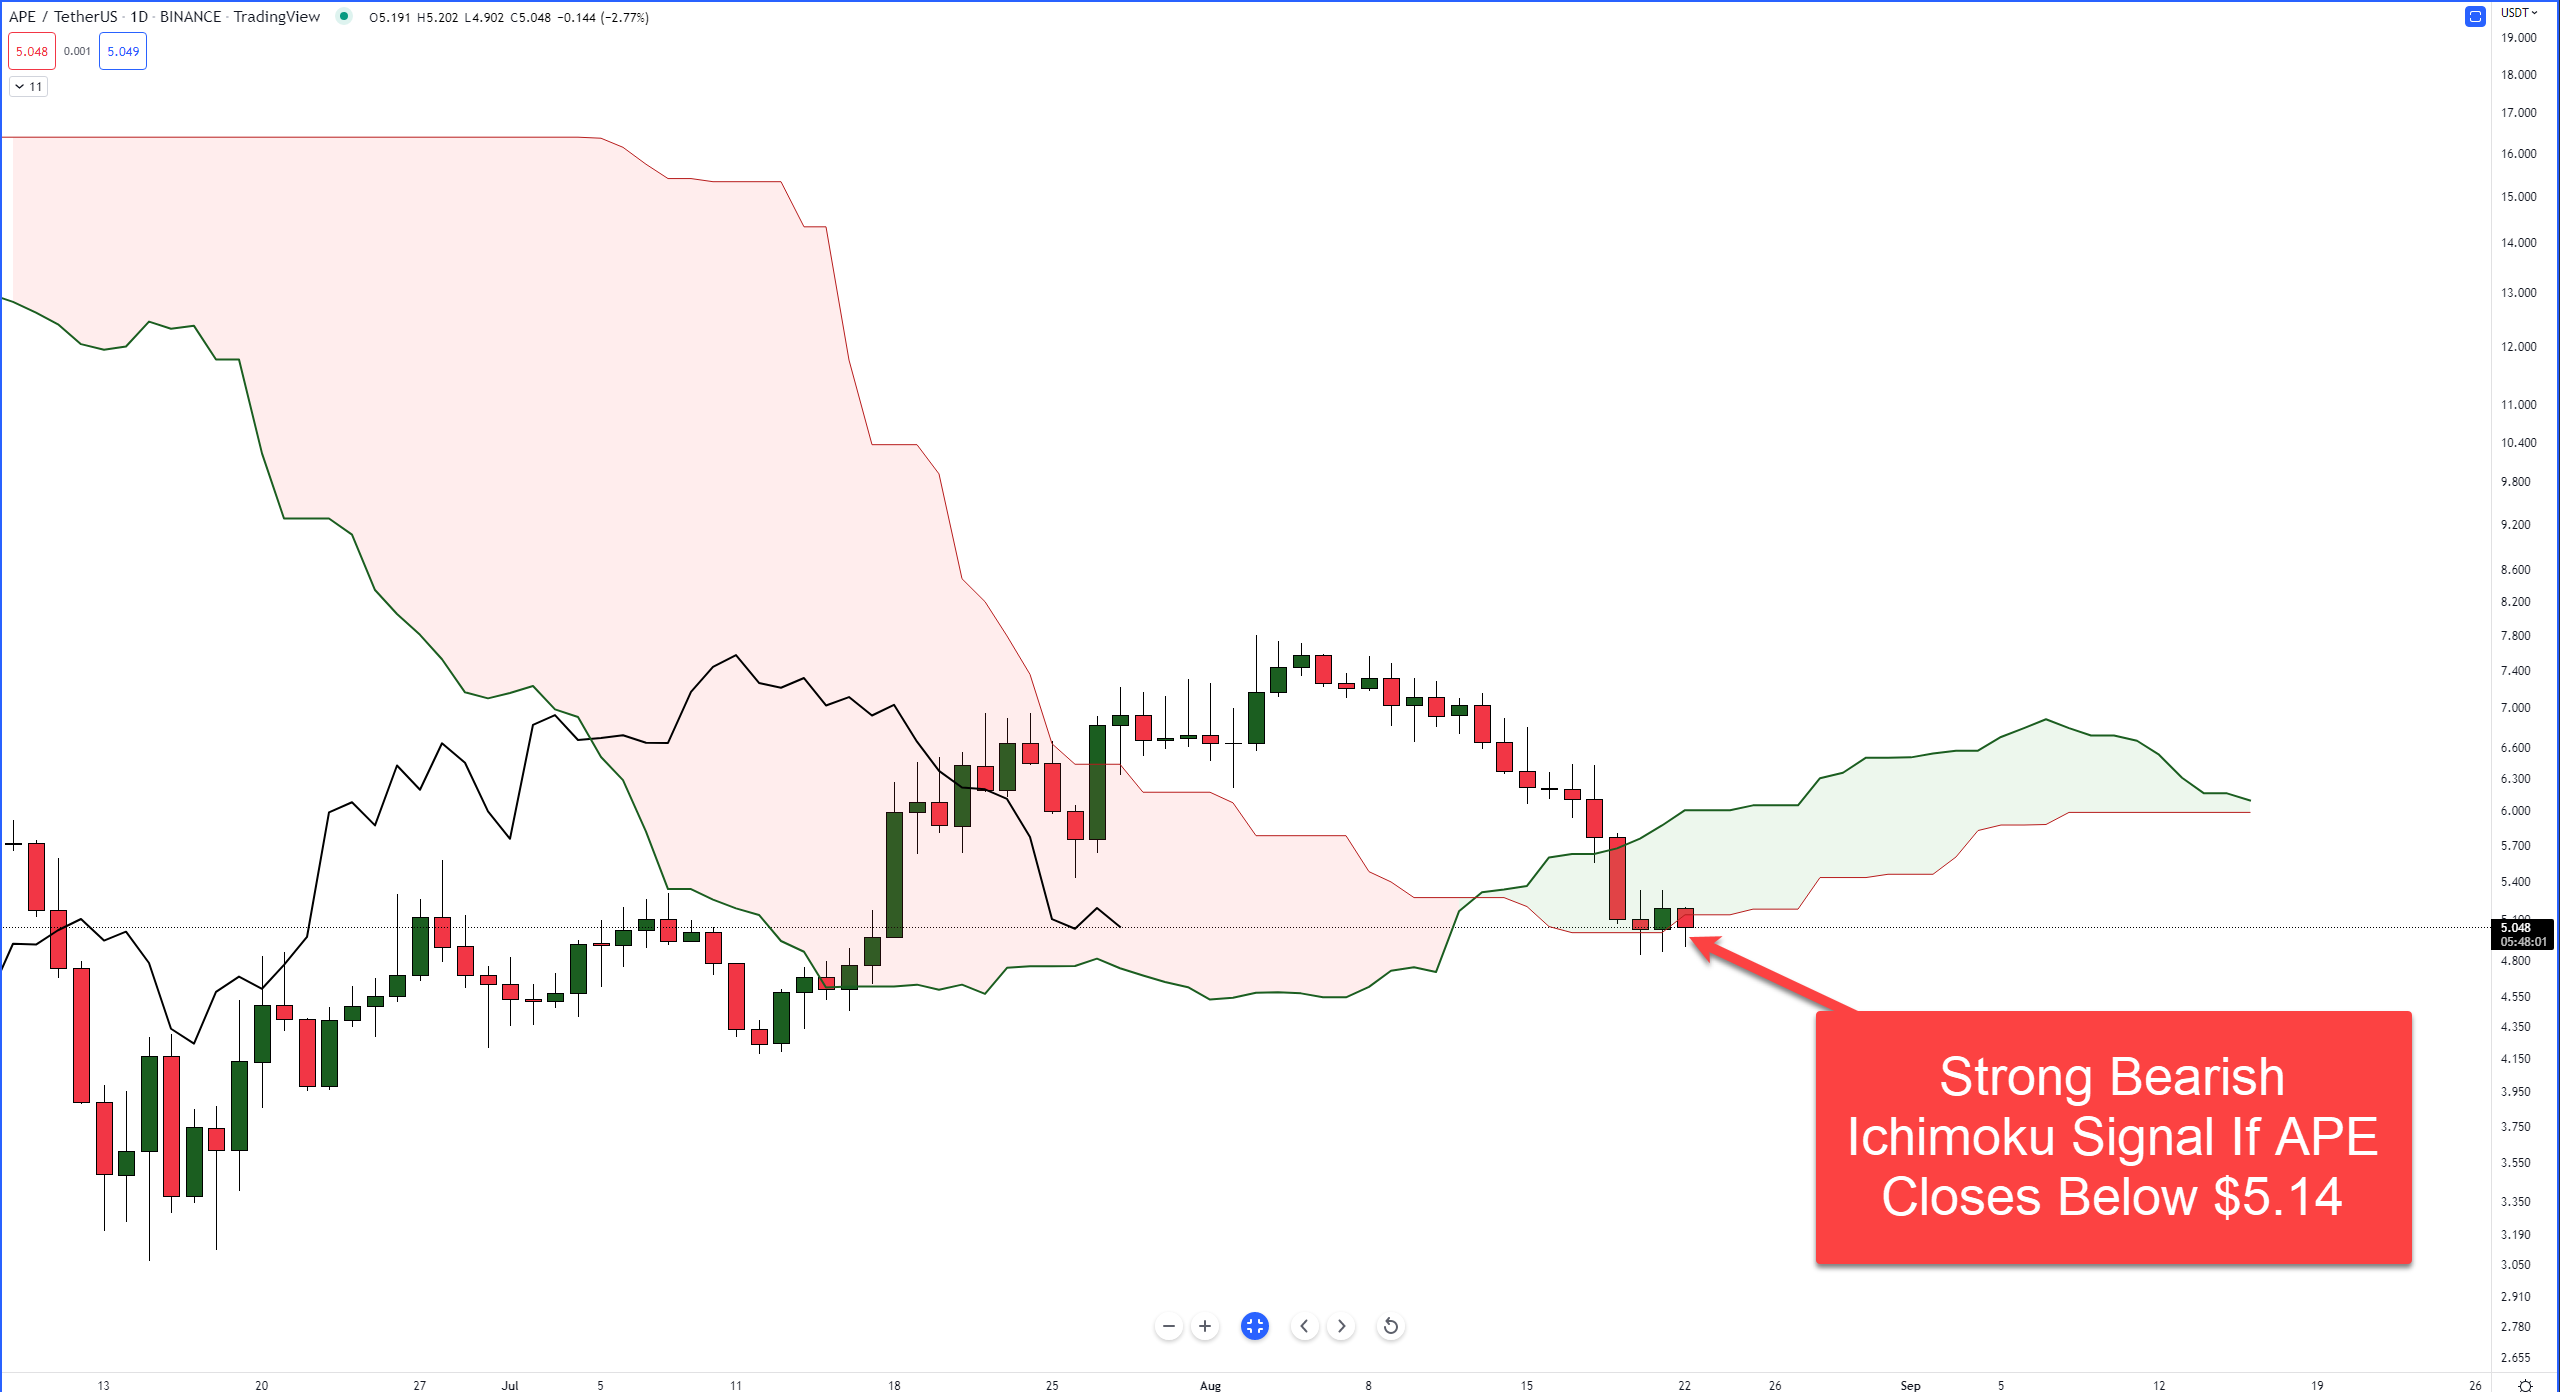
ApeCoin’s daily chart is up against a critical support zone that could trigger a substantial sell-off if it doesn’t hold. Within the Ichimoku Kinko Hyo system, one of the most sought-after bearish entry setups is developing: the Ideal Bearish Ichimoku Breakout.
Pro-tip: Click here to check out our introduction to the Ichimoku Kinko Hyo system.
Without going into too much detail, the final condition required for ApeCoin to trigger an Ideal Bearish Ichimoku Breakout is a close below the Cloud – at or below $5.14. However, there is a significant amount of danger to sellers ahead.
The Volume Profile on the image above begins at ApeCoin’s most recent major swing low of $3.06 on June 15, 2022. The red horizontal line is the Volume Point of Control (VPOC), representing the price level where the most buying and selling occurred.
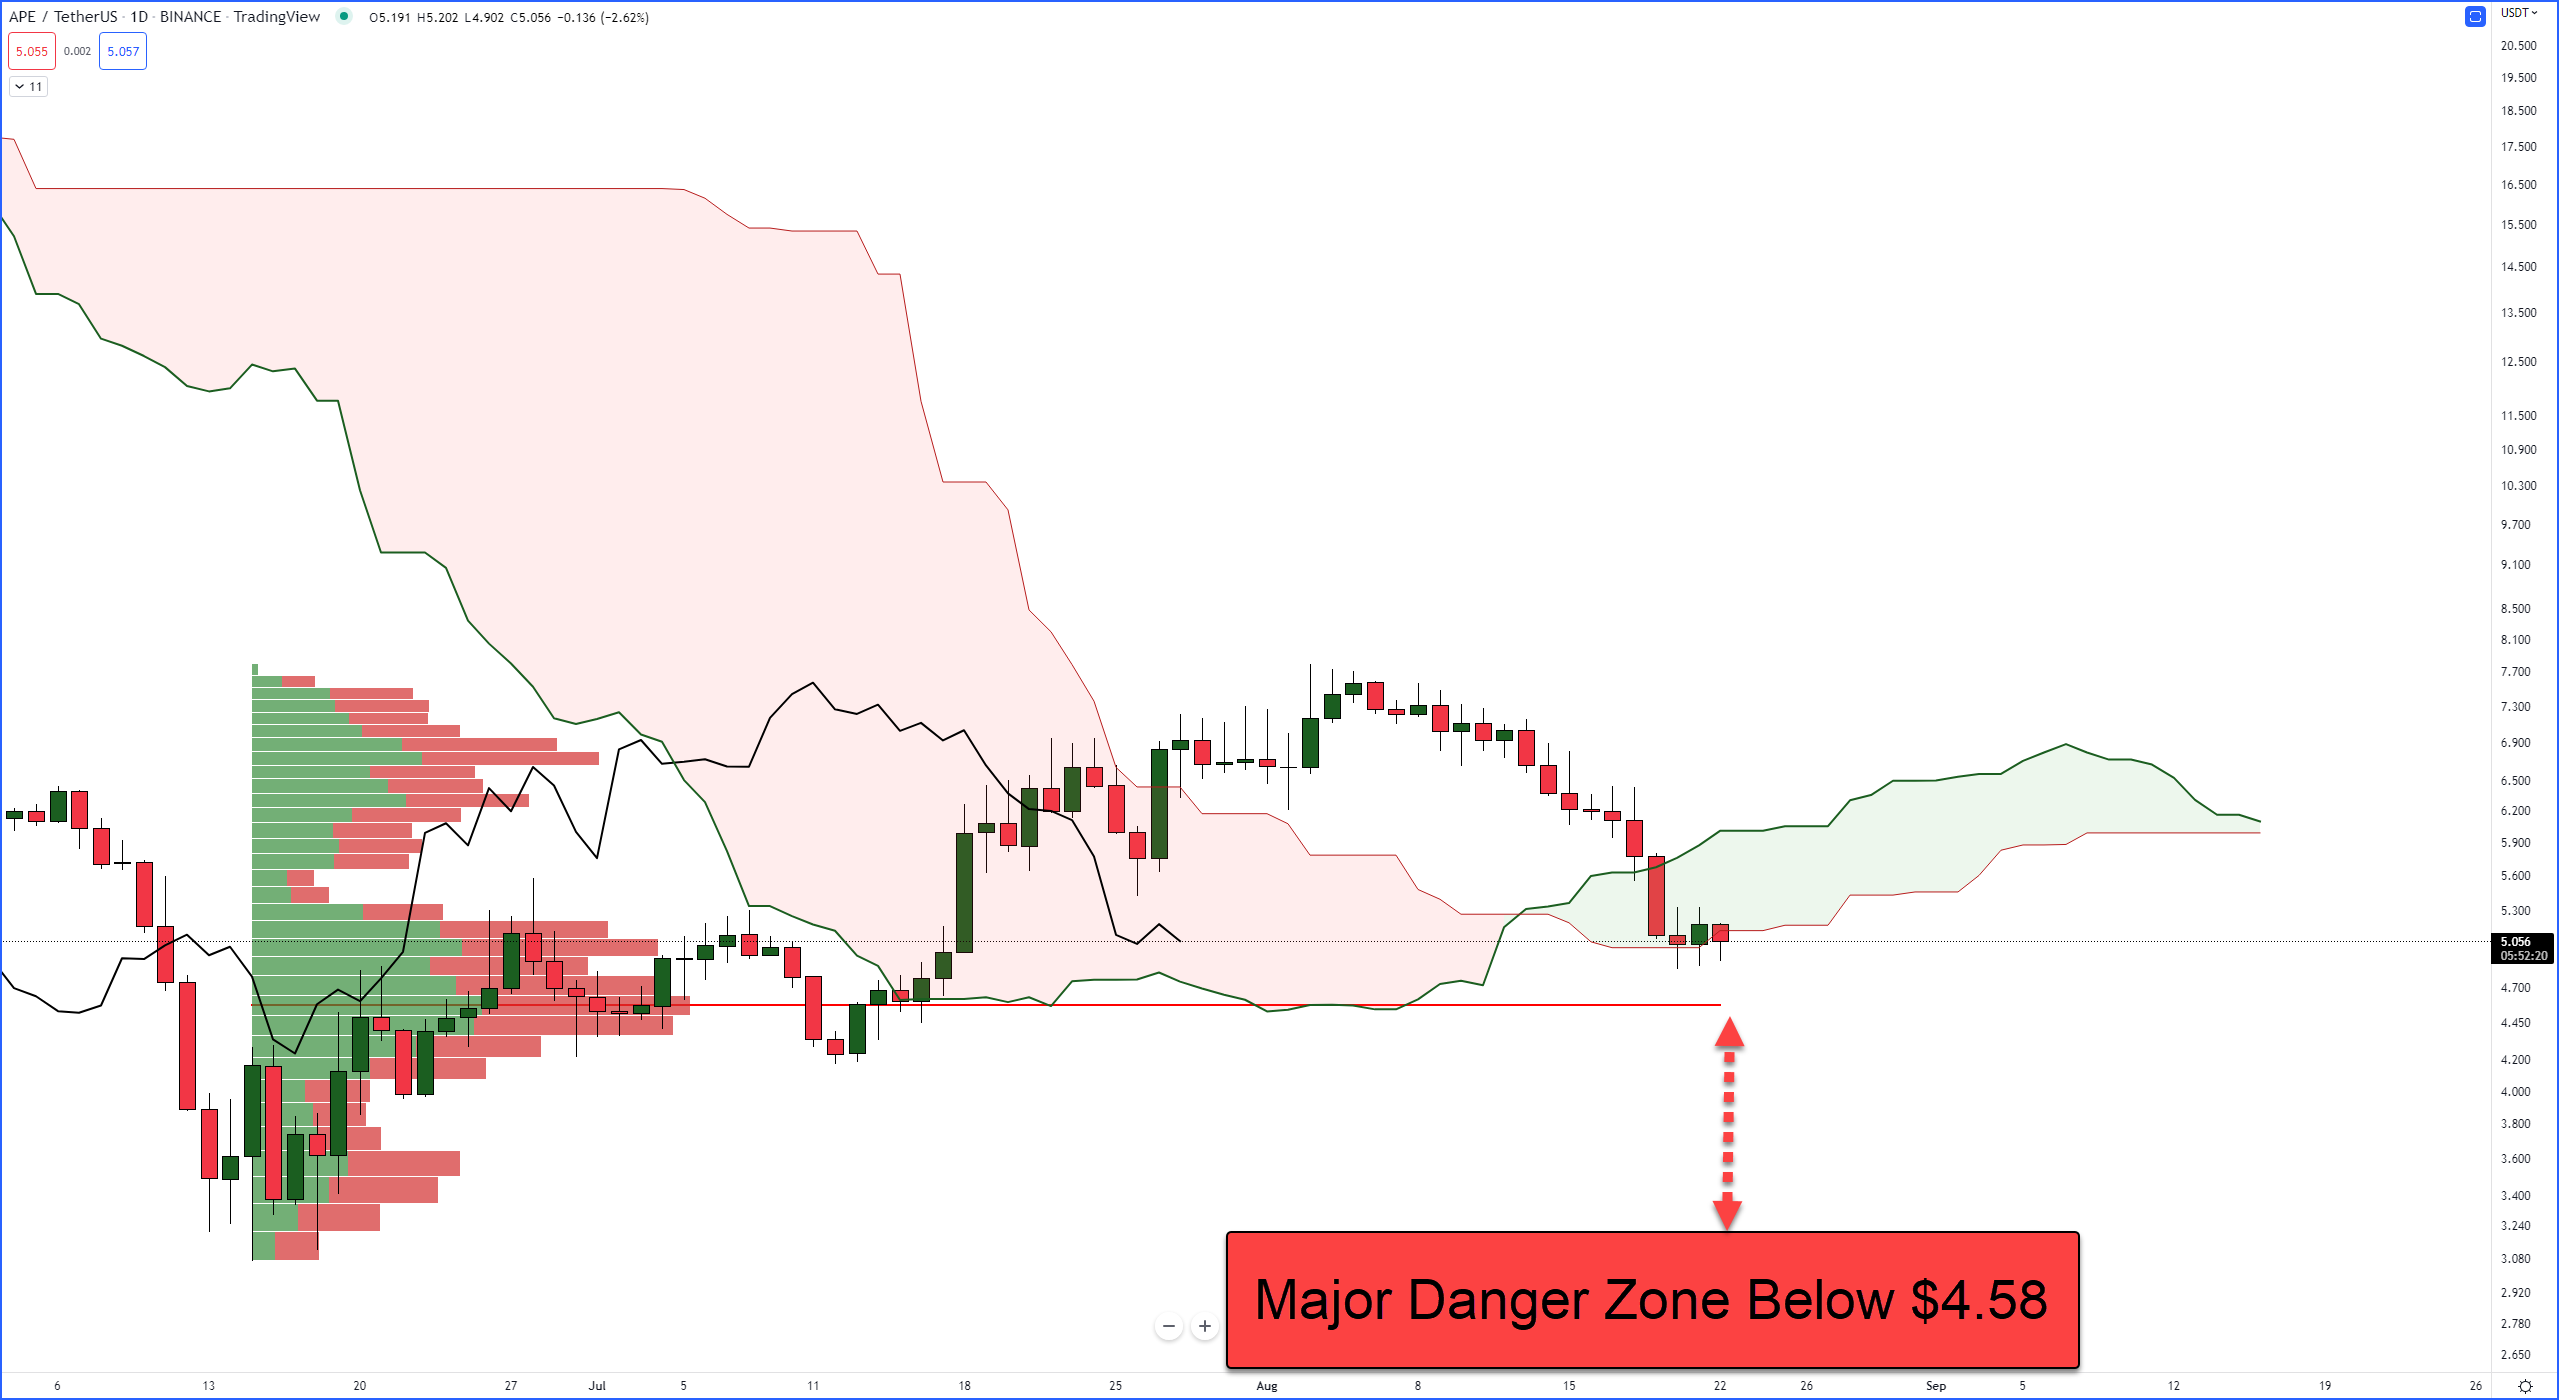
The VPOC is a powerful level of support and resistance. Currently, the VPOC is at $4.58. If you look where the Chikou Span is, you’ll notice that Senkou Span A shares the $4.58 value area with the VPOC. This is important because the Chikou Span will respond to the same support and resistance levels as the current price action.
Do note that the VPOC and Chikou Span will share the same value area for the next eleven days (Sept 2, 2022).
This means that, even if ApeCoin completes a daily close below the Cloud, there is still a good chunk of support that could prevent further downside movement. But what do the oscillators show?
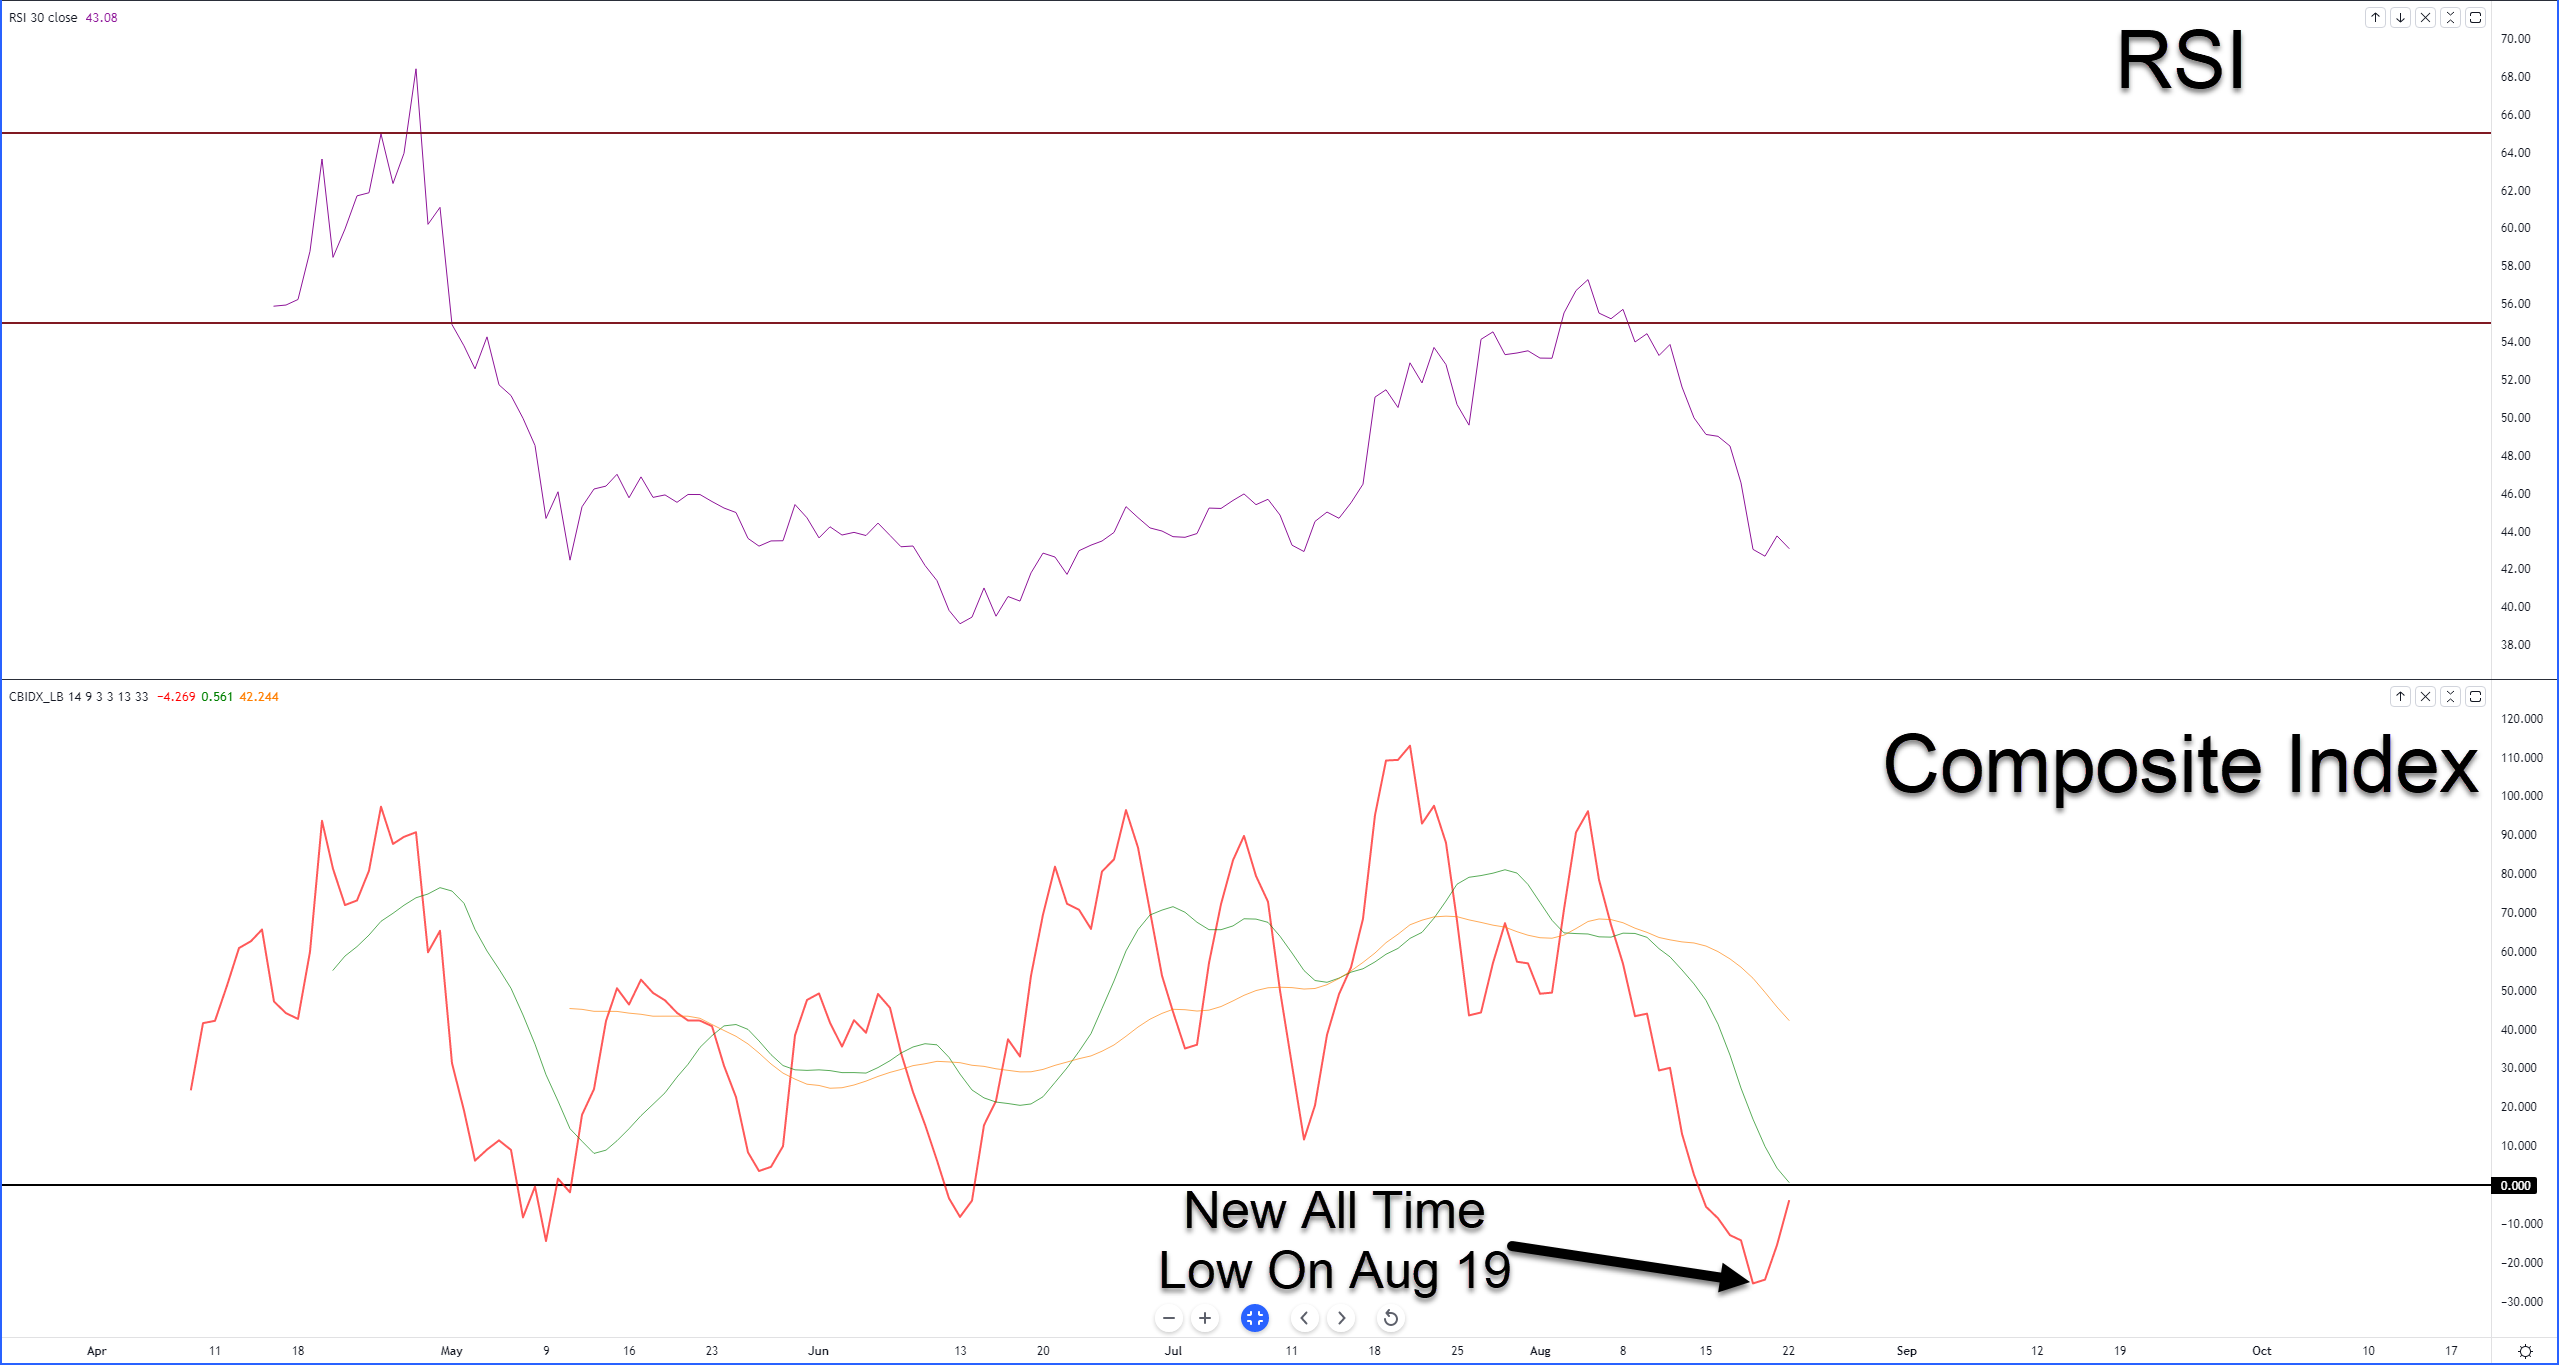
The oscillators in the image above are the Relative Strength Index and the Composite Index. The Composite Index, created by Connie Brown, is essentially the RSI but involves a momentum calculation. As a result, it (Composite Index) can detect divergences the RSI can’t.
For bulls, there is a strong reason to interpret a bounce for ApeCoin is coming because of the recent new all-time low formed in the Composite Index and a possible cross of the Composite Index Line (red) over its fast-moving average (green). The closeness of the potential cross-over to the zero level is extremely significant.
The Relative Strength Index shows that further downside pressure could remain very strong for bears. Using Connie Brown’s methods to interpret the RSI’s position, it is in bear market conditions. (Overbought is 55 and 65, Oversold is 30 and 20). So, because the RSI is still above 30, a strong drop below the Ichimoku Cloud could mean new 2022 lows.
If bulls want to see some evidence that the threat to further downside pressure has subsided, then they may have to wait. From an Ichimoku perspective, ApeCoin needs a daily close at or above $6.10 to eliminate most of the near-term bearish pressure. 💎