Oof. Last week was brutal for bulls. Well, it was brutal for short-term traders who are long and anyone who has leveraged longs. For long-term bulls, the lower prices go, the happier they get. By the way: if you want to skip the nerdy bits with Elliot Wave Theory, just fast forward to the end of this article for the price levels to watch.
Bitcoin’s ($BTC.X) close on the weekly chart for last week is a great example of what ugly looks like (for bulls). Bitcoin hit the $25,000 level only to be smacked down to the $20,000 zone, ultimately closing just a hair below $21,500.
The candlestick for last week was one of the most sought-after bearish candlestick patterns: a Bearish Engulfing candlestick. The bearish engulfing candlestick is often a precursor to strong and renewed/continued downside movement. But a single candlestick pattern is not enough analysis.
Currently, Bitcoin’s price level at the $21,000 level makes things a little tricky.
If you want a topic that will make Technical Analysts begin a fight like Anchor Man 2, bringing up Elliot Wave Theory is a great way to do it. I’m not going to waste your time going through a watered-down version of ‘this is what Elliot Wave Theory is.’
If you don’t know anything about Elliot Wave Theory, that’s fine – because all you want to know is how low Bitcoin could go and/or if the downside movement will stop soon.
Bearish Continuation Case With Elliot
Assuming Bitcoin has another leg lower, extending to a 5th Wave, Bitcoin may have a deeper trip south than some expect. Wave 5 is usually:
- The inverse 123.6% – 161.8% of Wave 4
- Equal to Wave 1
- 61.8% of Wave 1 + 3
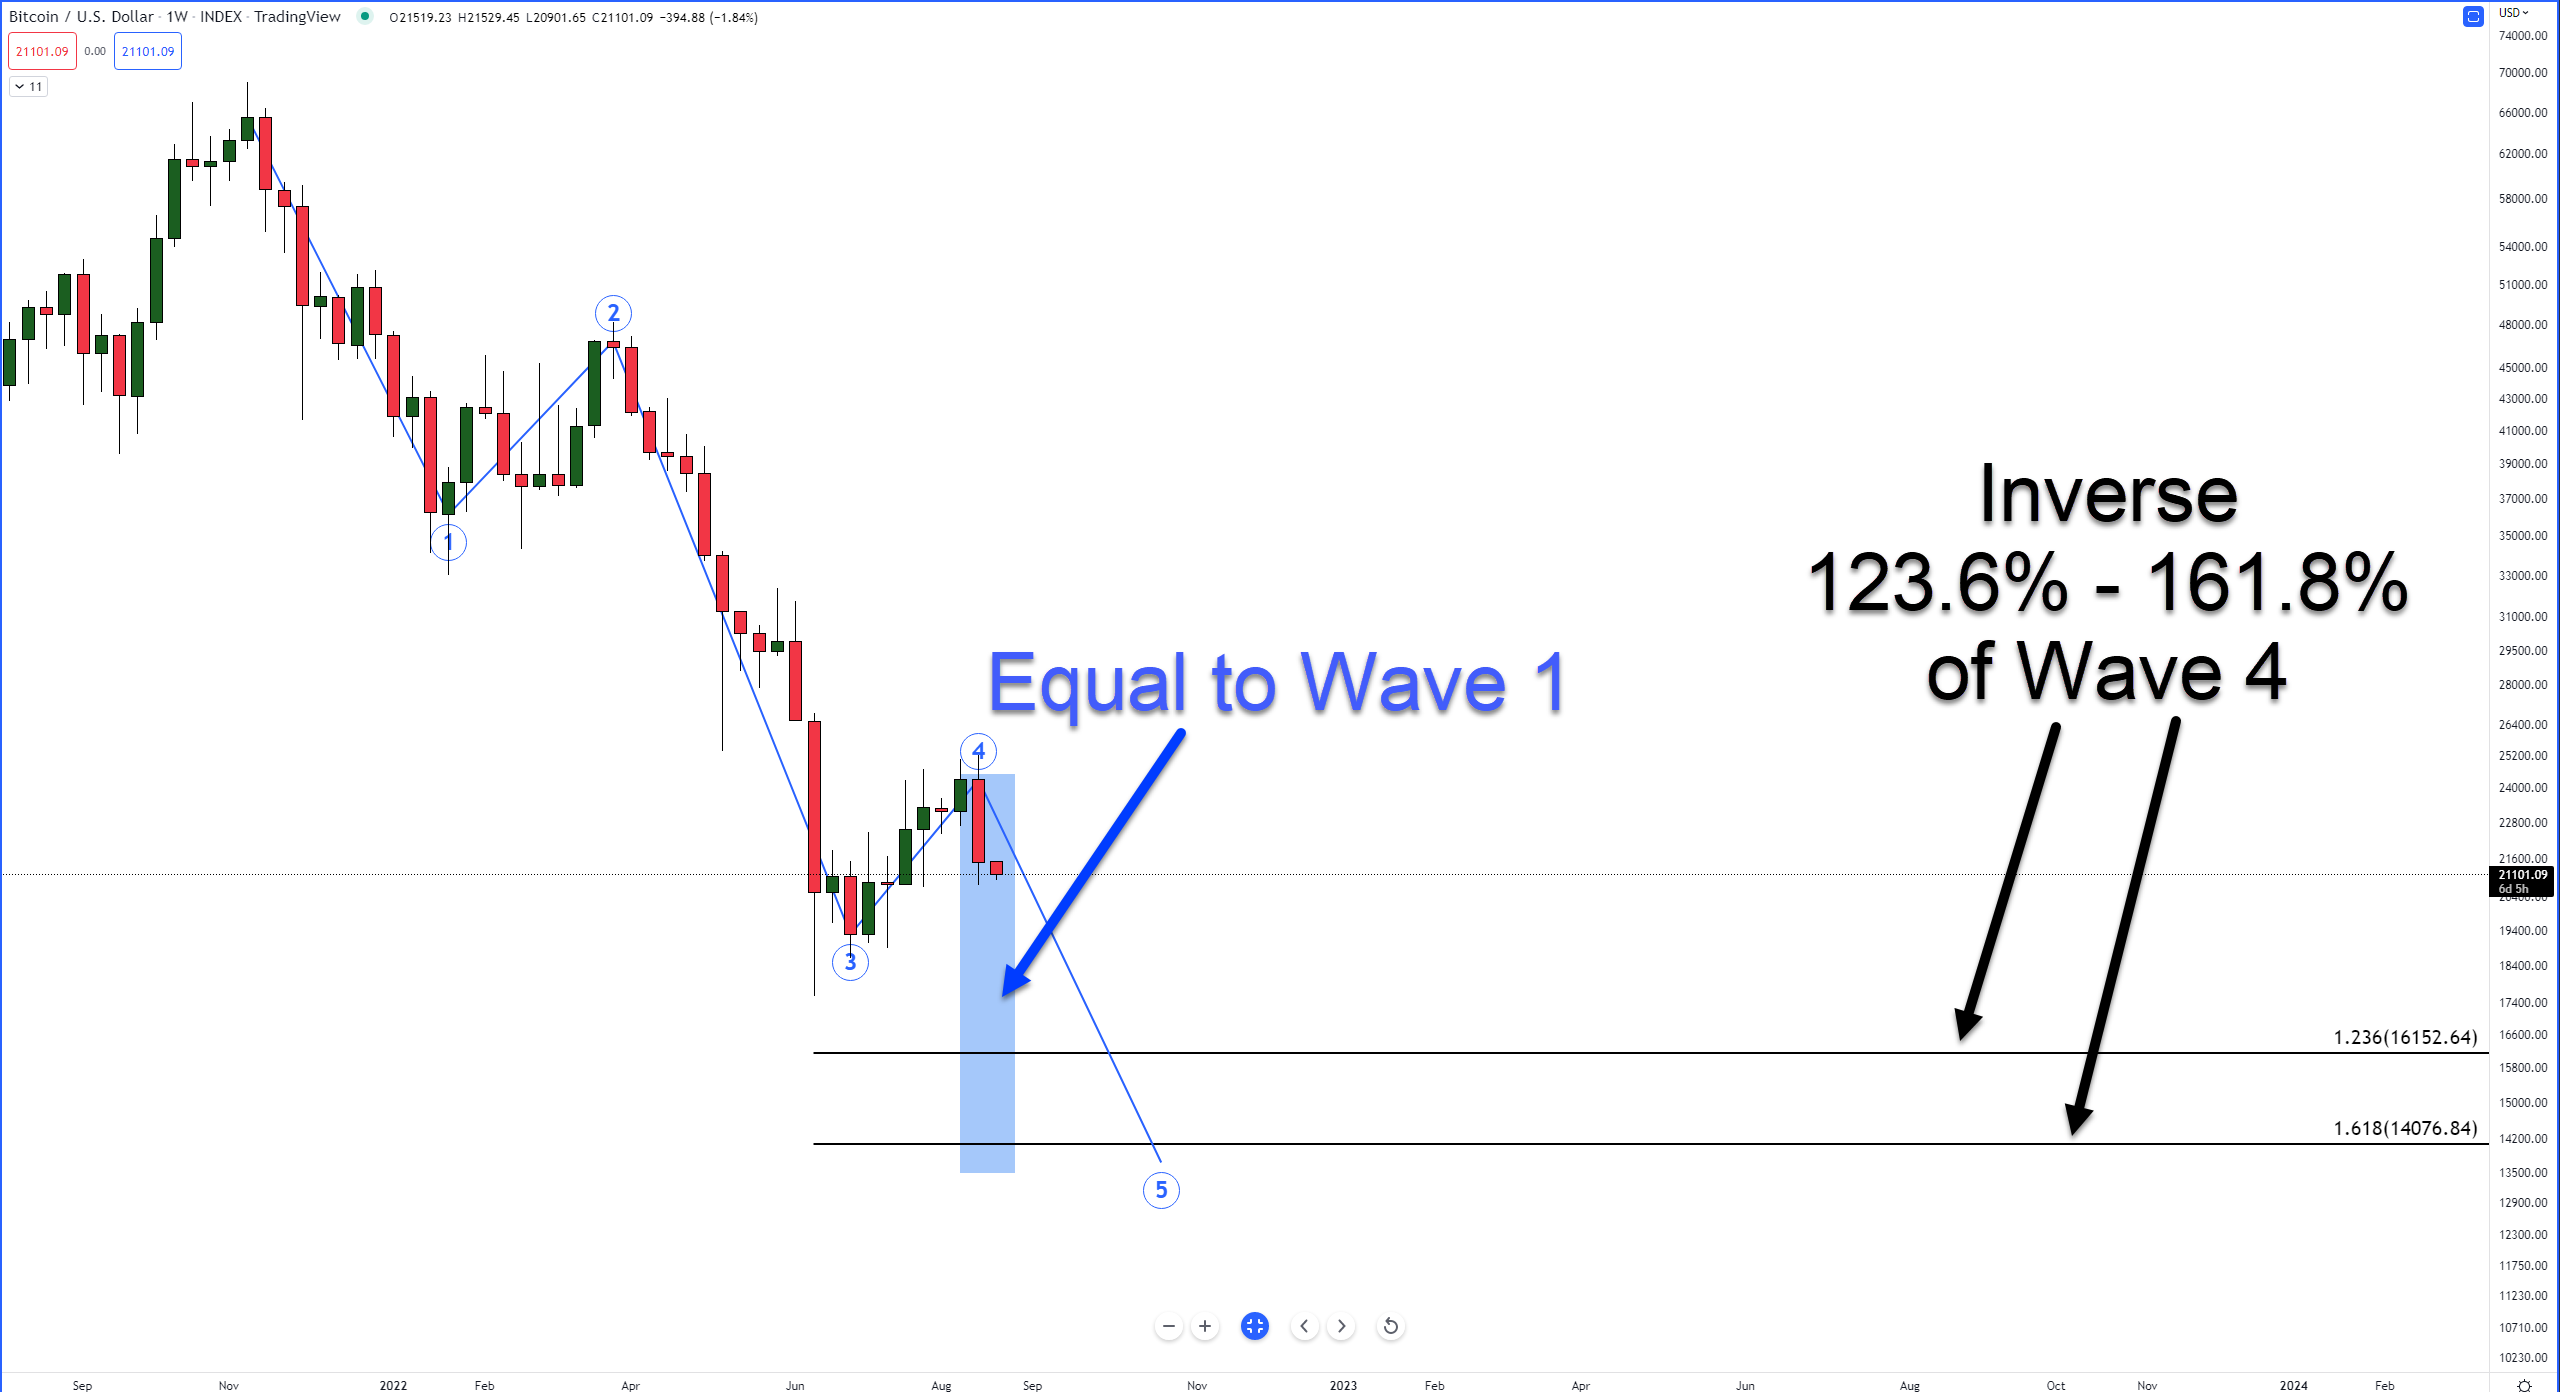
The blue column is the range equal to Wave 1, which puts Bitcoin in the $13,500 value area. The 123.6% and 161.8% Fibonacci levels are the inverse Fibonacci retracements of Wave 4. From this perspective, Bitcoin has a range between $13,500 and $16,000 to complete Wave 5.
Bullish Reversal Case With Elliot
On the bullish side of the analysis, the hypothesis is an A-B-C Corrective Wave is already complete. This particular type of Corrective Wave is known as a Simple Zigzag. One of the key reasons some analysts may believe that the A-B-C Corrective Wave is complete is because of the factor of time.
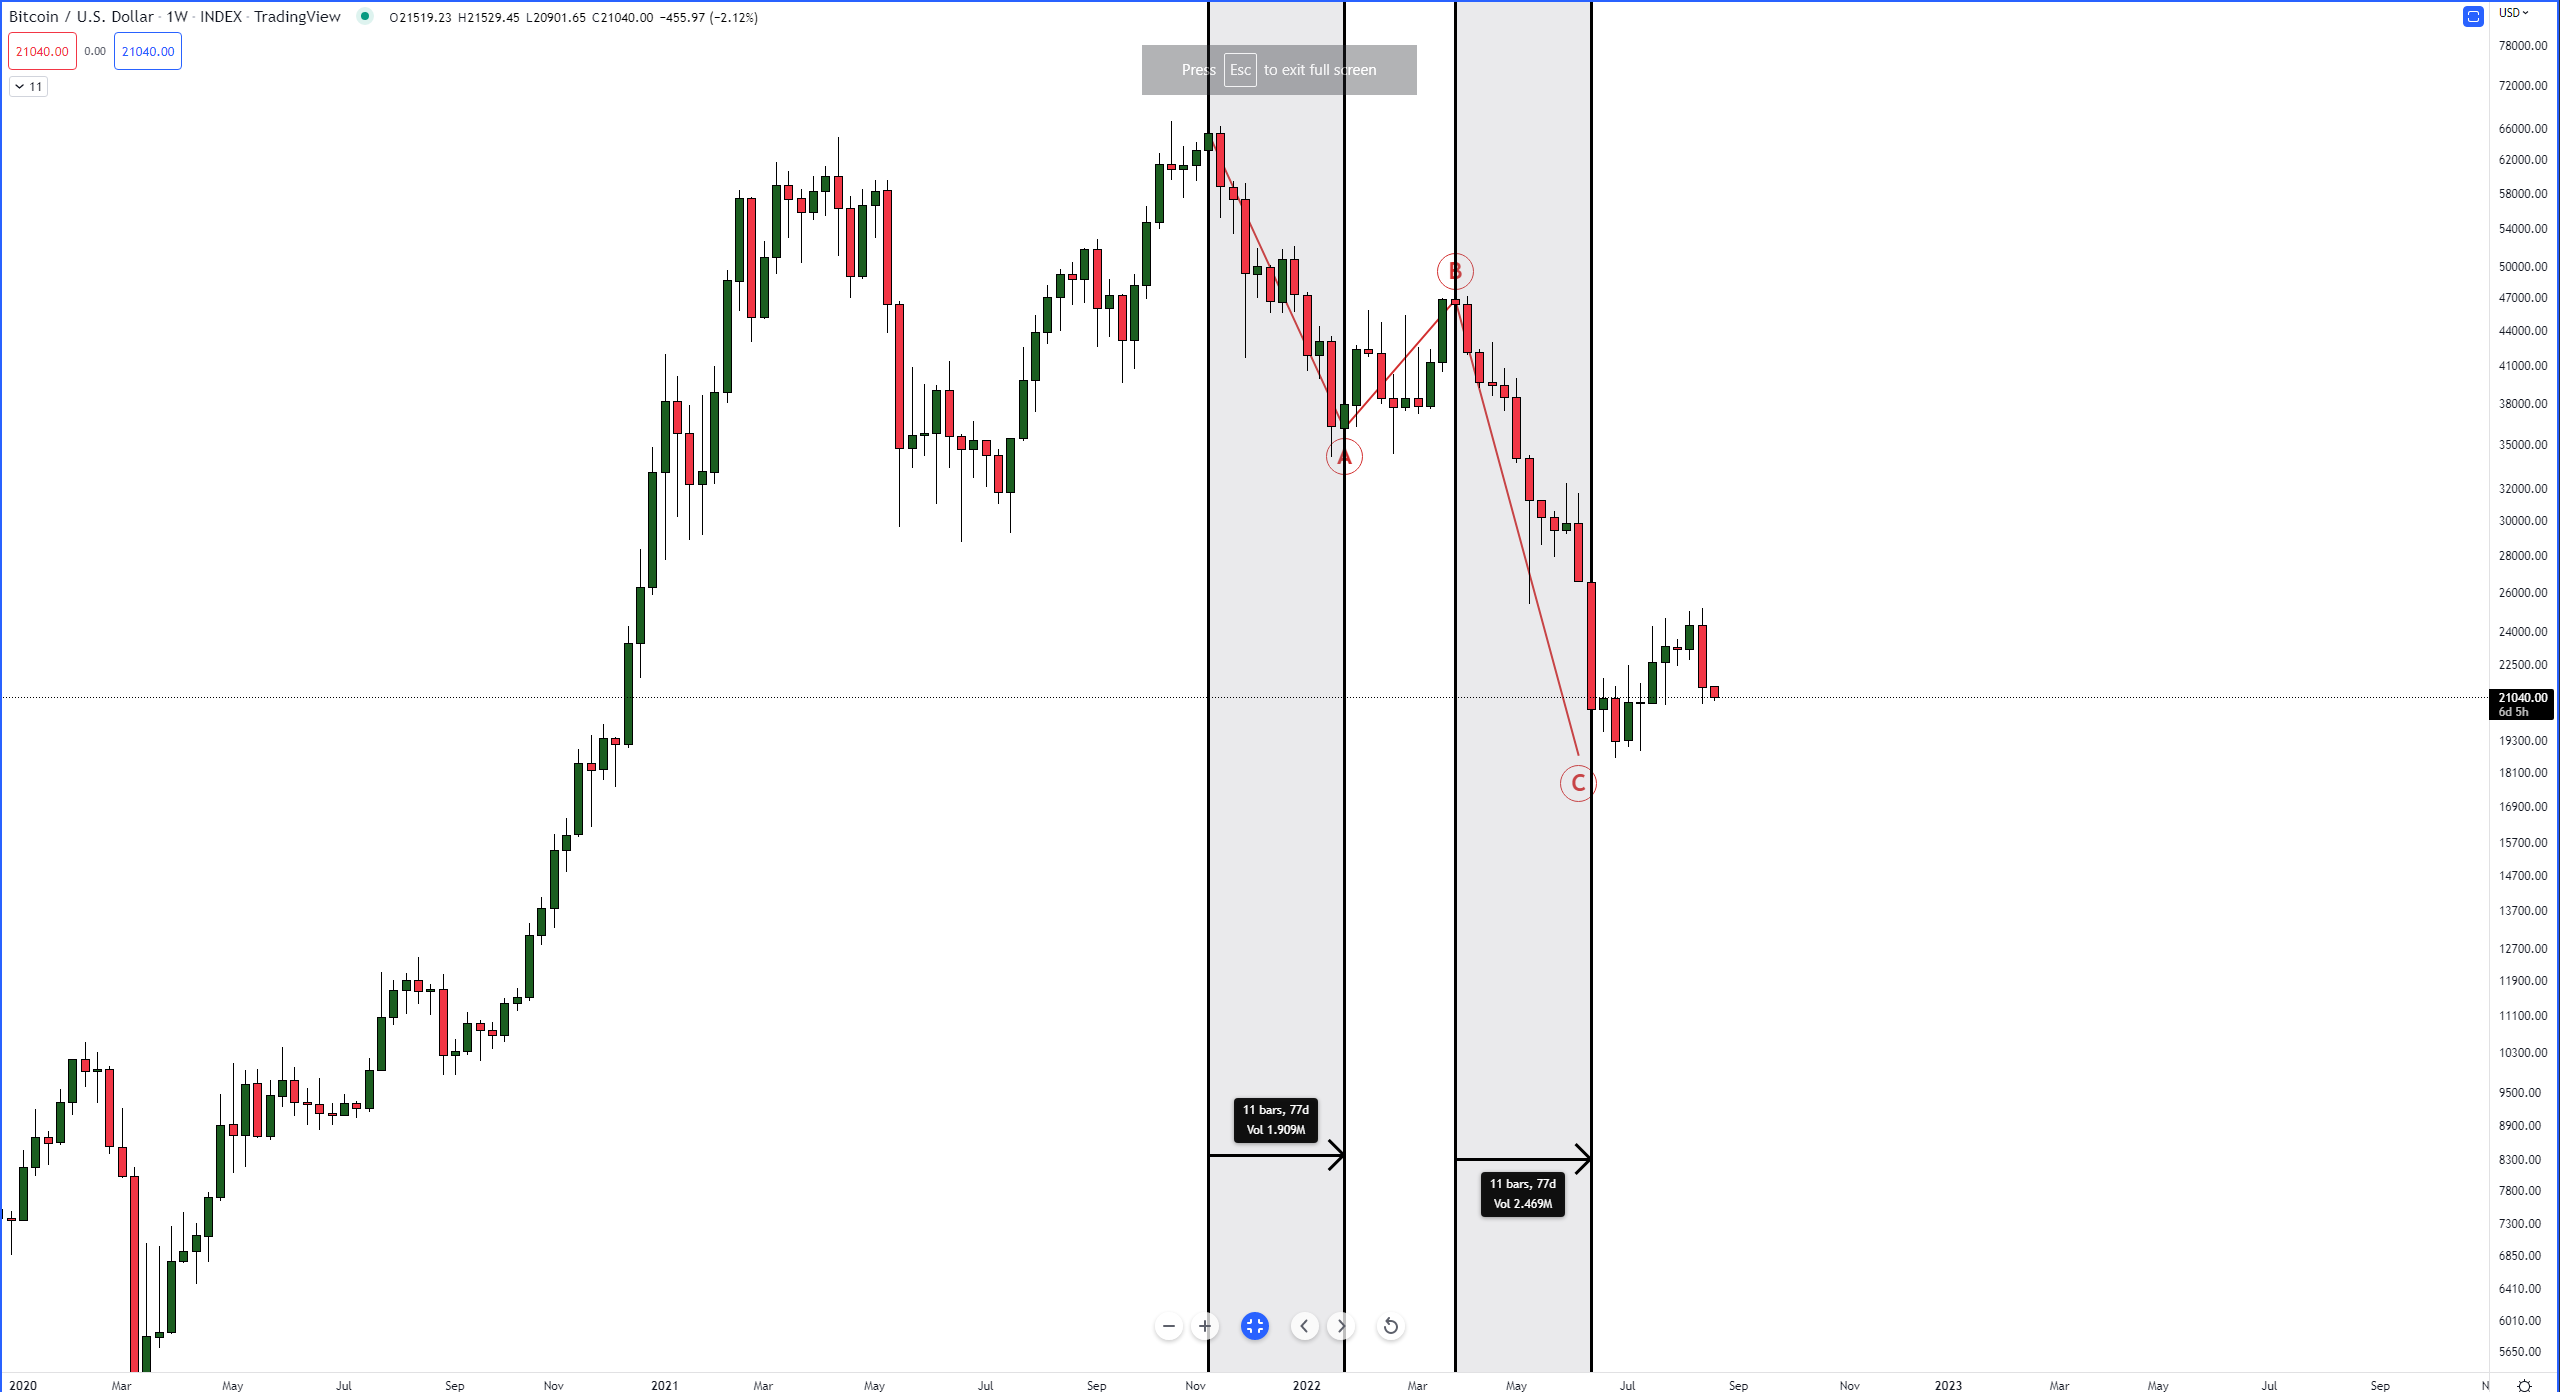
The Simple Zigzag pattern is one of the only Wave patterns in Elliot Wave Theory with a time rule. Wave C needs to equal the time of Wave A. Is it? On the weekly chart, Wave A is eleven bars, and Wave C is eleven bars.
I’ll end the Corrective Wave analysis and construction there – more could be added, but this is already getting into the over-the-top realm. Hey, if you’re still with me, great!
Moving to the daily chart, the structure here changes quite a bit. In fact, from a daily chart perspective, nothing here looks like there’s an opportunity for being bullish. And as far as where Wave 1 ends – no one knows yet.
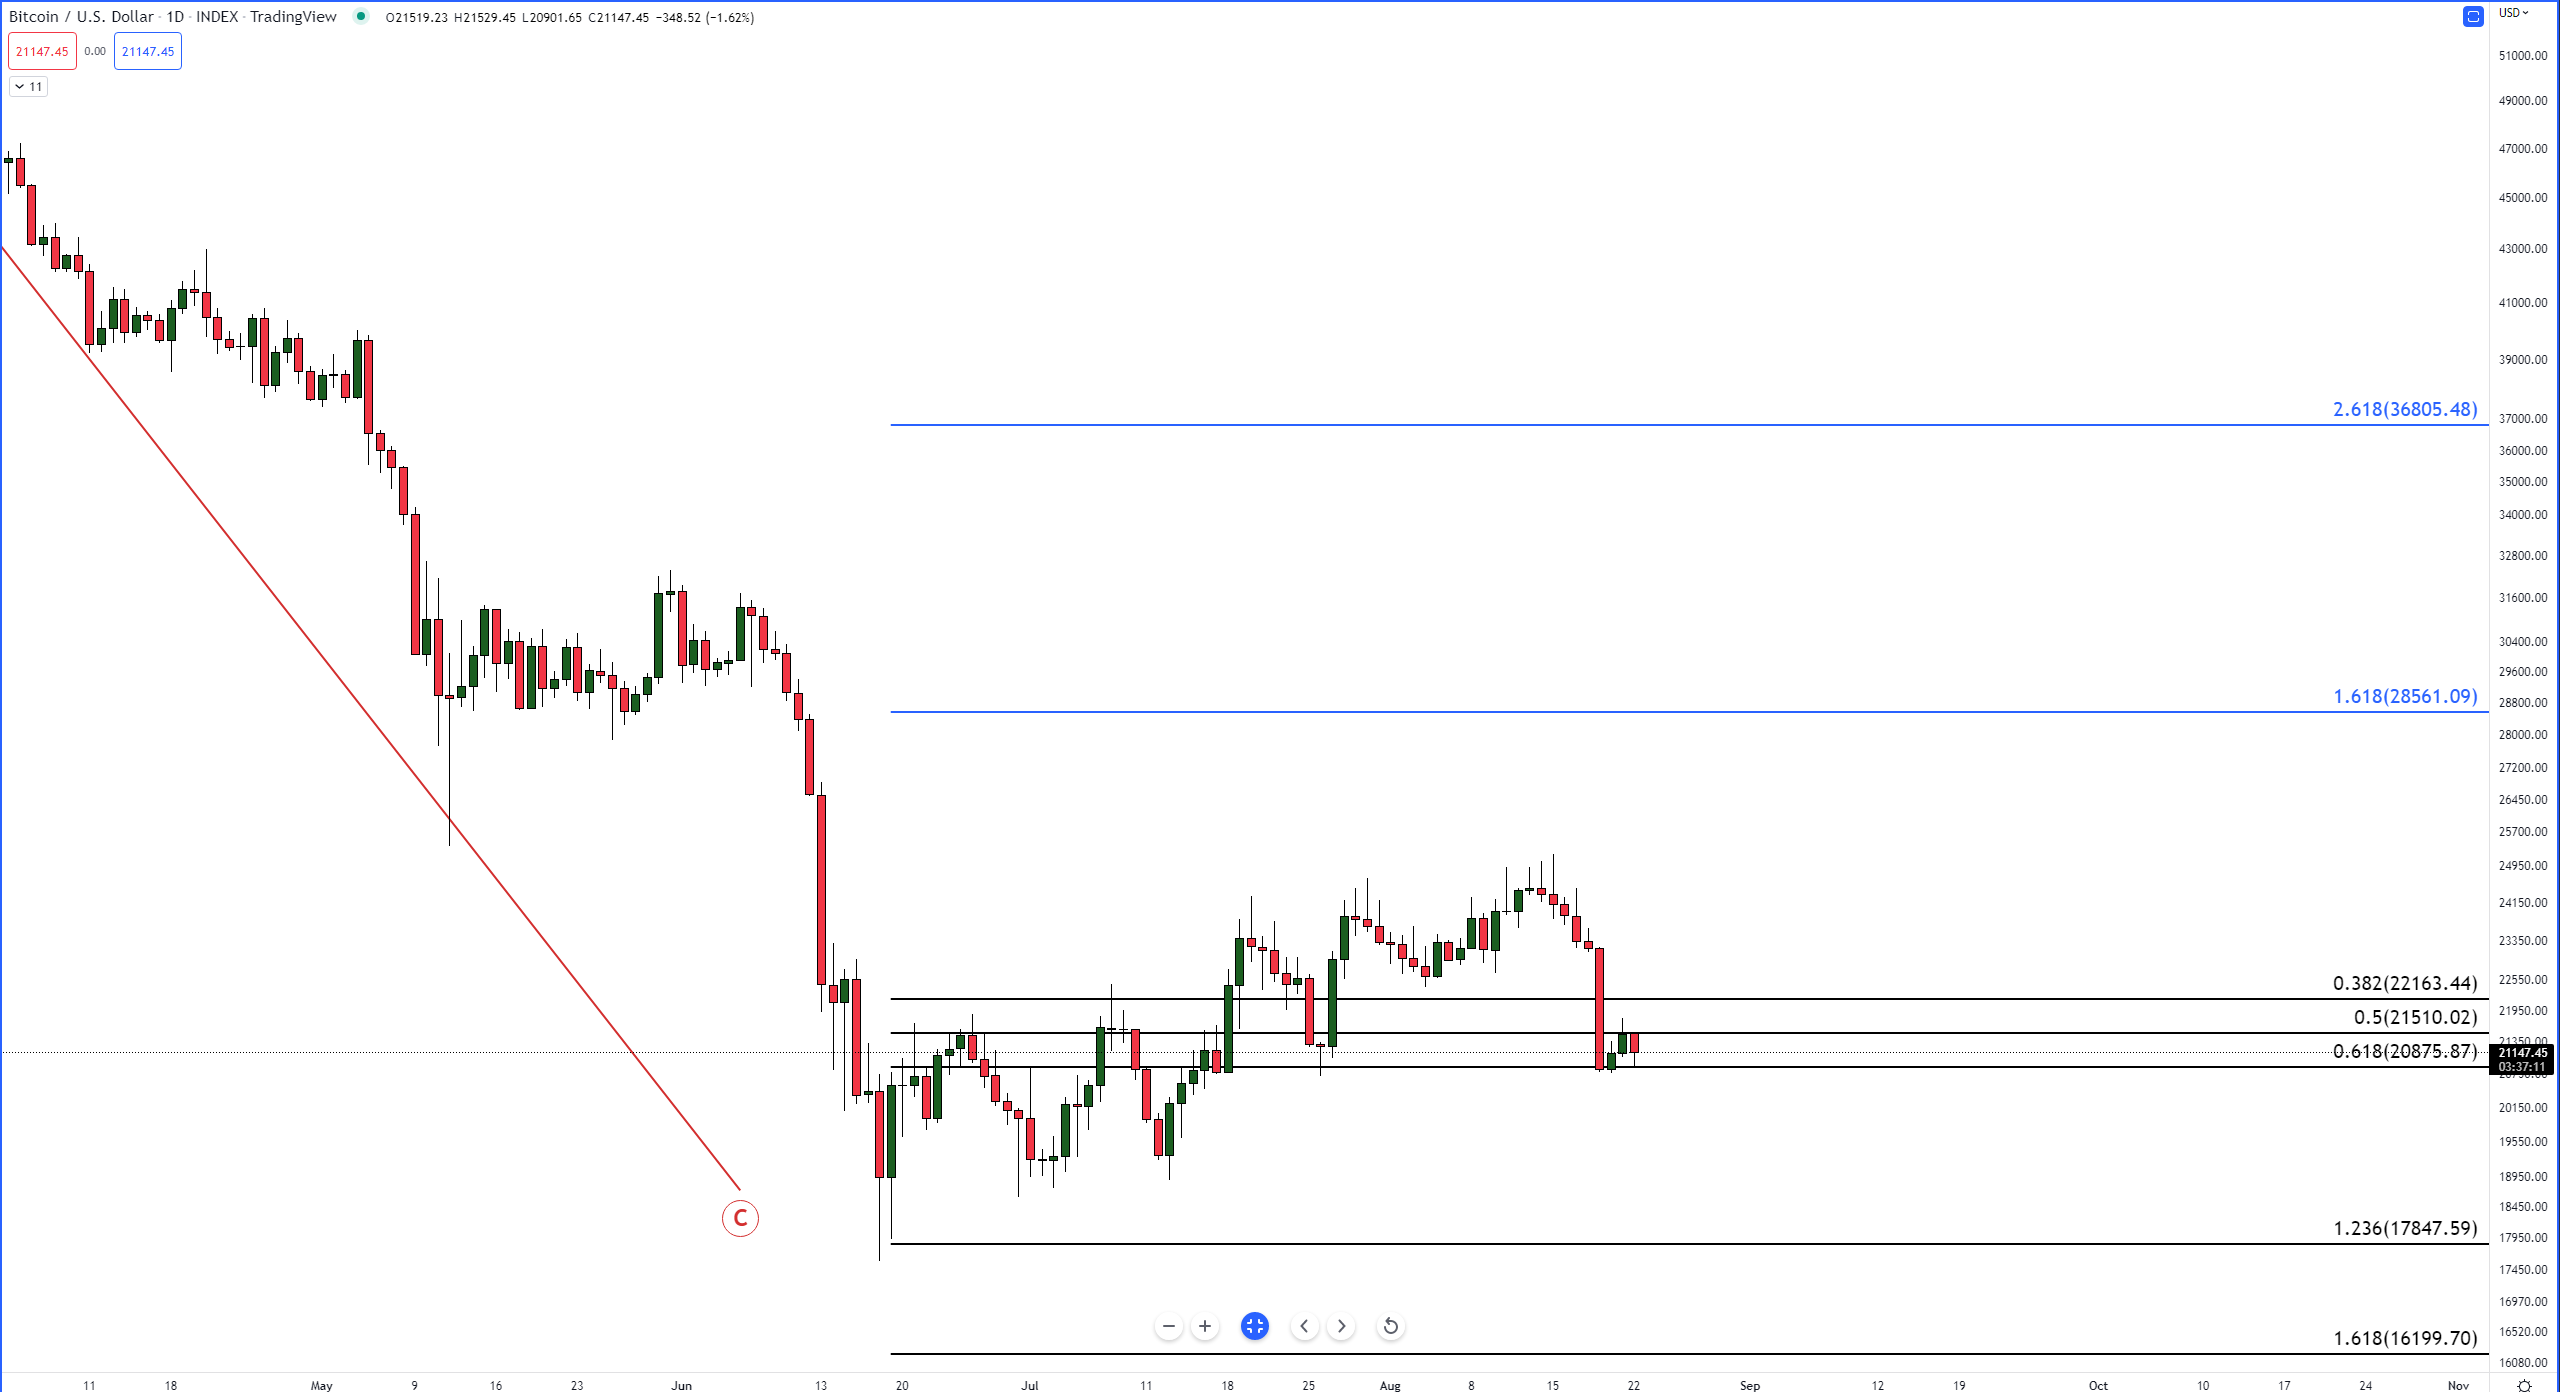
Let’s take what’s formed so far. First, it doesn’t really look like an appropriate structure on the daily chart to confirm a Wave 1 – but if we do a Fibonacci retracement of the prior upswing, then Bitcoin has retraced enough of that last move to equal Wave 2 – but, again, the structure just isn’t there on the daily.
Price Levels To Watch (Bulls) – Rule 1 in Elliot Wave is that Wave 2 can’t move below Wave 1. If we get a daily close below 19,000, we’re likely looking at a deep drive south. If bulls close at or above $25,000, Wave 2 is likely confirmed. We know that Wave 3 is typically a 161.8% or 261.8% of Wave 1, which puts Bitcoin at $28,561 or $36,805, respectively.
Price Levels To Watch (Bears) – Like the bullish price level, watch for a return and close above $25,000 for a likely end to further downside pressure. A weekly close around the $19,000 level could indicate a potential move towards the $13,500 – $16,000 range.
Again, you’ve got an approach and analysis style mixed with staunch, hard, static rules combined with some dynamic and flexible interpretation; you’ve got a recipe for differences of opinion and outlook. 💎