Let’s get one thing straight right away: there’s a stupid amount of chart patterns in technical analysis. A stupid amount. Japanese Candlesticks have over 200+ patterns – that’s just candlesticks.
And then you get into other chart patterns that require gaps or certain geometric formations like diamonds, triangles, or rectangles. Hell, there’s a whole encyclopedia of chart patterns (Encyclopedia of Chart Patterns) by Thomas Bulkowski that is almost 1,000 pages long and highlights 60-ish various patterns – not including all the subpatterns!
And that’s just with American bar charts or Japanese candlestick charts!
So it’s can be a little daunting and overwhelming.
If you filter out patterns that are redundant, stupid, rare, once-in-a-blue-moon, statistically poor performing, and ridiculous, you are left with only a handful of simple-to-spot patterns that are worth their salt.
And one of the best of the best is a reversal pattern known as the Wedge Pattern.
First, let’s take a look at what a wedge looks like:
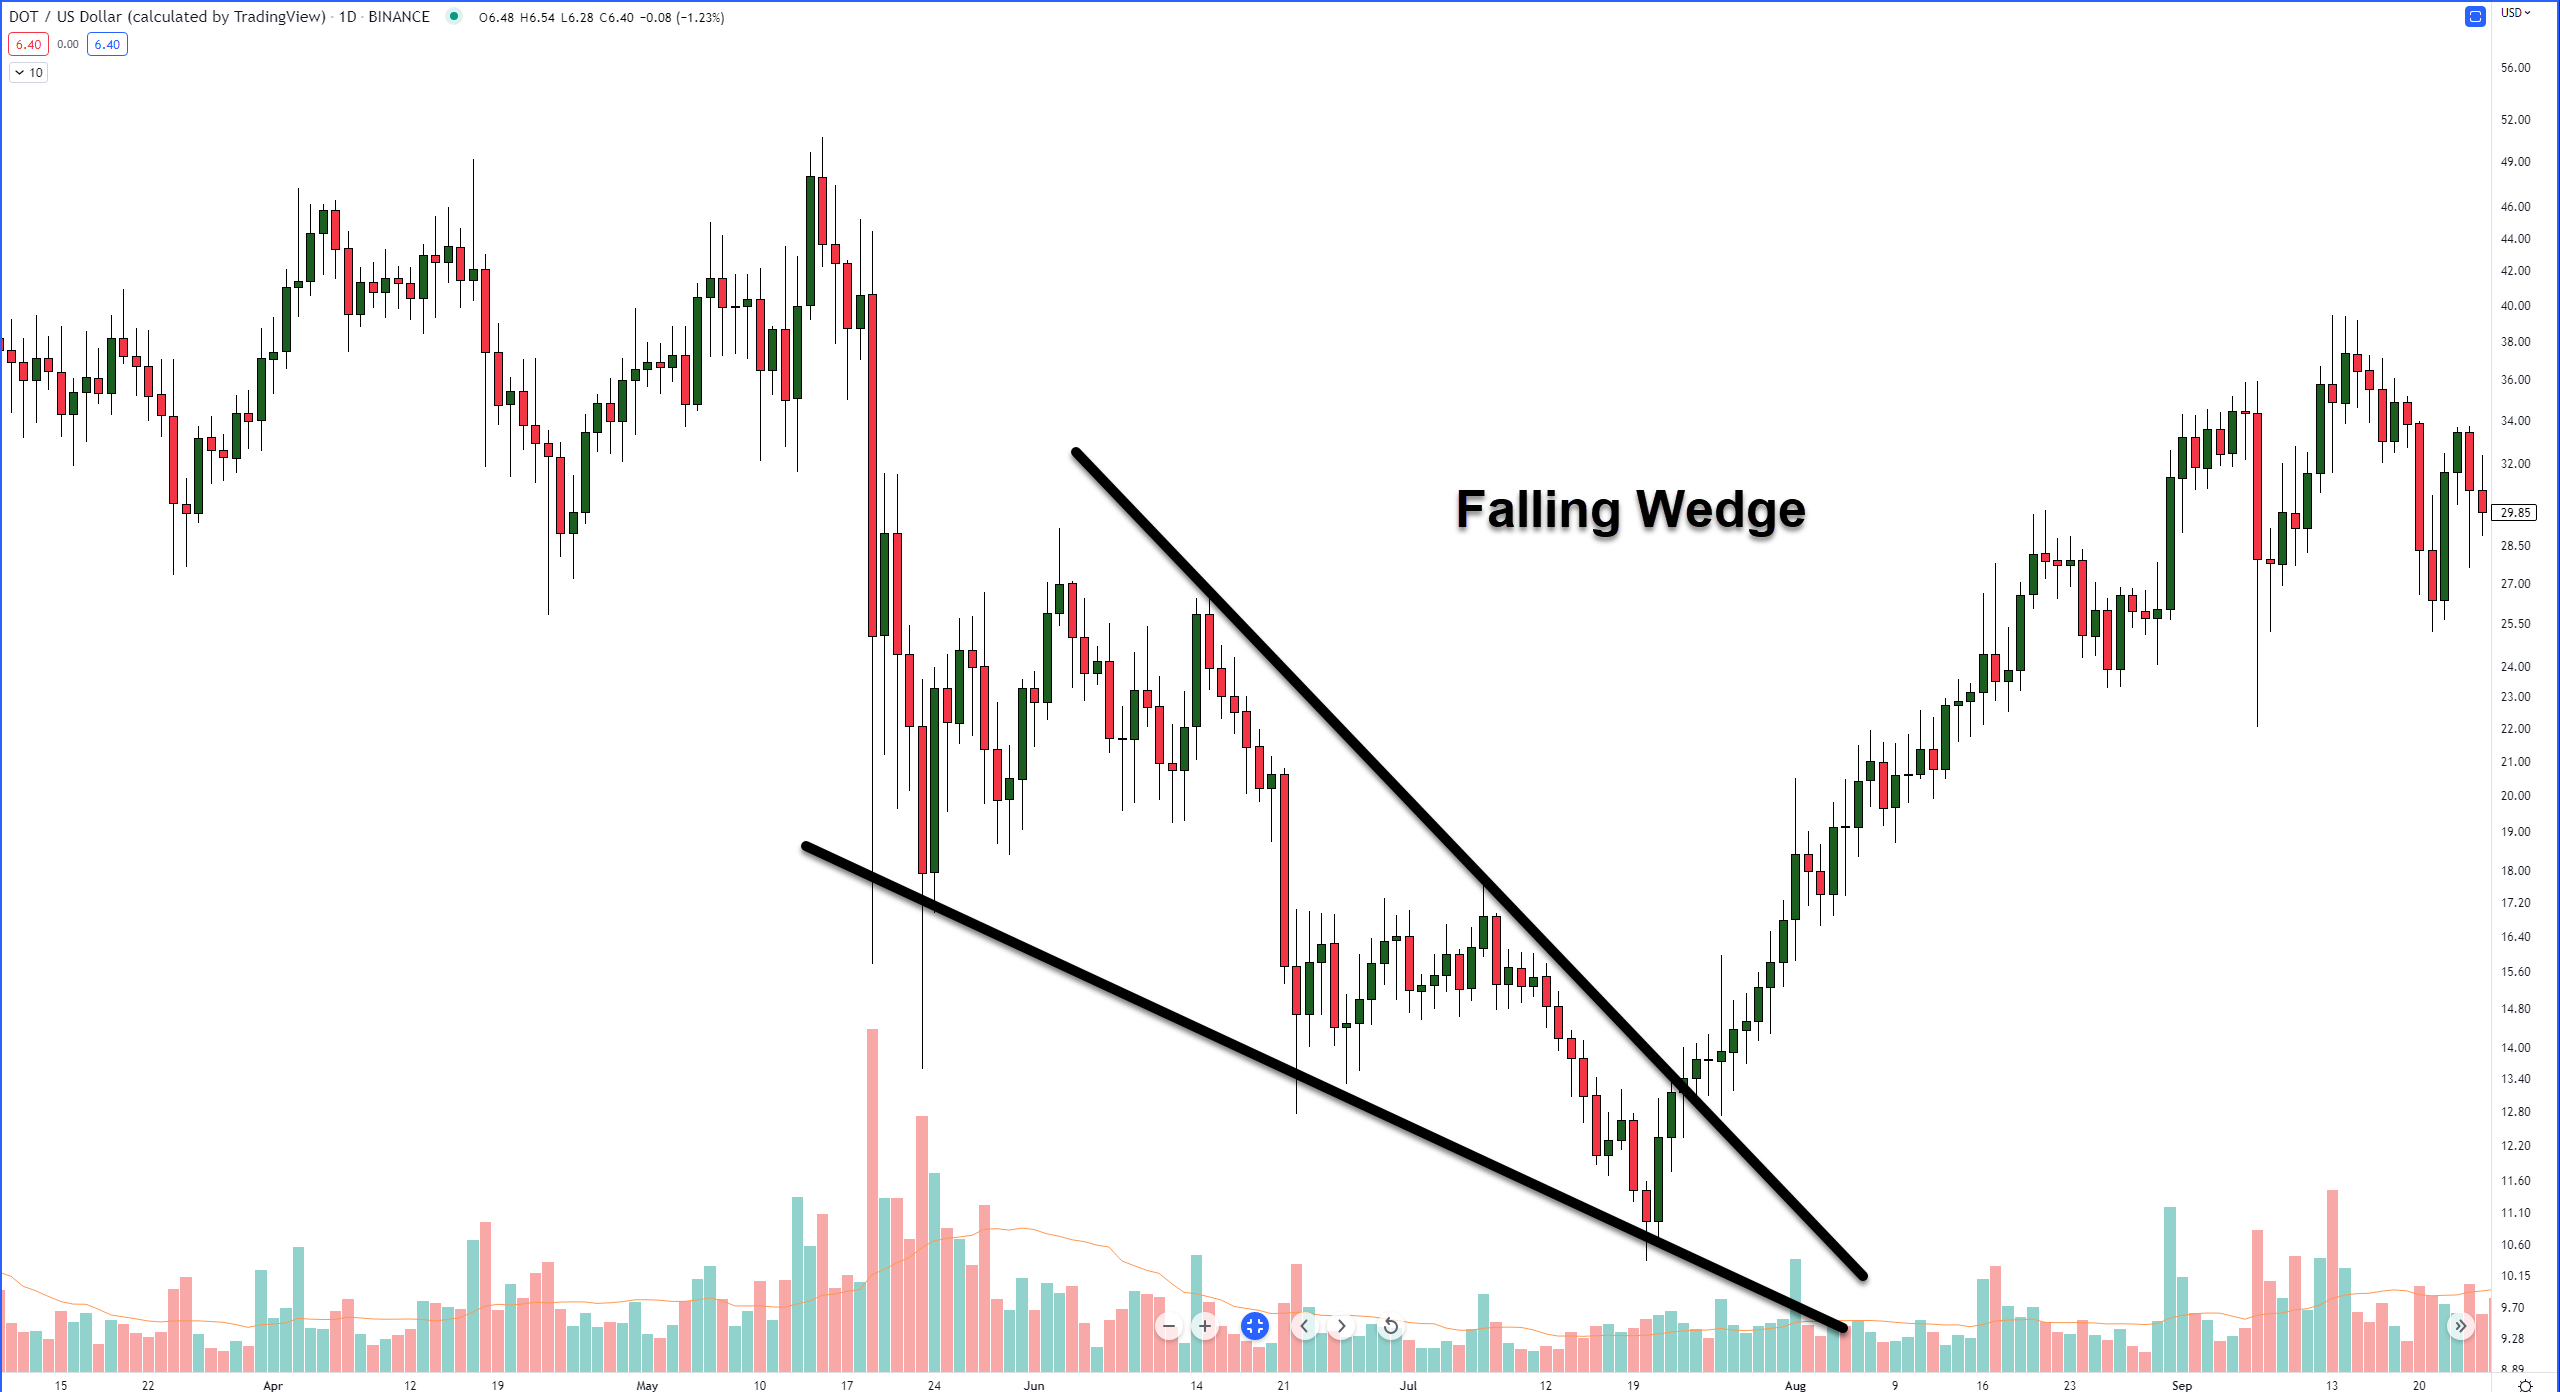
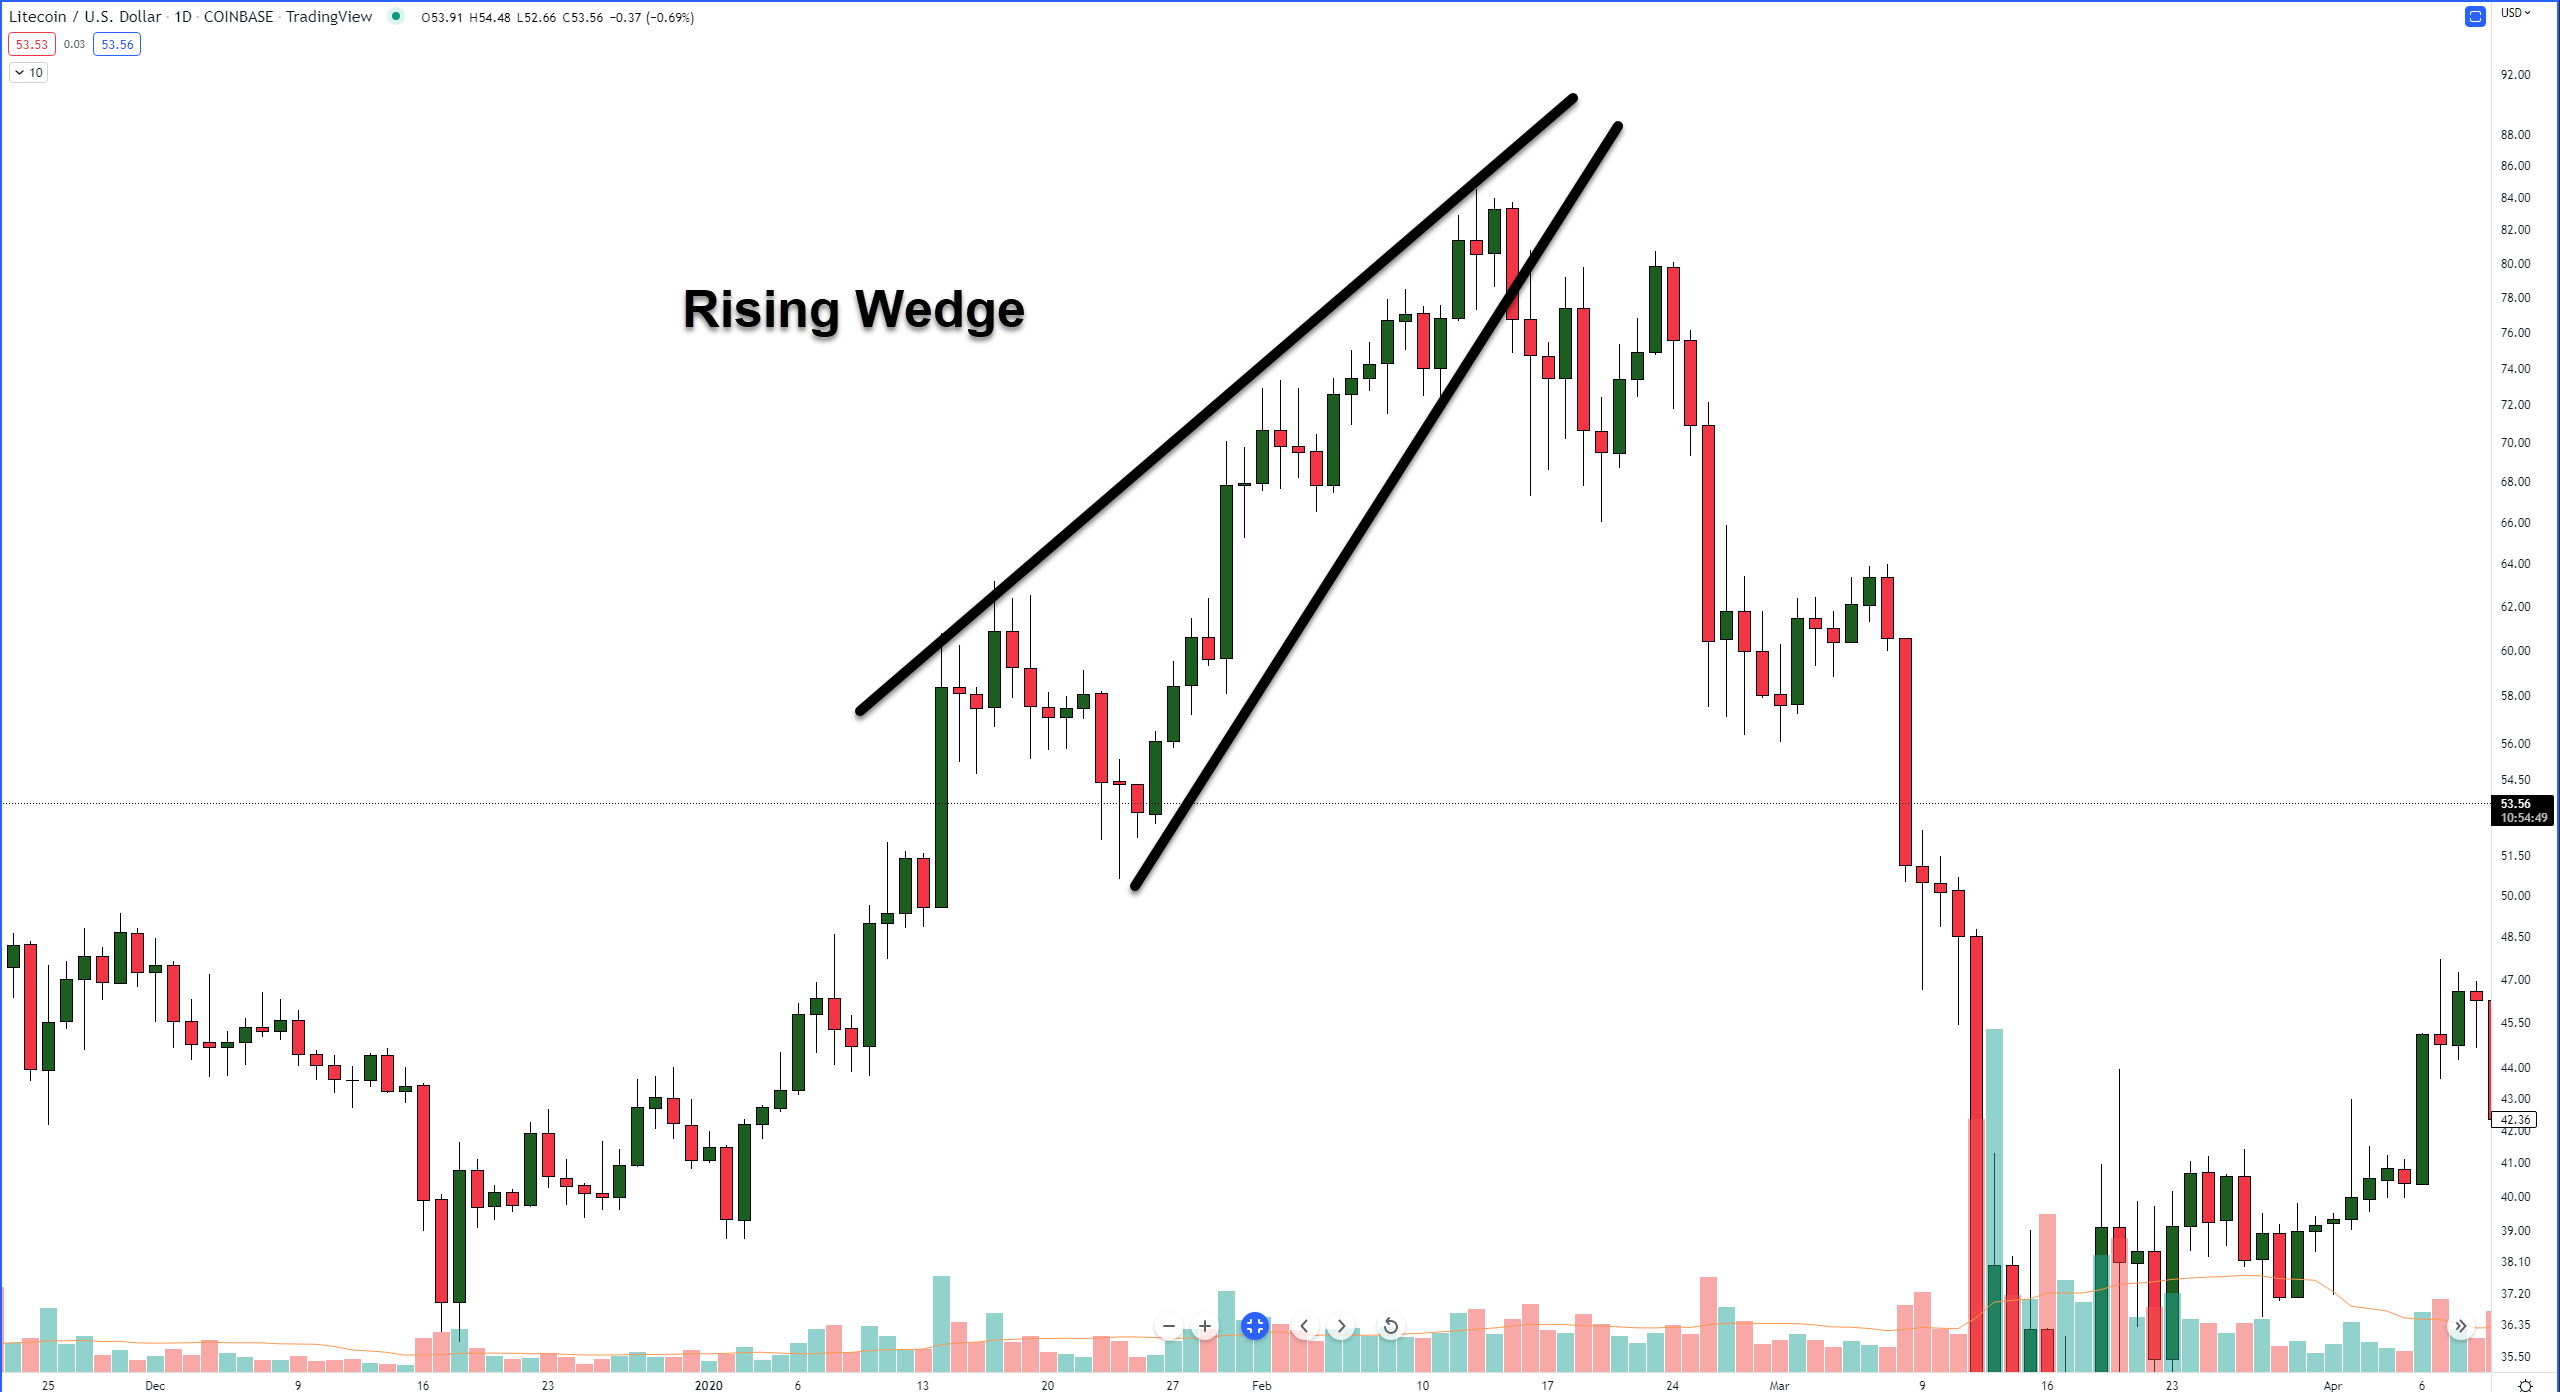
There are two types of wedges: a falling wedge and a rising wedge. And some people might be confused by this, but a falling wedge pattern is bullish, and a rising wedge pattern is bearish.
Wedges represent extremes. They represent something that is overextended. Ever looked at a chart and said, ‘omg it can’t keep going higher/lower, can it? This is stupid!!!’. Wedges are a perfect representation of something that has moved too far too fast.
Out of the basic chart patterns of rectangles, triangles, and wedges, wedges are second to none in performance. They have a low failure rate – which means, for example, that a rising wedge will very rarely result in price continuing to move higher.
How Analysts/Traders Use The Wedge Pattern
Pick up any Technical Analysis 101 book and read about wedge patterns, and you’ll see there are some differences and similarities to the ‘rules’ that apply to a rising wedge. Some analysts believe the trendlines must be ‘touched’ at least four to five times, some analysts believe volume must be used to confirm the pattern.
I prefer to keep things simple. If it looks like a wedge, it probably is a wedge. If you are drawing trendlines to try and force it to be a wedge, then it probably isn’t one.
When it comes to executing a trade with a wedge pattern, the rules and criteria can be varied as well. However, the most common approach is to watch for 50% of the range and a break above/below the start of the wedge.
It looks like this:
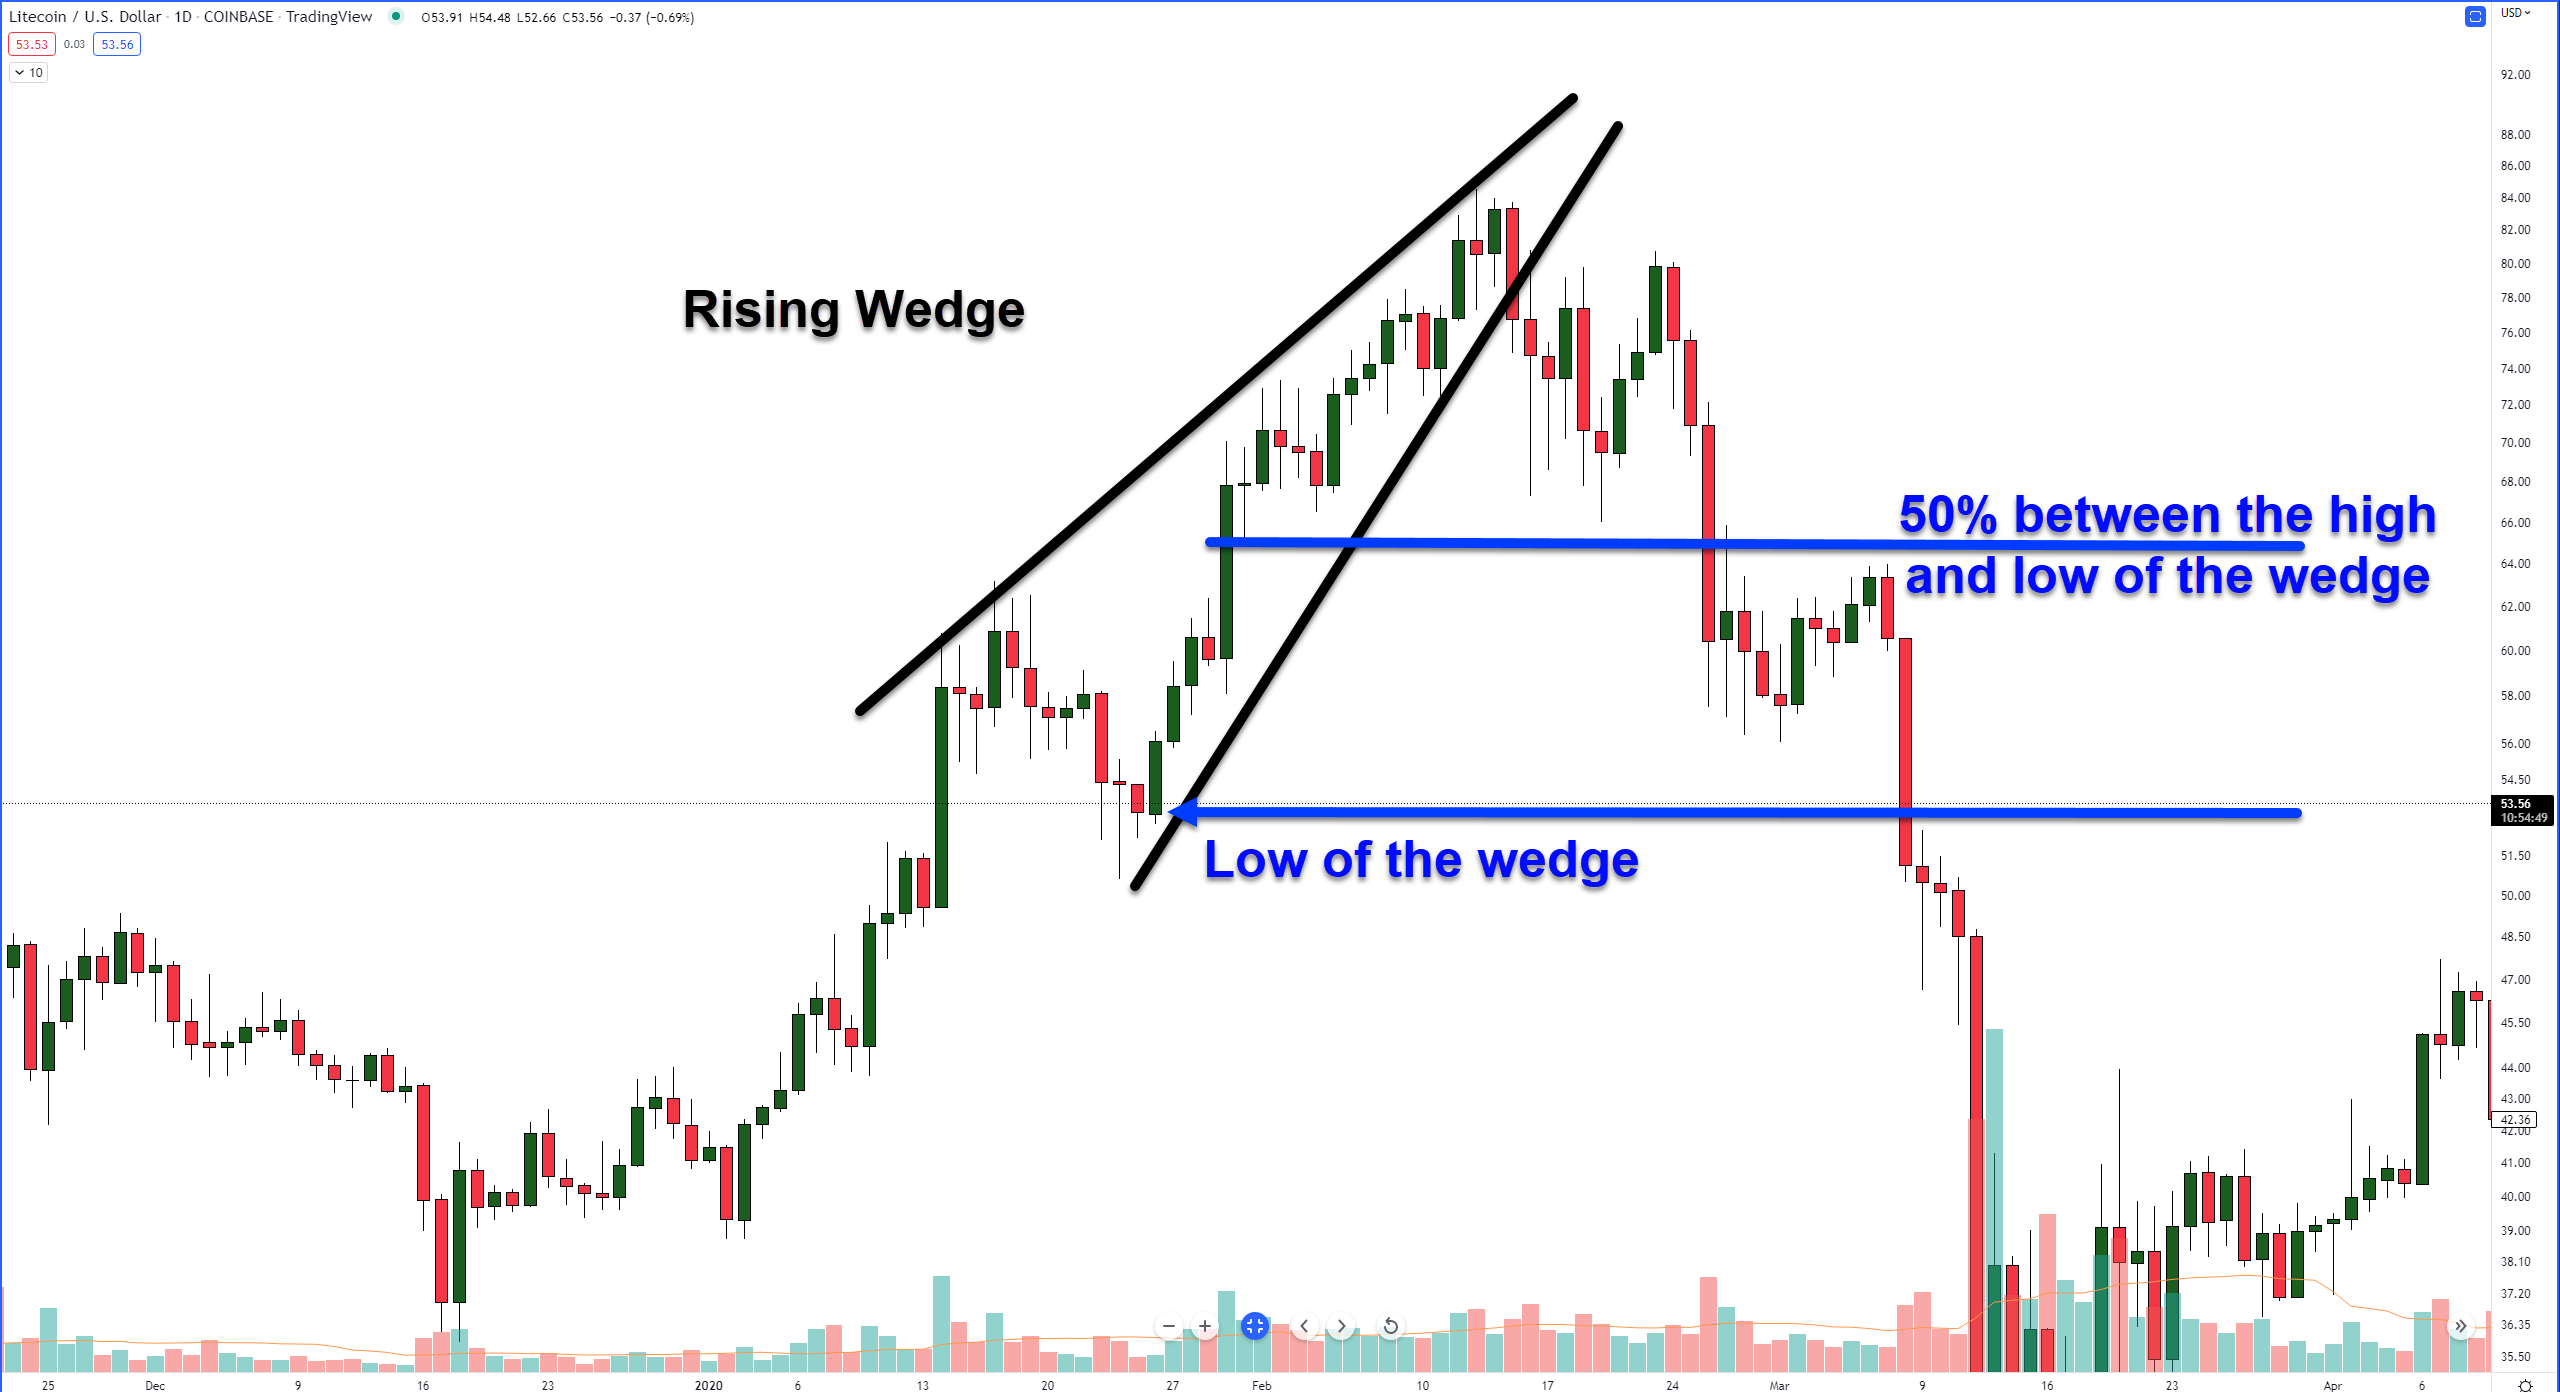
You can see for yourself how price action reacted after the 50% level and the low of the wedge were broken. Looks easy, right? WRONG. All of the examples in this article were cherry-picked to represent good examples for educational purposes.
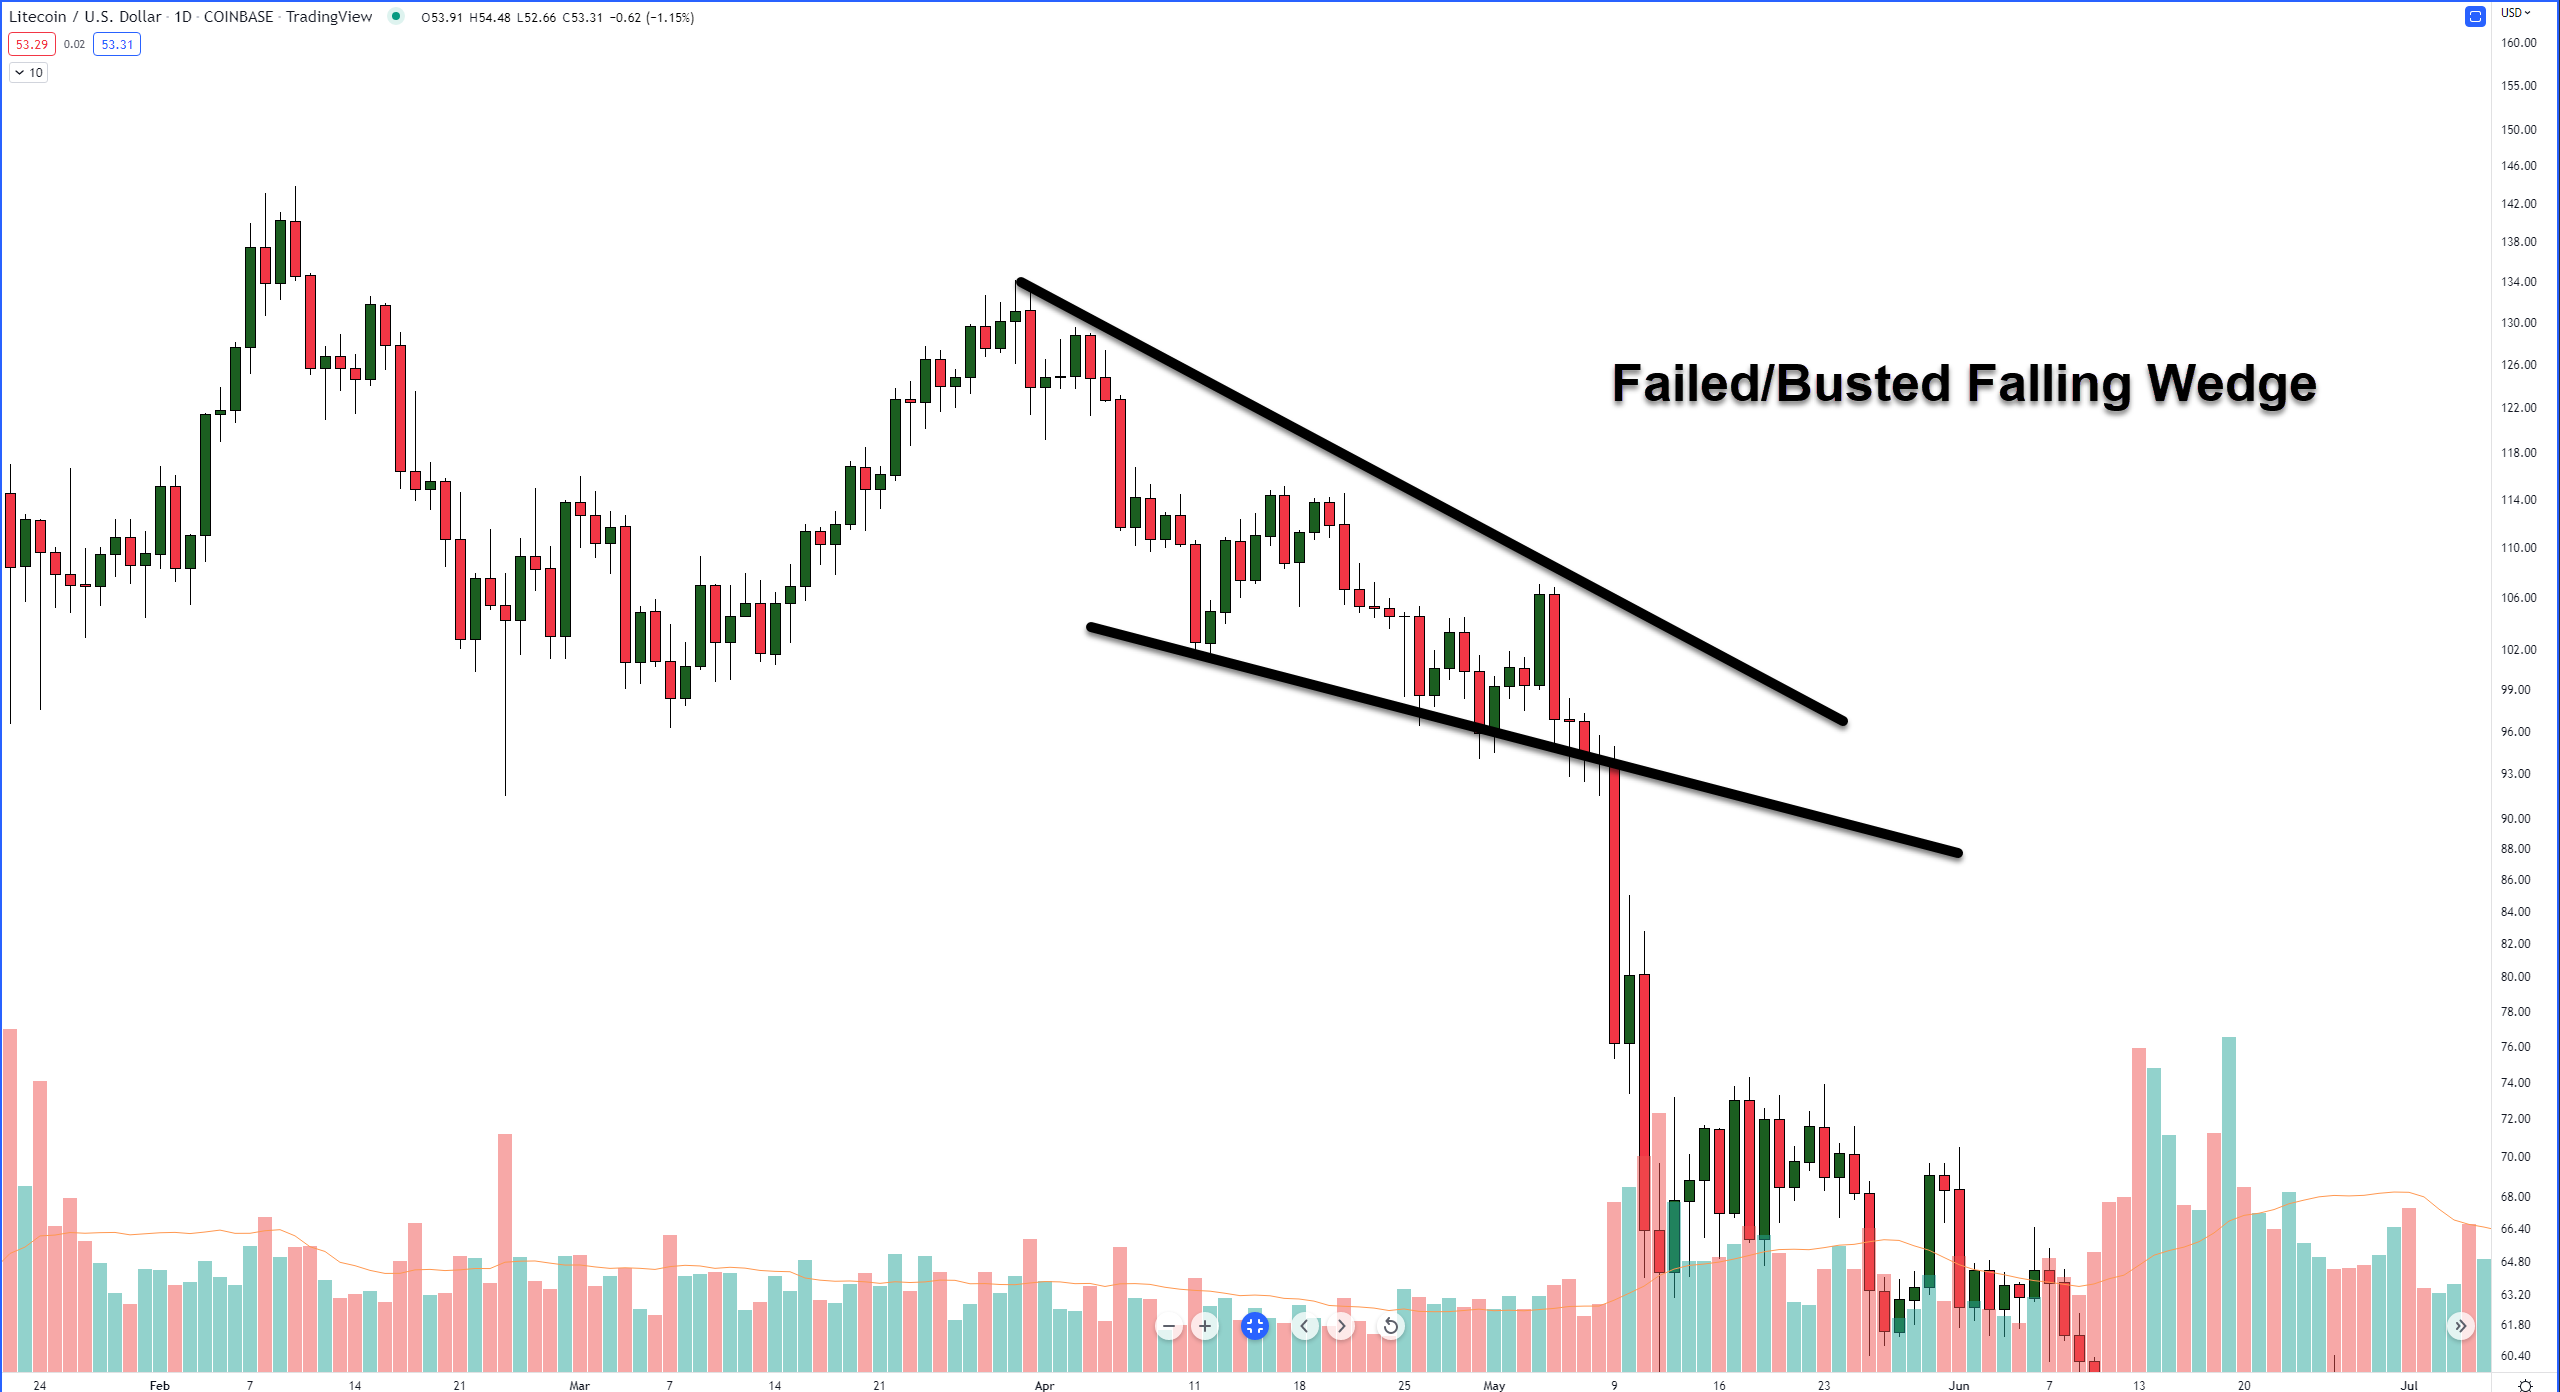
Failed/Busted Wedge Patterns
Hindsight is 20/20, as they say, so do some looking around and observation before you do anything silly like risk money on a chart pattern that you just learned about.
Wedges can fail, too. A rising wedge can instead turn into something called a failed or busted pattern – which means price didn’t move in an expected way. In the event of a rising or falling wedge moving to the inverse of what is ‘expected’, the rejection can often be substantial.
Nothing in financial markets is 100%, or, hell, sometimes it feels like it isn’t even 50%. Markets, especially crypto, are extremely volatile, and if you don’t know what you are doing – don’t throw money at something you can’t afford to lose!