Bitcoin
We’ll keep this short and sweet because it’s more of an update to the charts in the November 9 Technically Speaking article.
On Wednesday, analysts were observing the failed test of the breakout above the triangle on Bitcoin’s chart. Analysts are now looking at an area near yesterday’s high near the $18,00 value area.
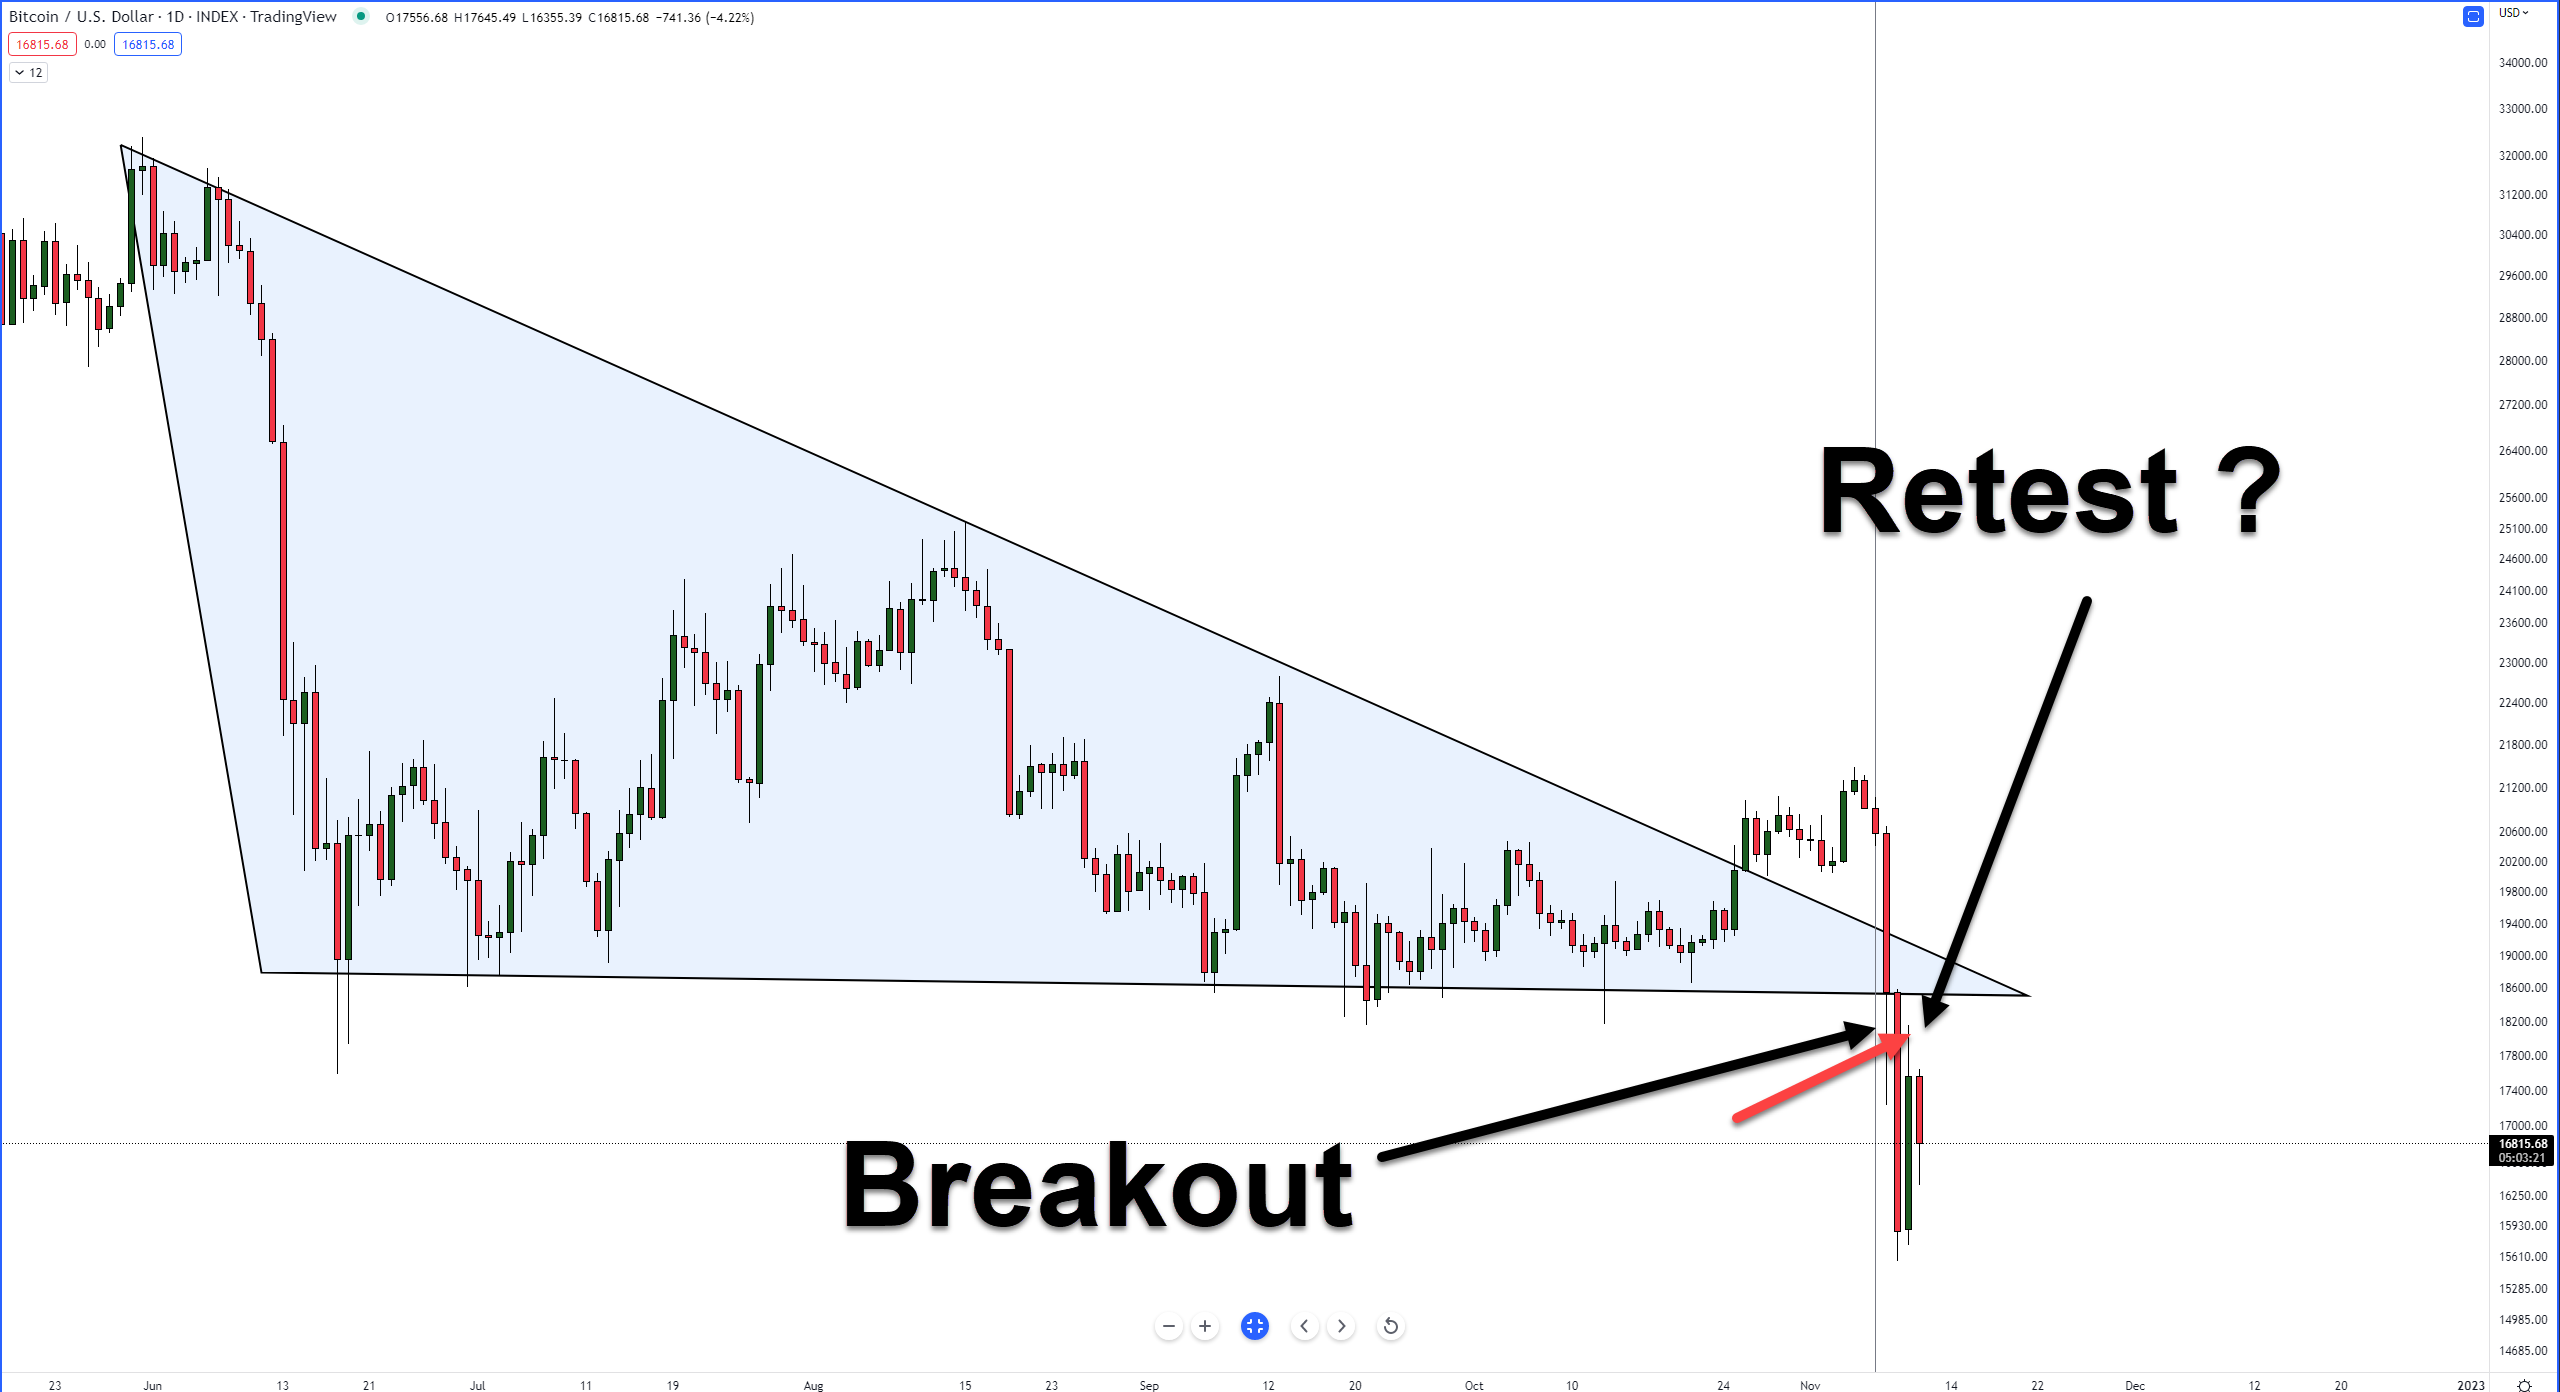
Why? Because for some analysts, the criteria for a retest of the breakout below the triangle has been completed. And unless something drastic changes, the failure of bulls to prop up BTC’s price could signal another round of selling, likely towards the $11,000 range.
Ethereum
The same thing with Bitcoin; analysts are looking at the broken trendline on Ethereum’s ($ETH.X) monthly chart.
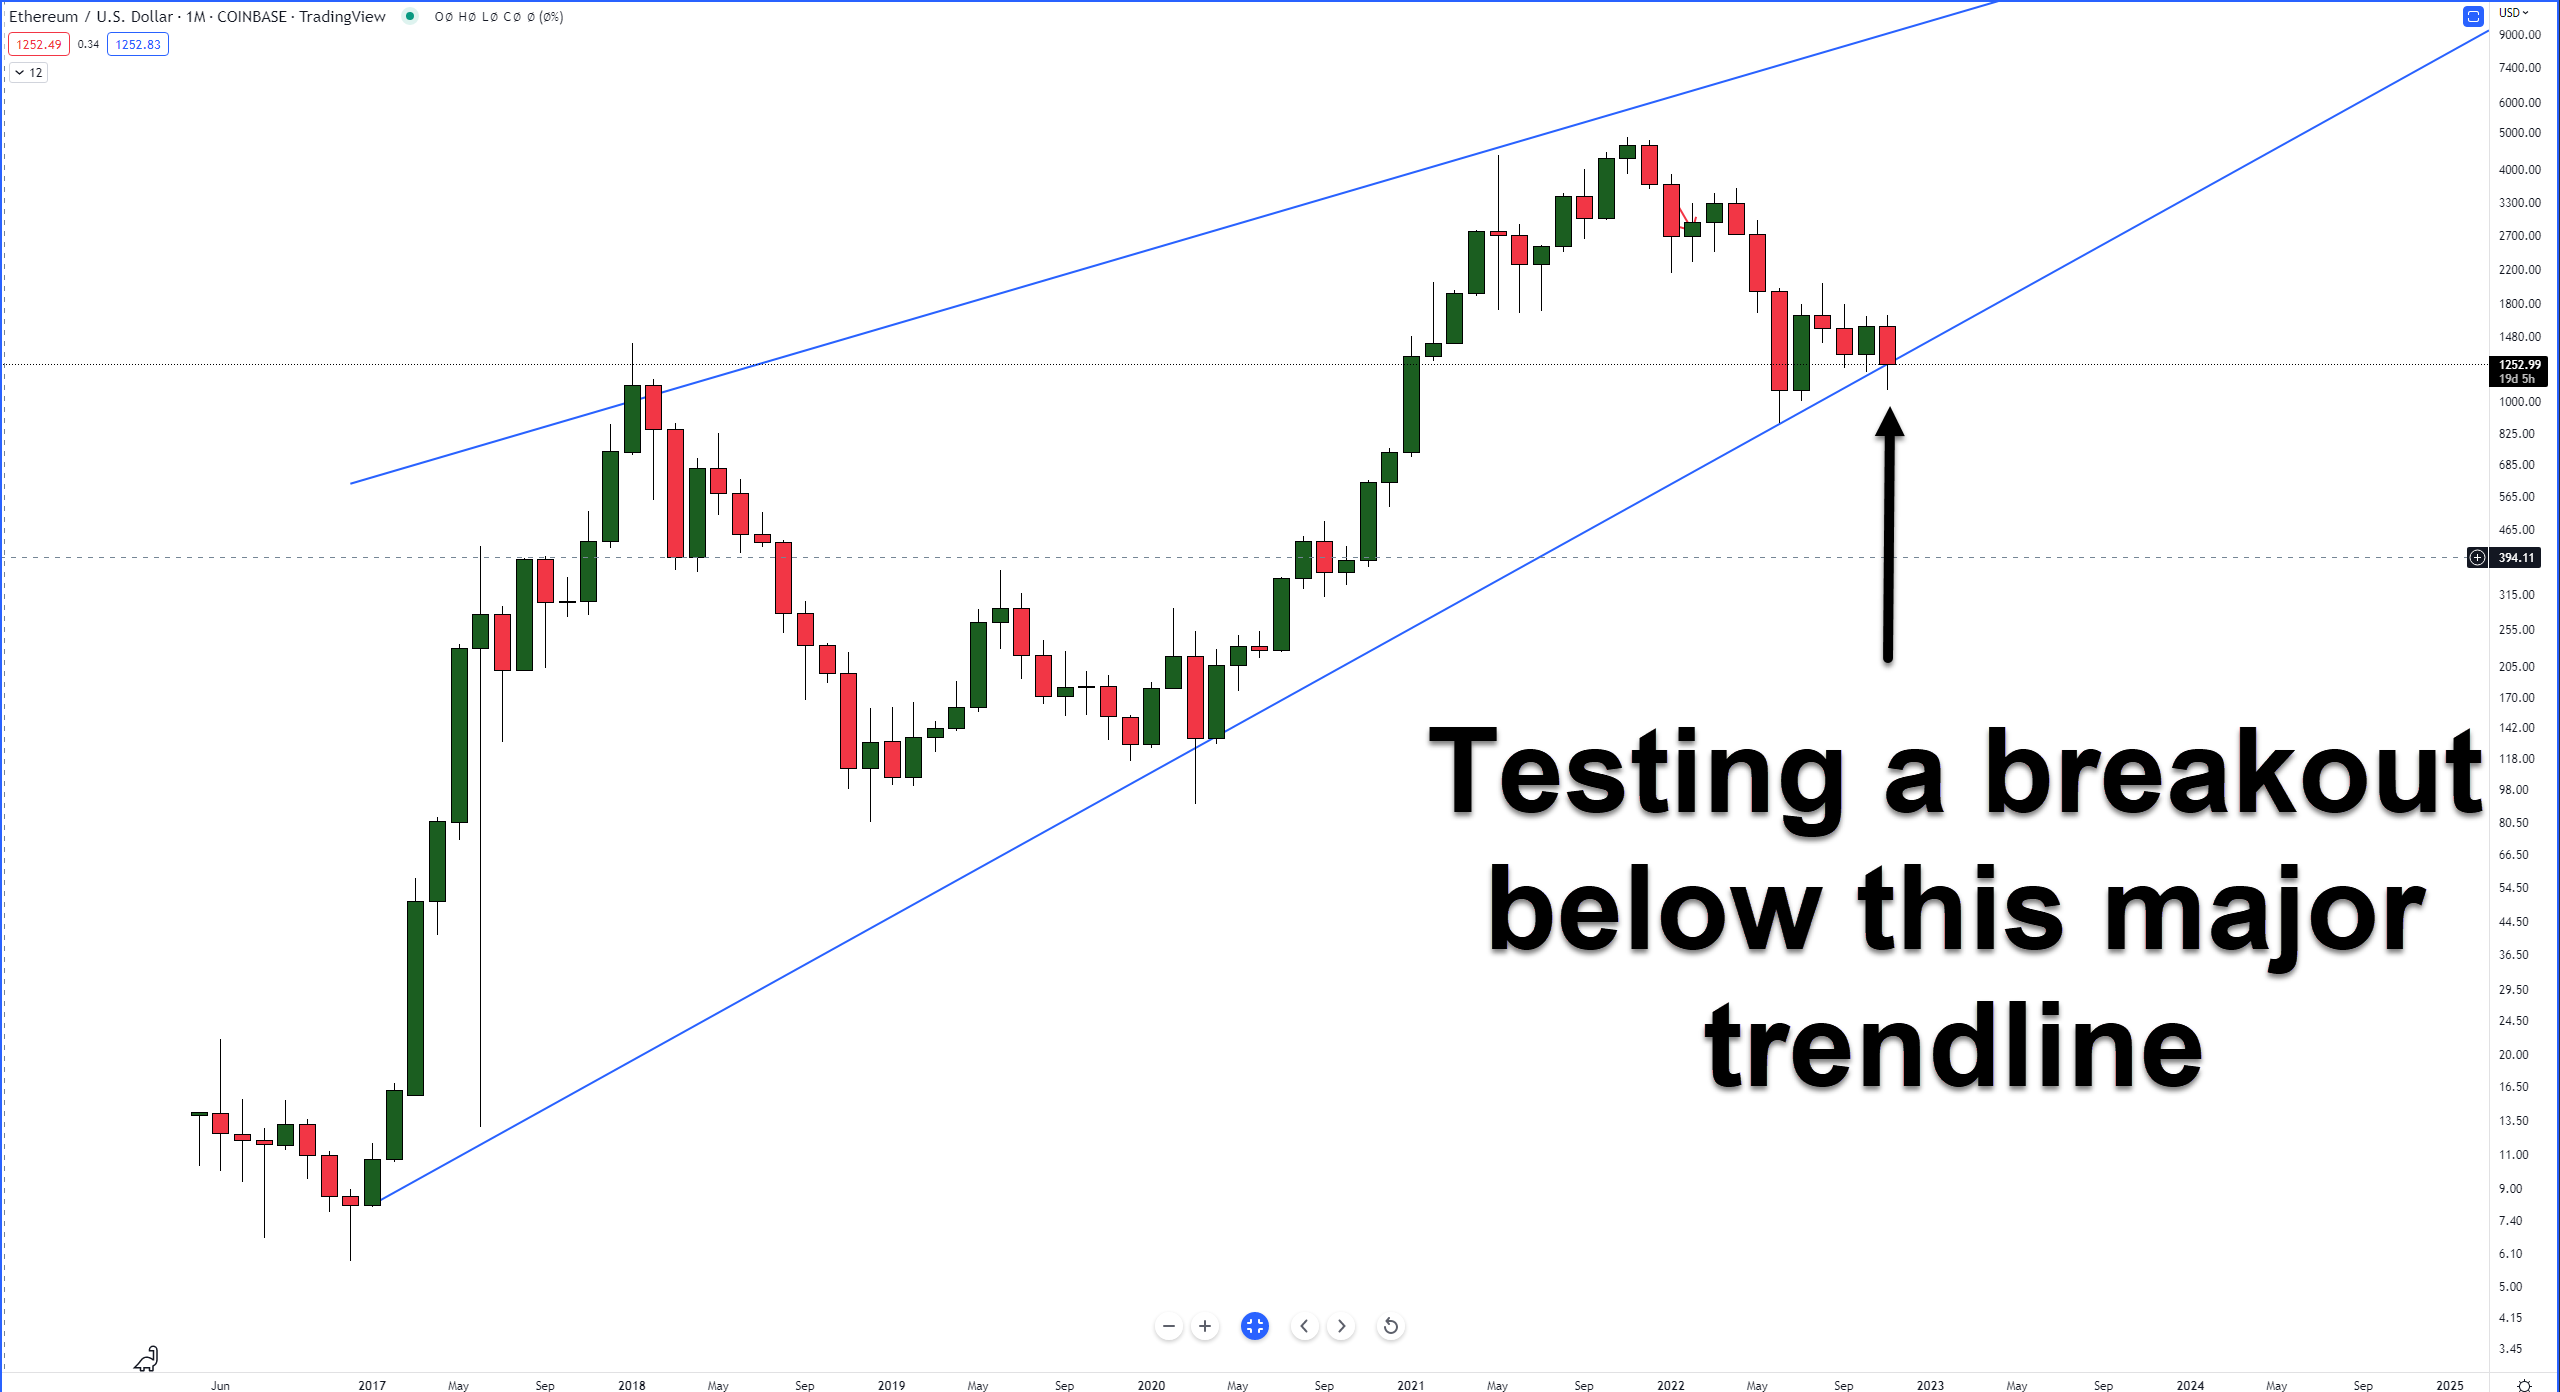
At the time of writing, it shows that bears have made multiple drives below the trendline, but analysts believe there are signs of bulls defining that trend line. There’s plenty of November left, though, so we’ll keep a close eye on it.
Traders anticipate a move below the $1,000 value area if the trend line fails to hold as support. 📈