This is what is going through many analysts, traders, and investors’ brains today:
OMG, is it going to crash? Will it? Won’t it? Will it? Won’t it? 😱
Price action is choppy, and it’s giving bulls and bears alike some angst, especially when there are strong bullish and bearish warning signs all over the place.
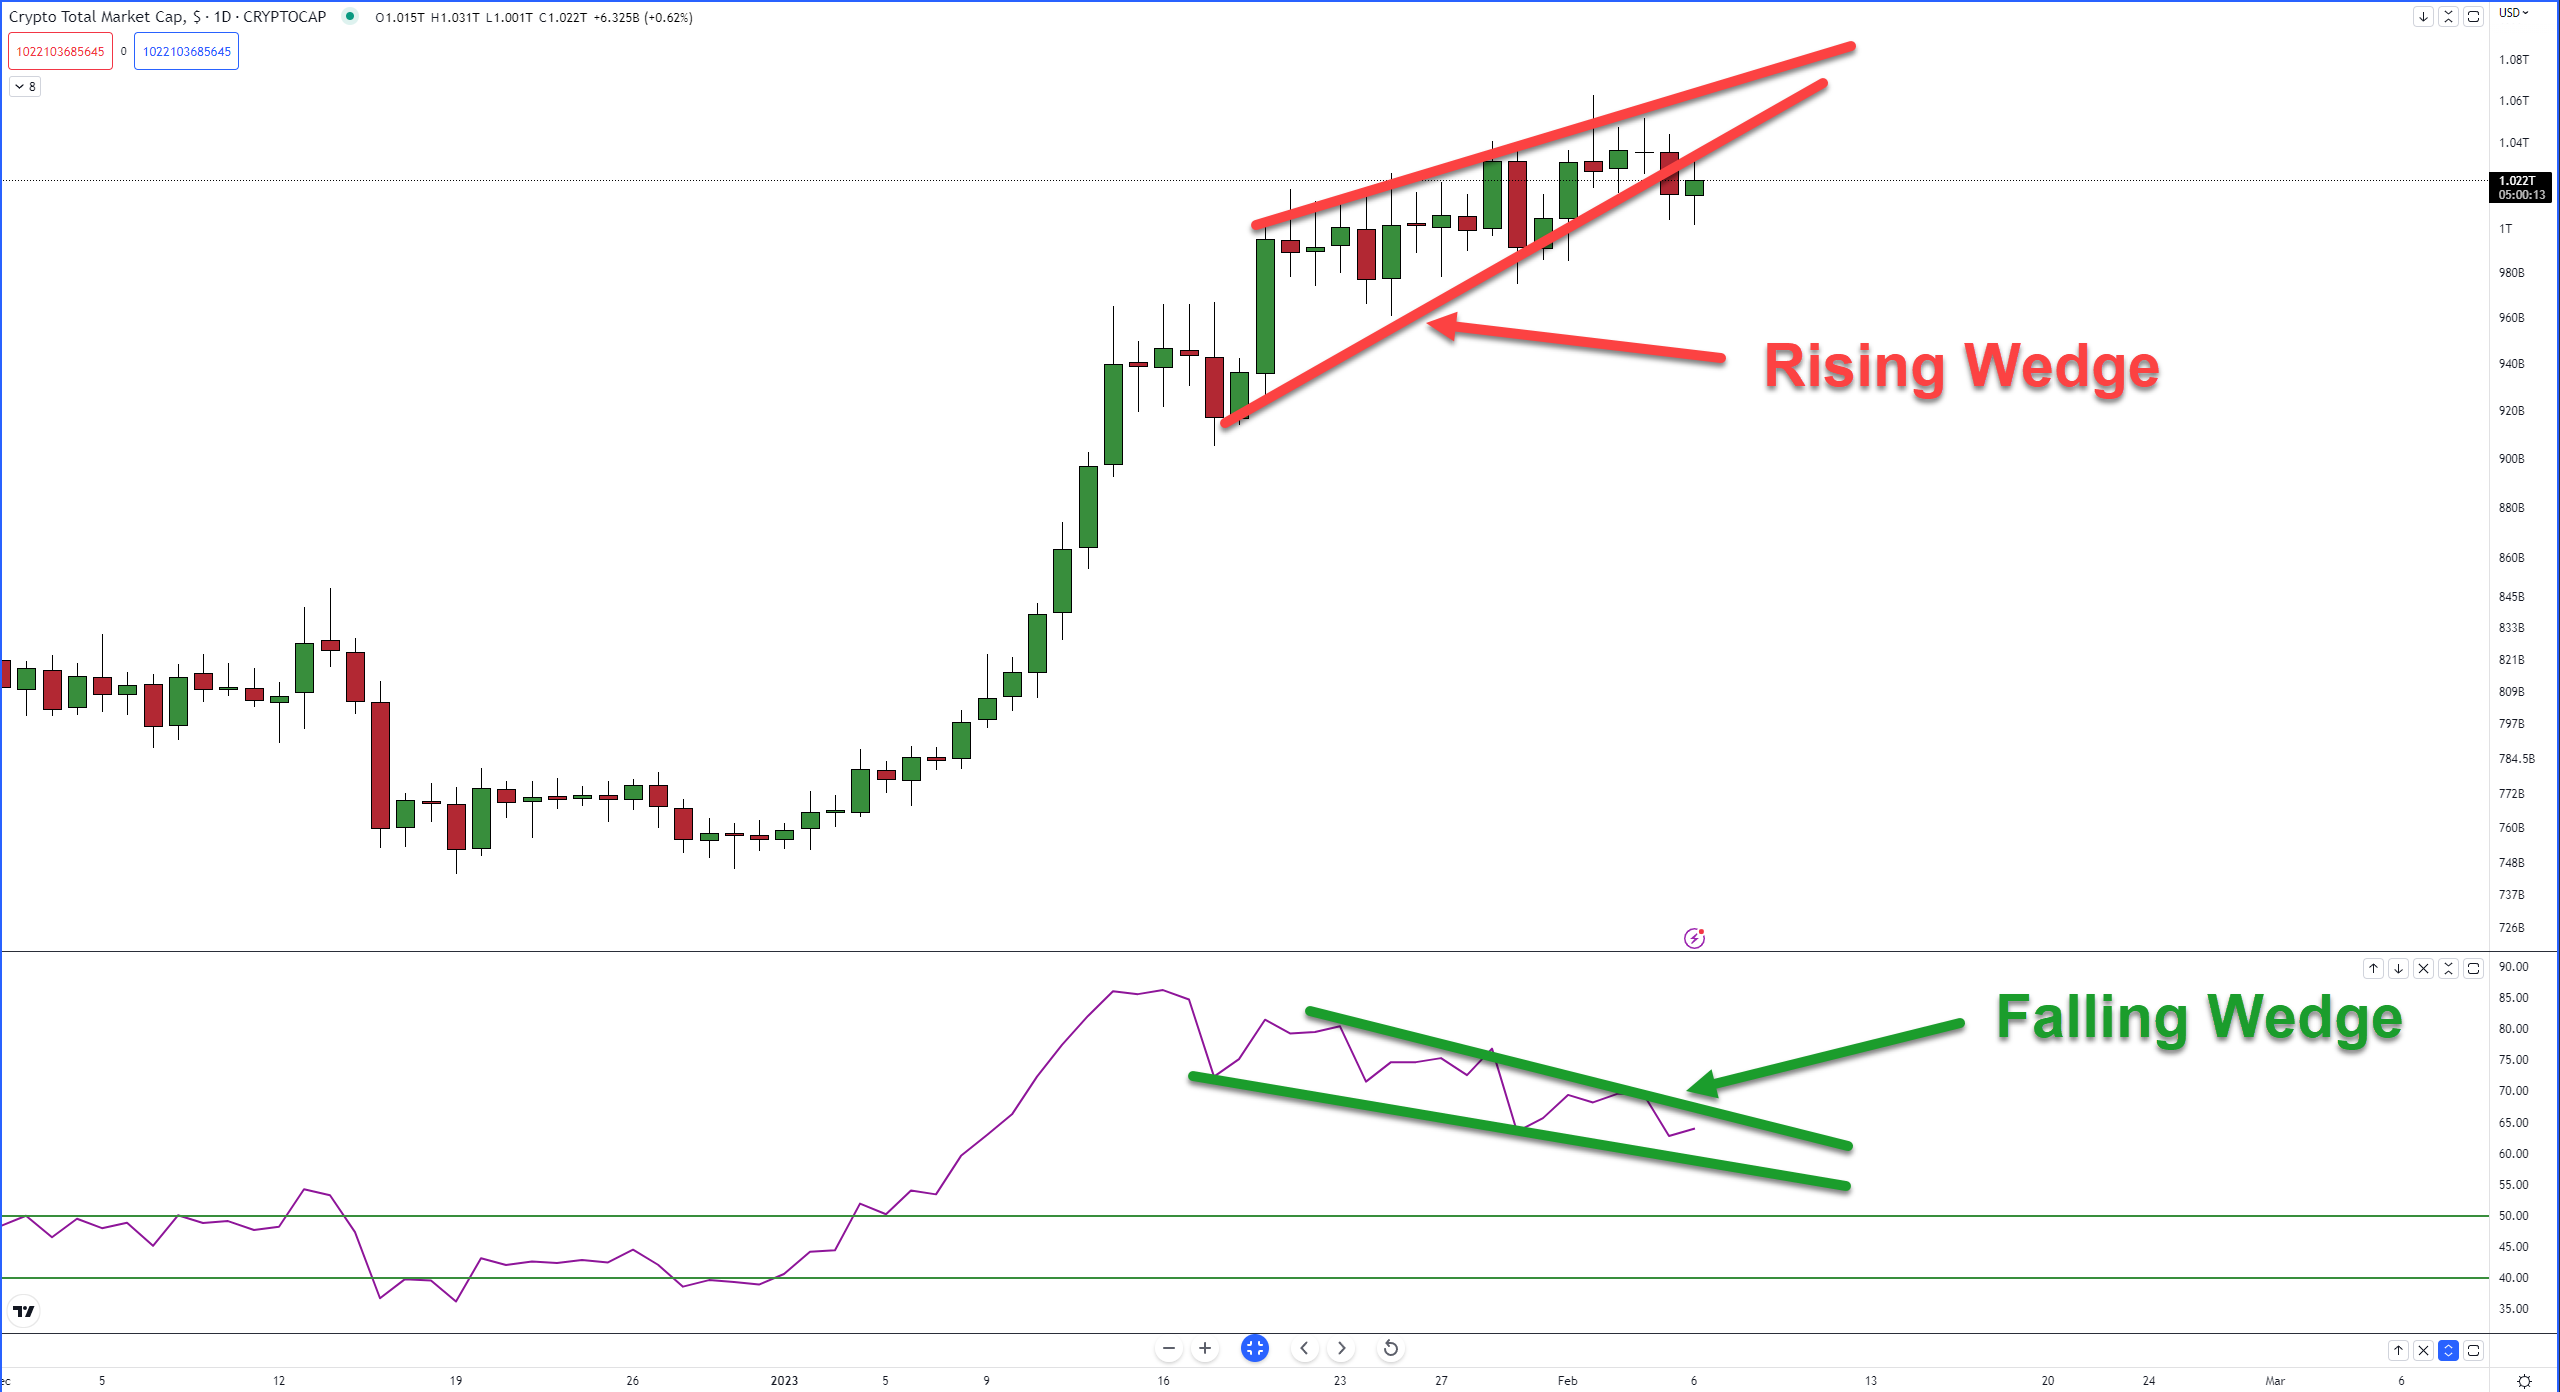
Case in point: The wedge patterns on the Total Crypto Market Cap chart.
What The Bears See
Greedy bears see a rising wedge pattern and are probably frothing at the mouth. It is a bearish pattern, but it’s not that bearish.
According to Thomas Bulkowski (author of The Encylopedia of Chart Patterns), rising wedge patterns are “… some of the worst performing chart patterns.”
He also notes, “Downward breakouts have unacceptably high failure rates and small post-breakout declines.”
In other words, a breakout lower has a high chance to fail, and even if it is successful, it sucks (for bears).
Based on over 1,400 perfect trades, Bulkowski ranks the Rising wedge as 32 out of 39 (39 is the worst) – so it’s pretty bad.
While the expected behavior is for price action to move lower (breakout lower 60% of the time) – it’s limited in size and scope. As a result, it acts as more of a type of bear trap.
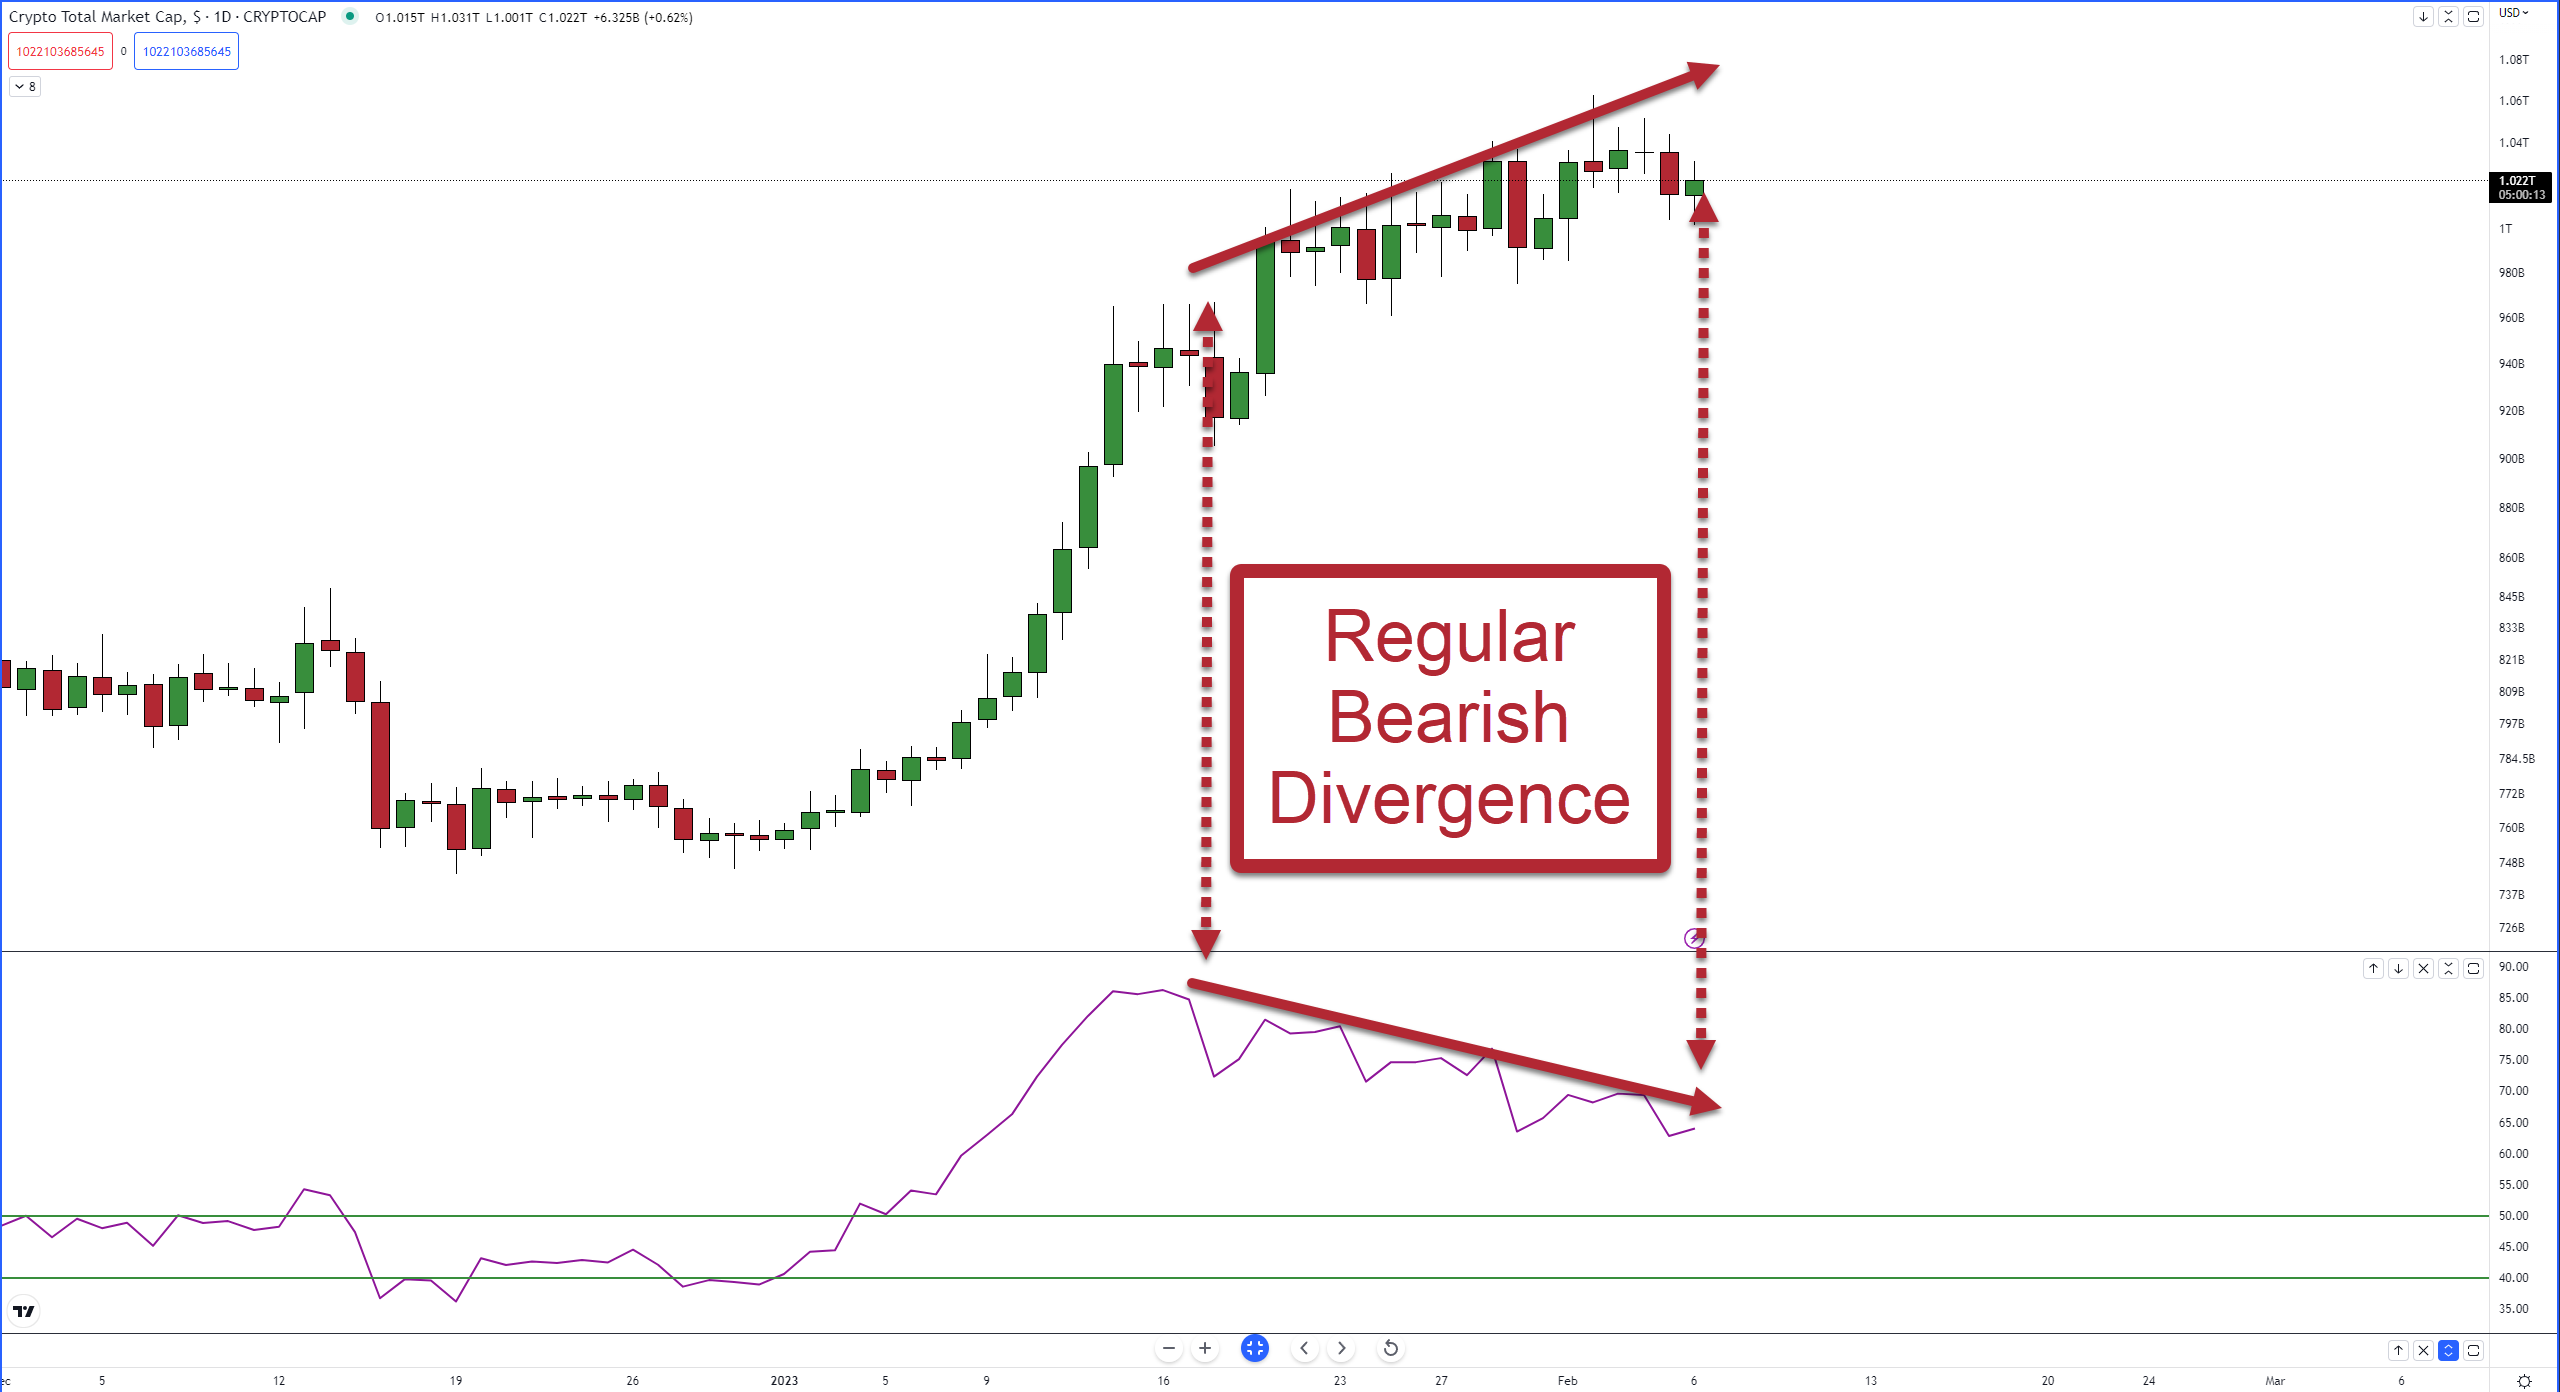
Analysts also observe regular bearish divergence occurring between the candlestick chart and the RSI – however, bears have been unwilling or unable to capitalize on that divergence. At least not yet. 🤔
What The Bulls See
The great trader and analyst Connie Brown (author of Technical Analysis for the Trading Professional, The 32nd Jewel, and others) stresses the importance of monitoring trendlines and patterns like wedges in oscillators.
For bulls, there is a falling wedge on the Relative Strength Index (RSI). Falling wedges are just the opposite of rising wedges. Bulkowski ranks the falling wedge at 31, with an upwards breakout occurring 68% of the time.
Does that apply to the RSI? No idea – Bulkowki’s work is done almost exclusively on stocks, so the performance of breakouts in an oscillator could be wildly different or even the same; it sounds like a fun thing to research for someone who isn’t me.
Bullish analysts do see one very positive development, however.
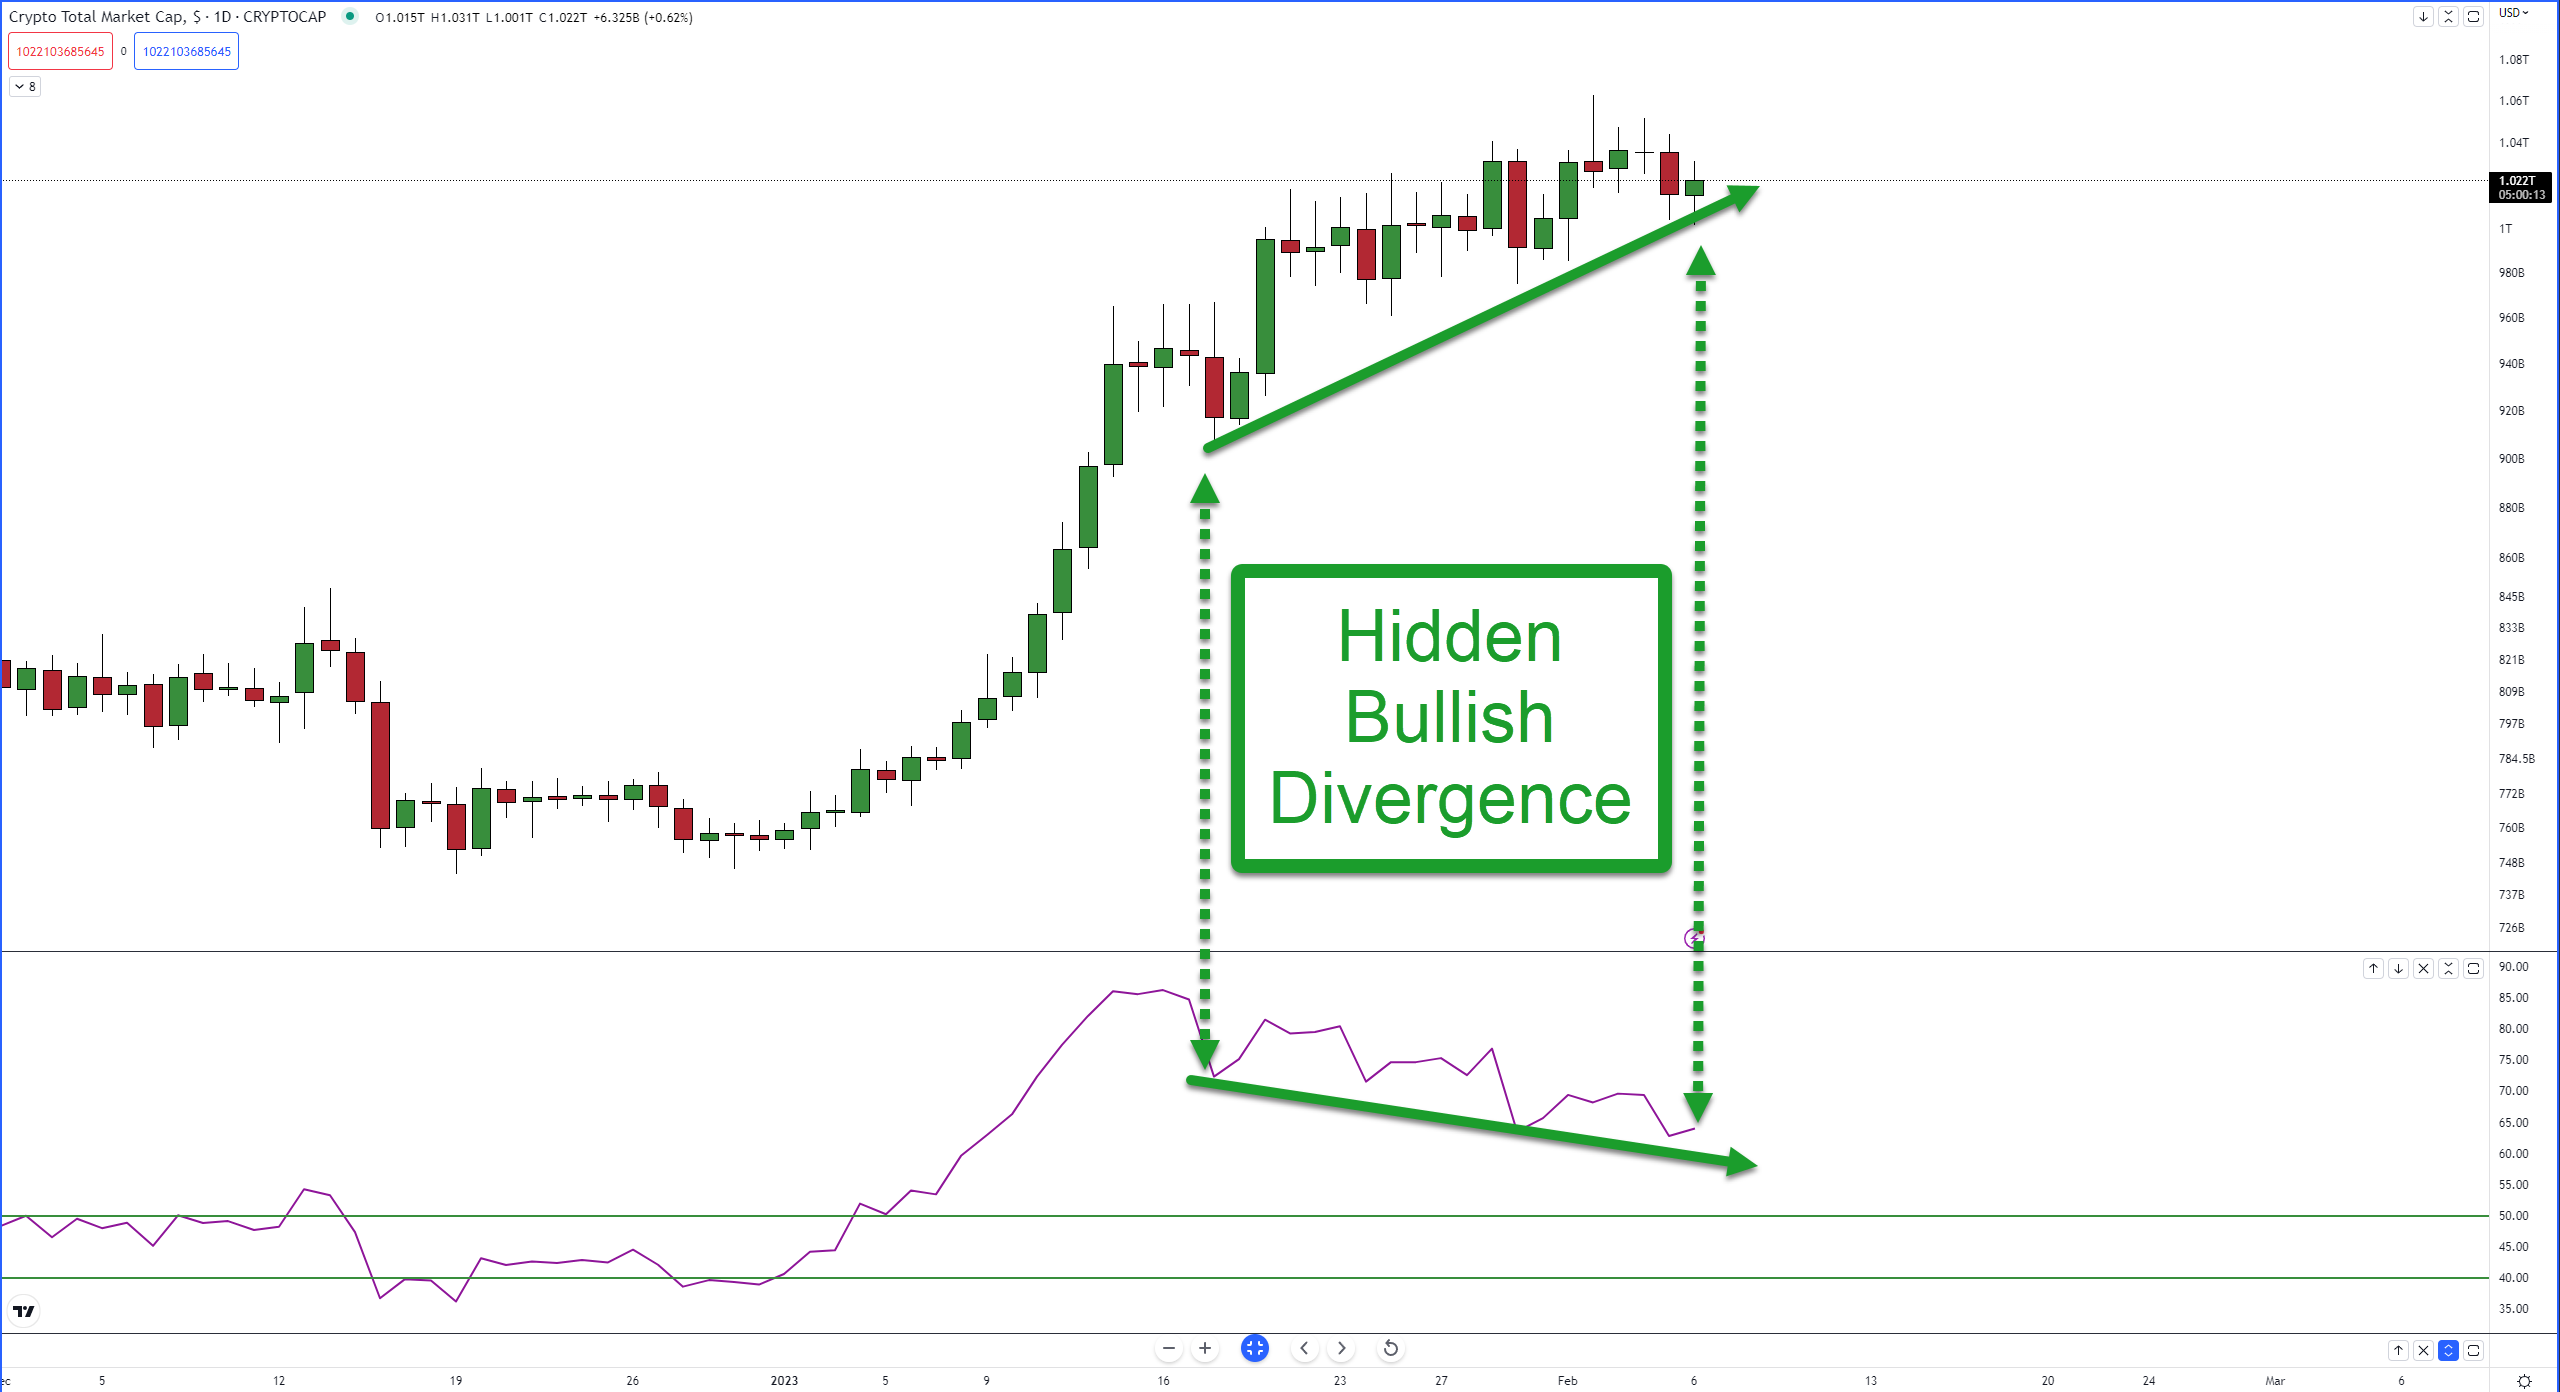
Hidden bullish divergence is a powerful warning sign that the current downswing is at threat of terminating and that a prior up trend will likely continue.
But there’s the keyword: trend. Hidden bullish divergence is only valid if the last move was bullish. 🗝️
Whether crypto is in a bull market or a bear market is an argument analysts, traders, and investors have made ad nauseam.
A quick note about the wedge patterns
In Technical Analysis, almost all pattern research studies are done using the stock market. However, performance ratios differ in markets like Forex, which are considered more range bound. So should we expect to see the same behavior in crypto?
Hard to know – there hasn’t been much professional research on chart pattern performance in crypto. Crypto certainly appears to be more of a trending style market like stocks, but we’ll have to wait until there’s more research done before finding an answer.