Bitcoin’s monthly chart, from an Ichimoku perspective, is very interesting.
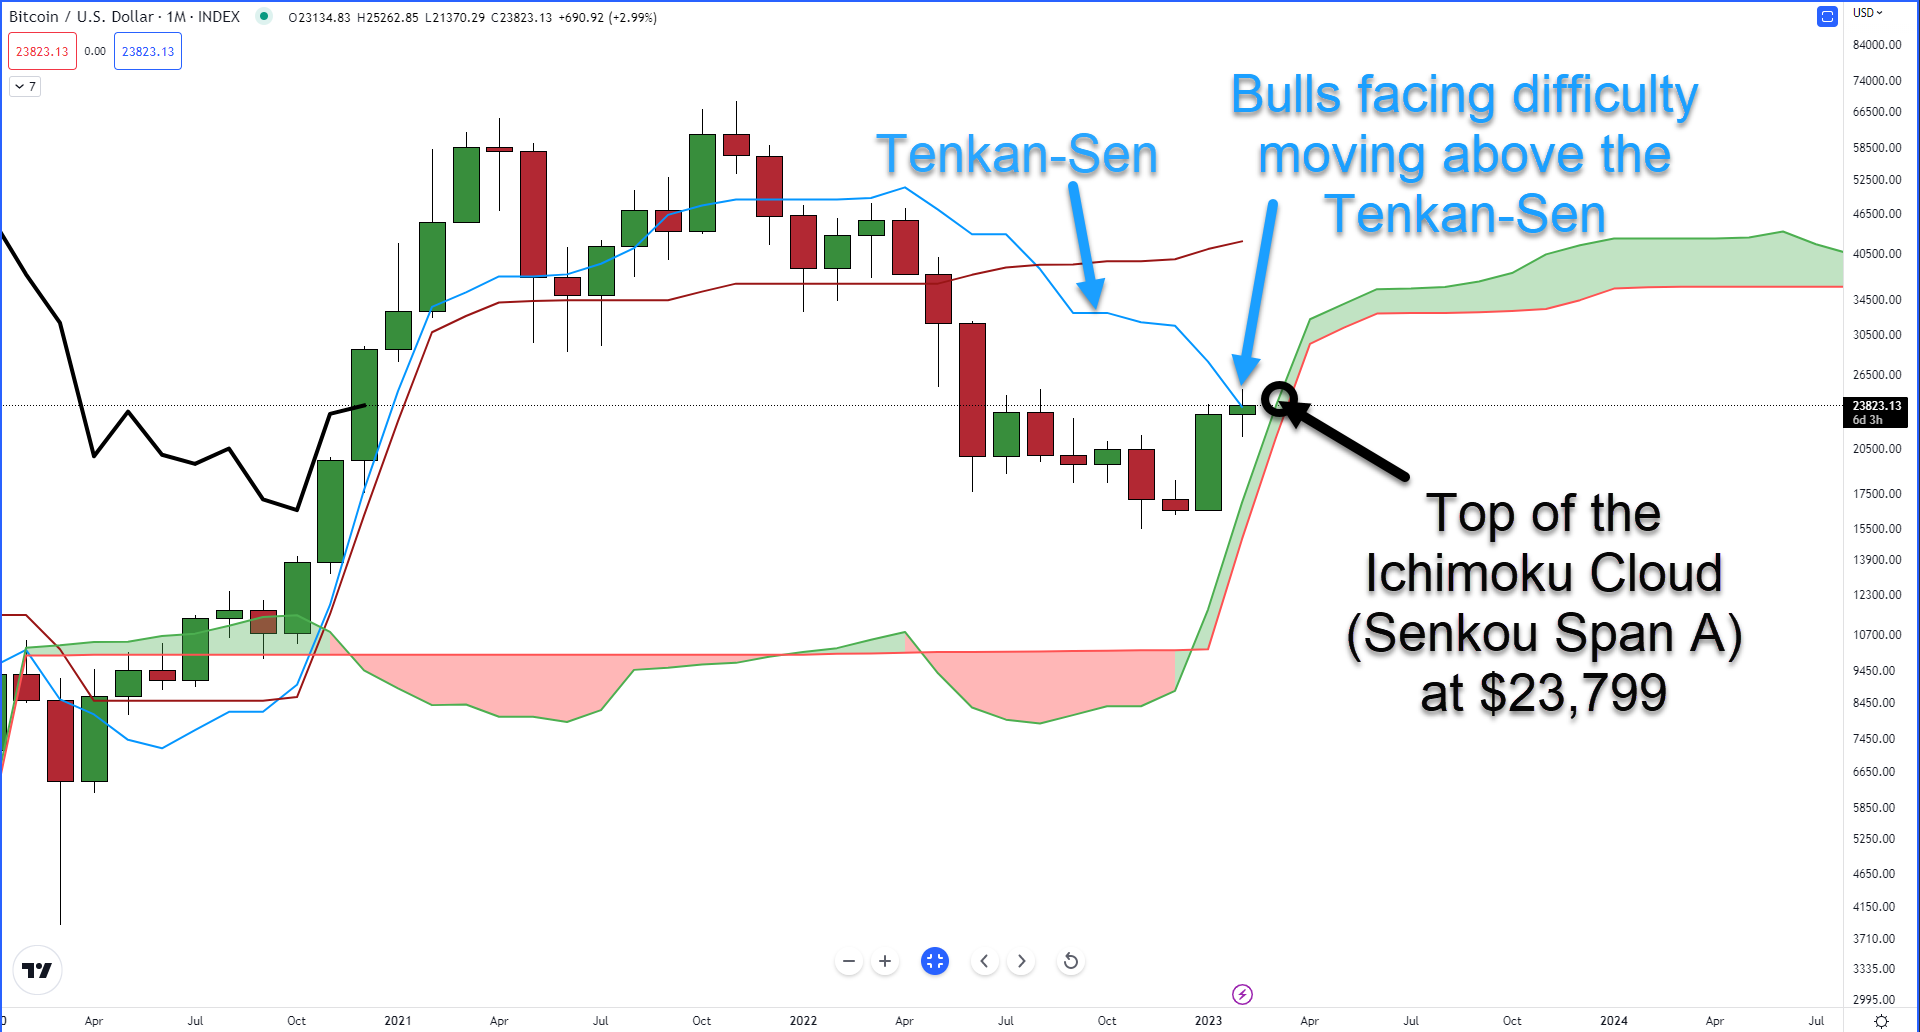
The first interesting piece of data is how difficult of a time bulls have had pushing and keeping $BTC‘s price above the Tenkan-Sen ($23,718).
Now, the Tenkan-Sen is a source of support/resistance, but the real function of the Tenkan-Sen is as a momentum indicator – with the slope determining the strength of that momentum.
So it makes sense that pushing prices above the Tenkan-Sen is theoretically difficult. However, at the time of writing, Bitcoin is above that level by about $100.
The second and most important piece of data is the price level that Bitcoin is at. Why? Because the top next month’s Cloud is at $23,799.
Bitcoin needs to close February at or above $23,799, or it risks opening up March 2023 below the Cloud, an event that bears and short sellers would likely be thrilled about.
If we check out the Composite Index against the candlesticks, there’s a setup from which bulls will probably feel a little sting, like Jamaican Jerk Chicken, which you didn’t know was made with ghost peppers.
Hidden Bearish Divergence is currently present. This type of divergence occurs when there are higher highs in the oscillator but lower highs on the candlestick chart.
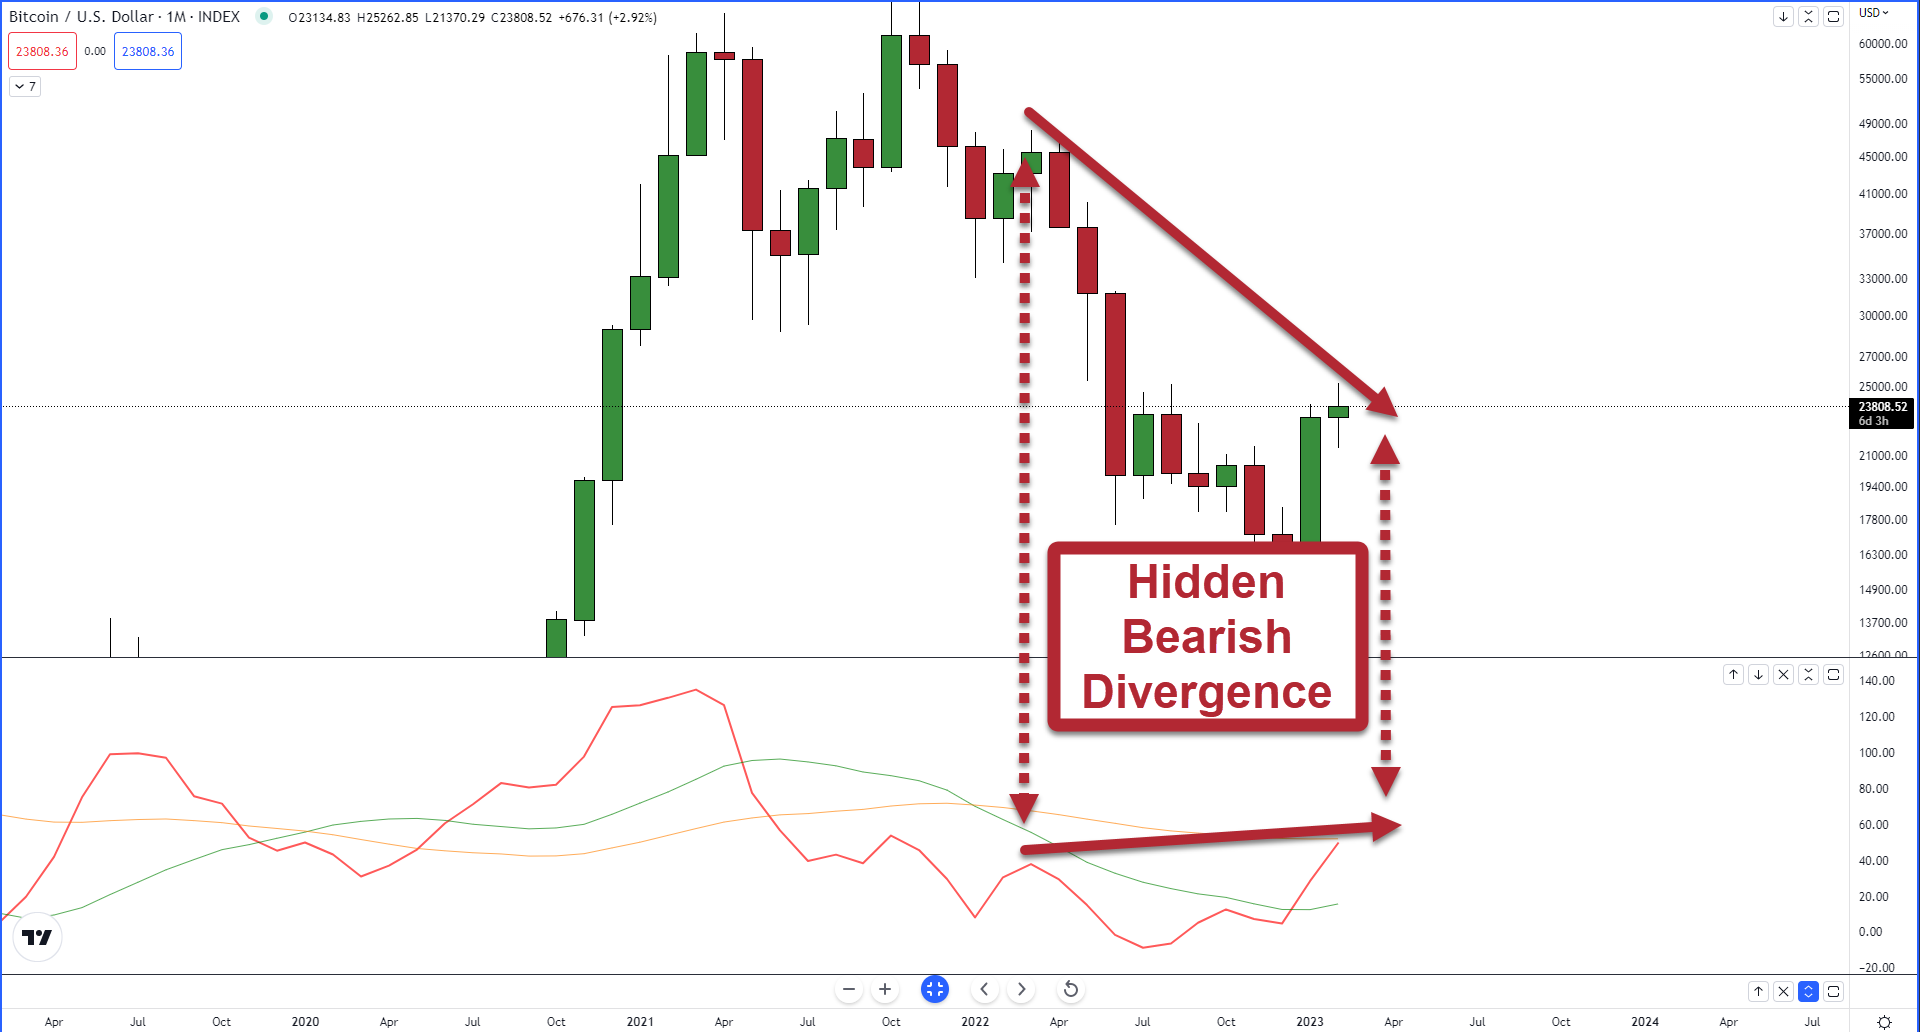
But hidden bearish divergence only applies if the prior swing/trend was bearish – which it is/was. And the Composite Index’s line (red) faces resistance against its slow-moving average (yellow moving average).
Bears and bulls both have really bad outlooks ahead of them.
Bears want to see Bitcoin close February, where $BTC completes the hidden bearish divergence – but doing so likely means Bitcoin closes above the monthly Tenkan-Sen and avoids a move below the Cloud.
Bulls want to see Bitcoin move a little lower to remove or at least negate the size of the divergence – but doing so would probably mean Bitcoin is trading below the Cloud.
No matter what side of the market ends February, the bulls and the bears both have the same problem as someone who just ate Ghost Pepper Jerk Chicken and needs to get rid of it.
They’re not sure which way it’s going to come out, but it’s going to burn either way.