February 2023 for Bitcoin closed up +0.02% – the flattest monthly close in $BTC‘s history.

The Month of March
Here’s what March has looked like in years past:
- 2010 +3.29%
- 2011 -8.77%
- 2012 +1.00
- 2013 +178.70%
- 2014 -16.91%
- 2015 -4.38%
- 2016 -5.23%
- 2017 -9.20%
- 2018 -32.84%
- 2019 +7.99%
- 2020 -24.66%
- 2021 +29.96
- 2022 +5.41%
Average March Gain +37.25%
Average March Loss -14.57%
6 of the 13 past months of March were green, and 7 of 13 were in the red. 🔴
Quarter 1
March is also the final month of the 1st quarter. How does Q1 performing, historically?
- 2010 +694.47%
- 2011 +161.54%
- 2012 +3.95%
- 2013 +588.60%
- 2014 -38.18%
- 2015 -24.14%
- 2016 -3.03%
- 2017 +11.38%
- 2018 -50.16%
- 2019 +10.91%
- 2020 -10.37%
- 2021 +102.87%
- 2022 -1.45%
Q1 Average Gain +32.28% (starting from 2012)
Q1 Average Loss -21.22% (starting from 2012)
Q1 has closed in the green 7 of 13 times and in the red 6 of 13 times. 🟢
Putting It All Together
If you go back to the This Is What Crypto Did In 2022 article from December 30, 2022, you’ll read that 2022 had some fairly epic moves – some historical.
- Second worst-performing year ever.
- The first-year crypto closed below the prior year’s open.
- 2022 had the fastest and most violent sustained collapse in crypto history (April 2022 – June 2022).
- The longest stretch of consecutive weekly losses occurred in 2022: 11 even weeks.
- The longest consecutive record of quarterly losses occurred in 2022: 4.
The last data point, the four consecutive quarterly losses, could be broken in Q1 2023.
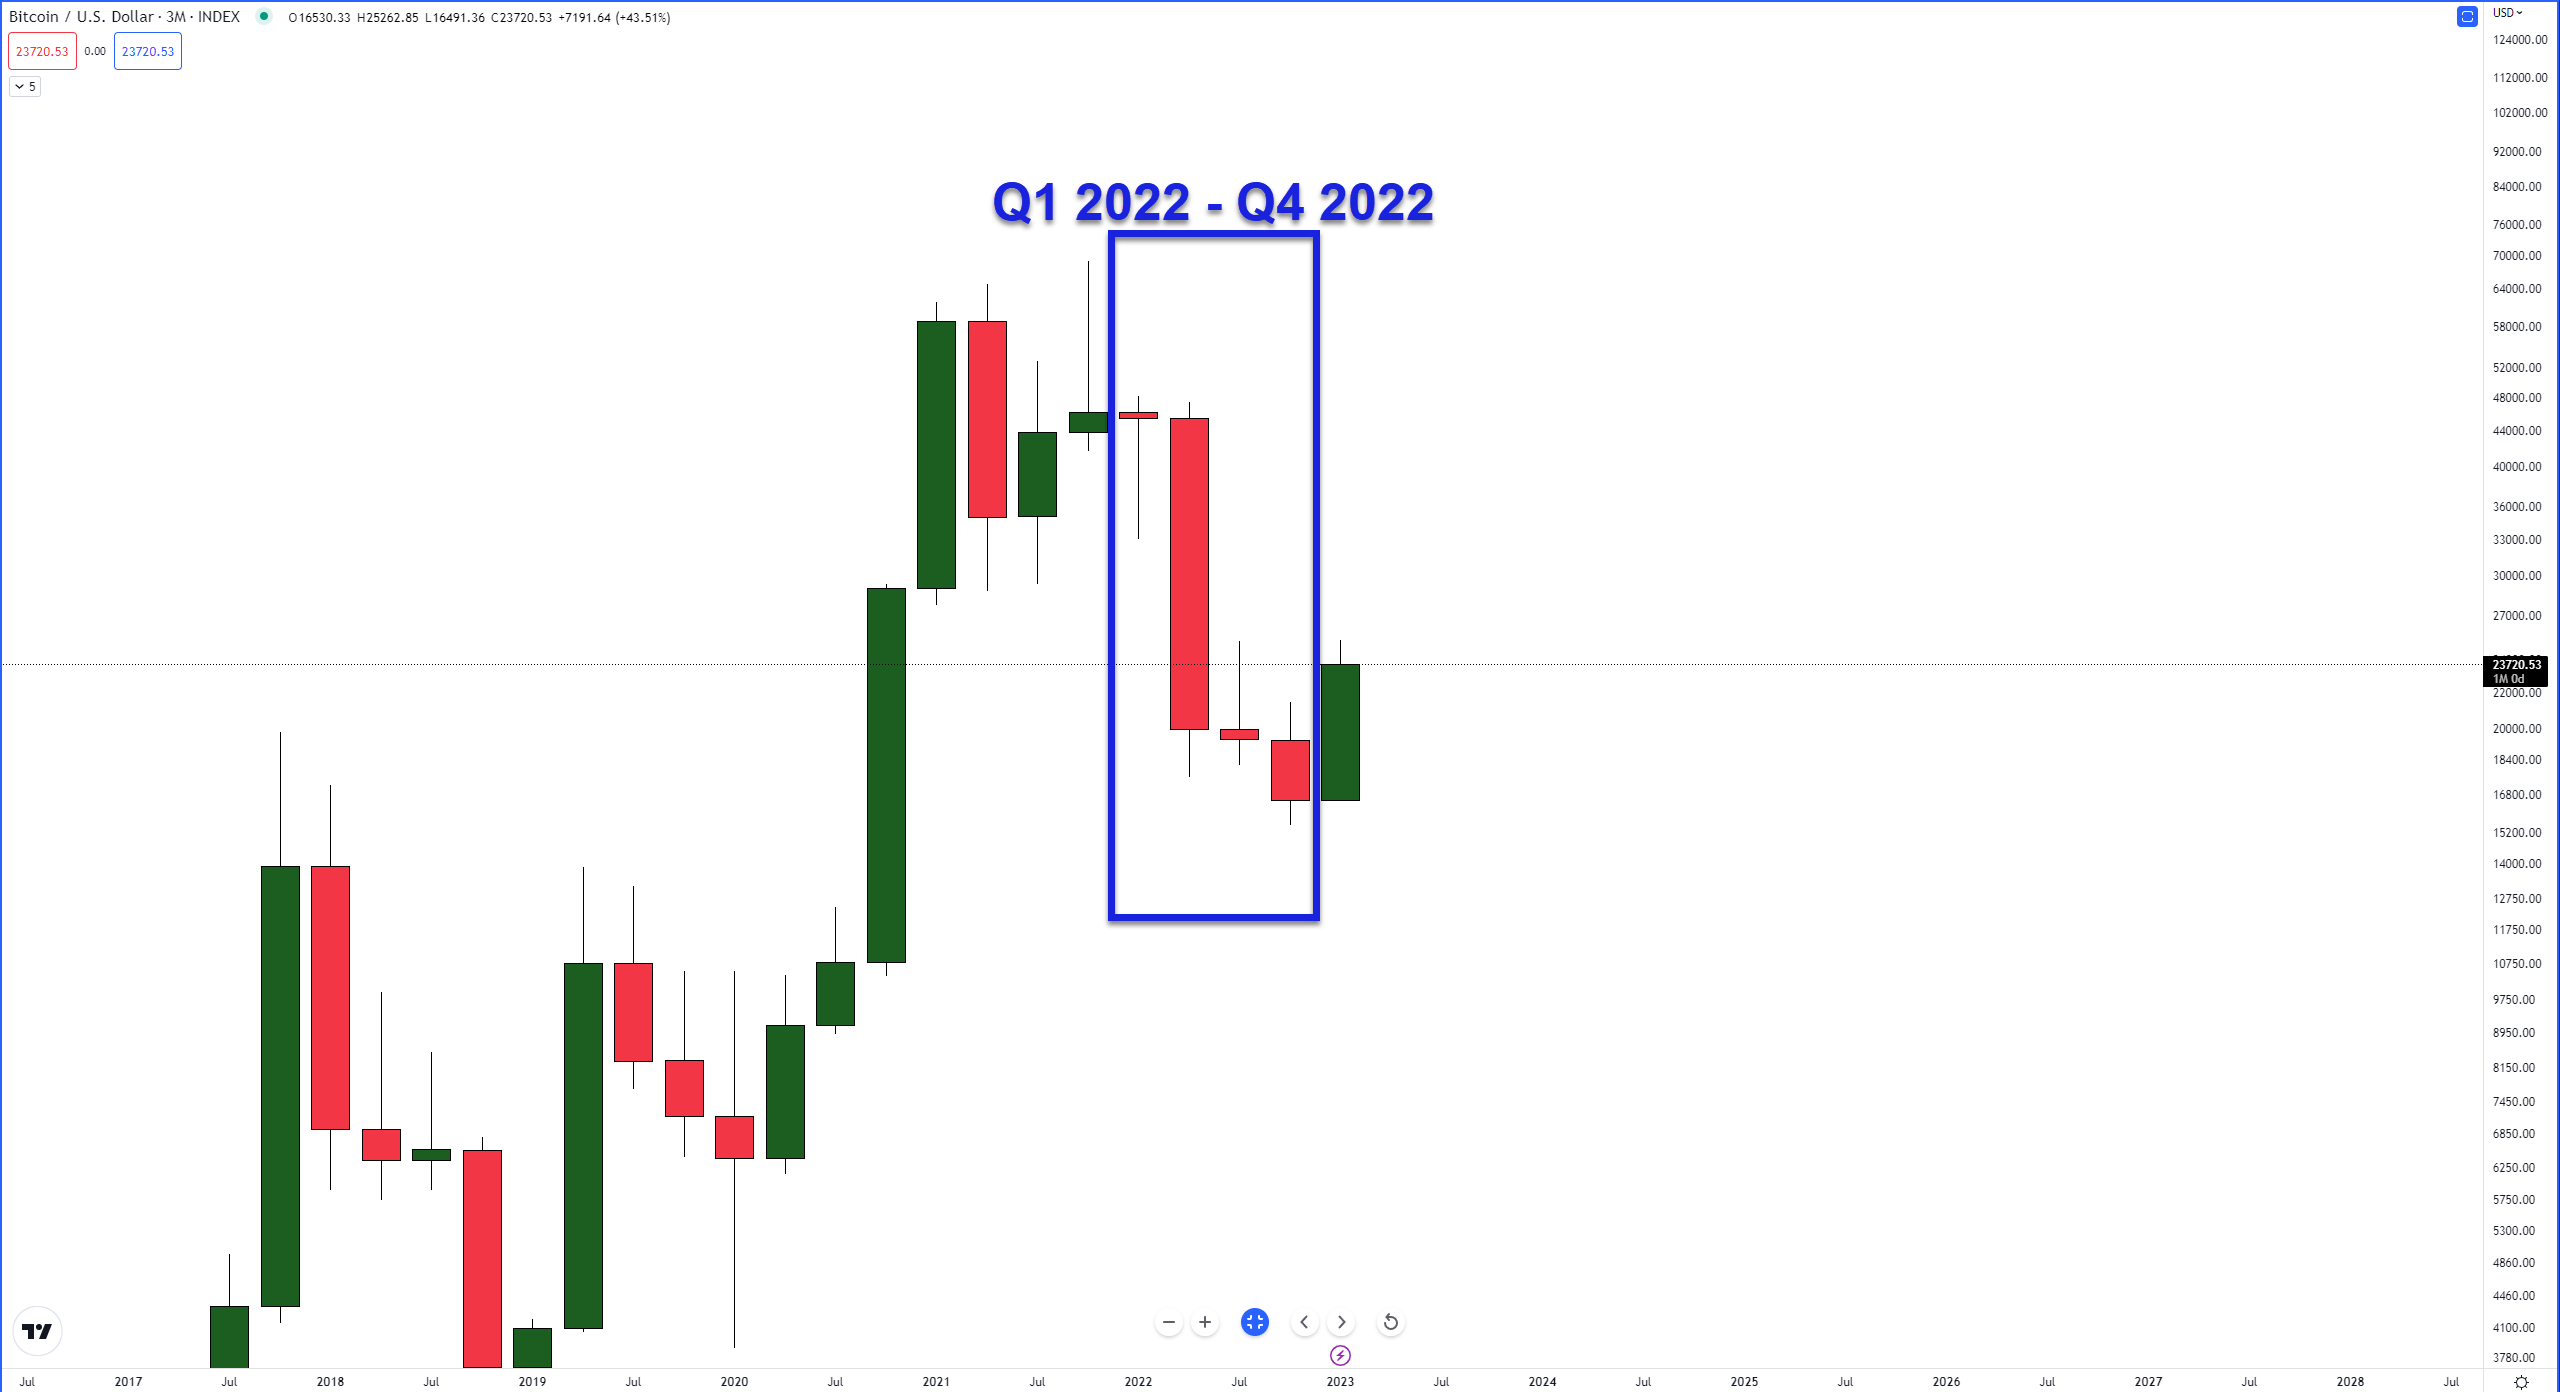
At Bitcoin’s current price level of $23,700, Q1 2023 is already above the open and close of Q3 2022 and Q4 2022.
Additionally, Q1 2023 is so far the best-performing quarter since Q1 2021.
Compared to prior Q1s? Q1 2023 is on track to be the best since 2013.
And without going into too much detail, Q2 is just around the corner. And Q2 is, historically, the best-performing quarter for Bitcoin. 🚀