$9,105.45 and +46.07%. That’s how much $BTC has moved in the past ten days. 🤯
The question analysts have is this: are we about to see a pullback, or will crypto keep pamping?
Let’s take a look at Bitcoin’s chart(s). And if you want to skip the Gandalf, Dumbledore, hocus pocus technical analysis, scroll down to the TL;DR (Too Long; Didn’t Read) for the summary.
On Bitcoin’s daily chart, there are many reasons why a pullback should be expected.
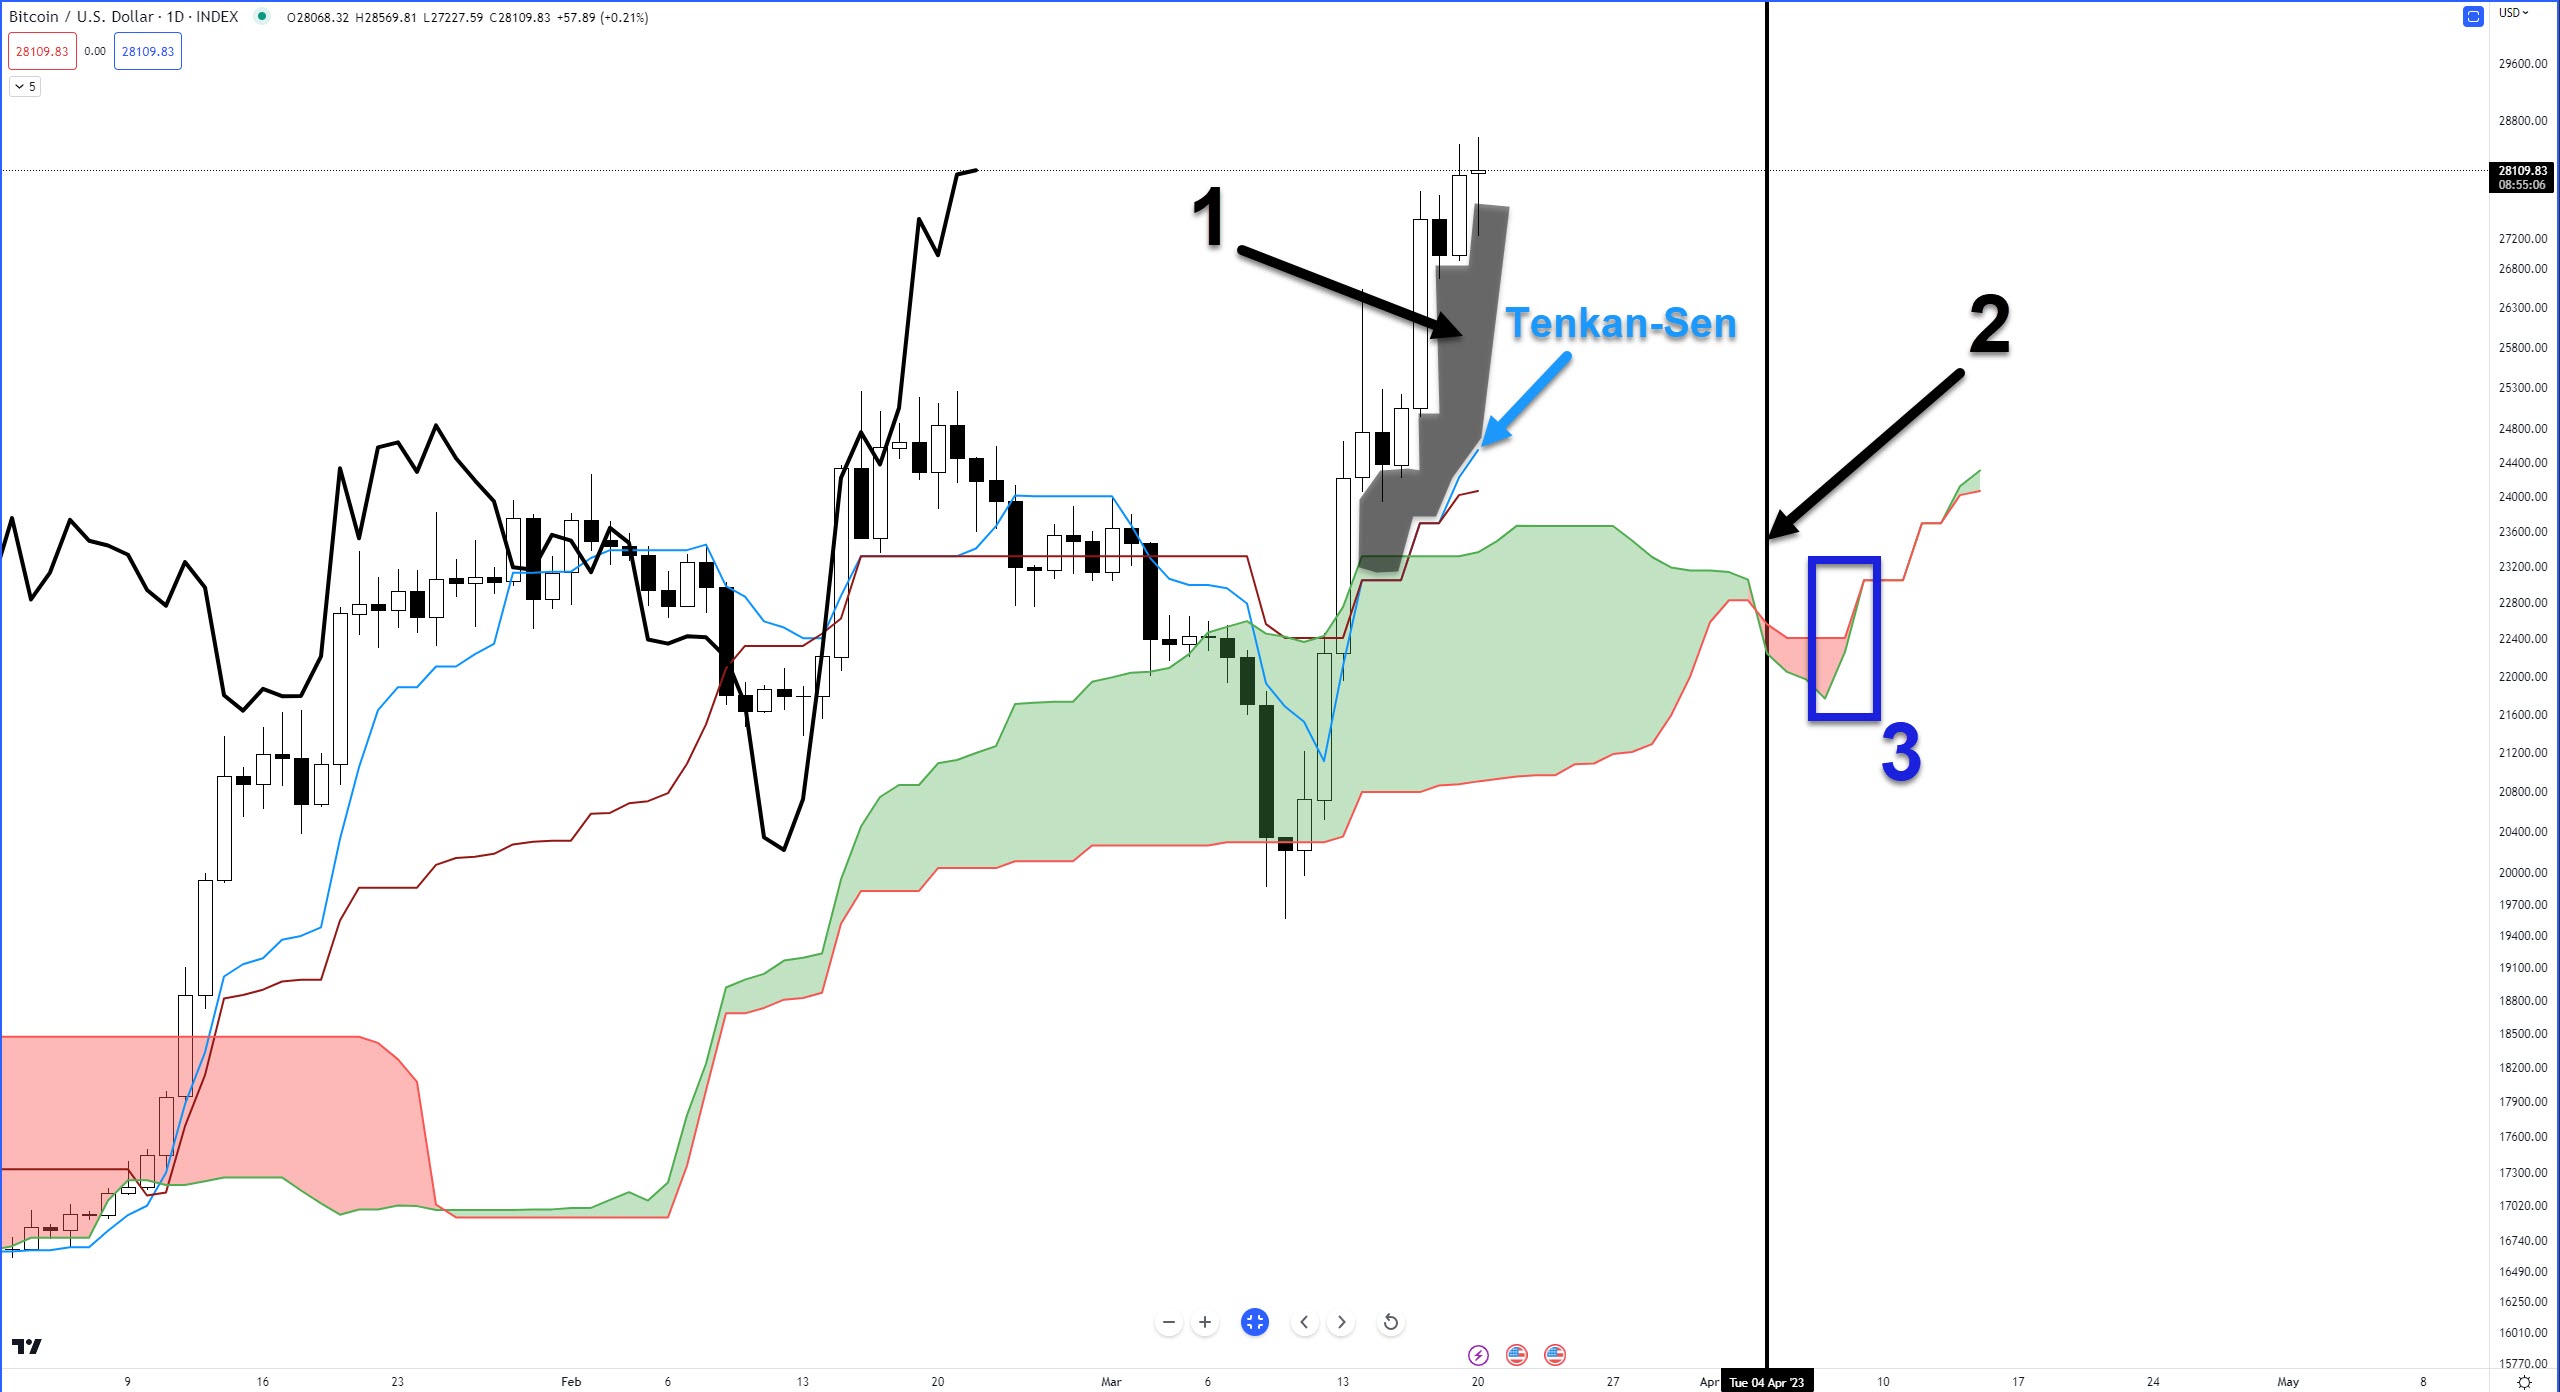
The first reason a pullback is expected is the large gaps between the Tenkan-Sen and the bodies of candlesticks (#1 on the chart above) do not last long and typically correct within four to five periods. Today is the seventh day of large gaps.
Note the Kumo Twist on April 4 (#2) and the Cloud pointing in the same direction as the future Cloud on April 8 (#3).
The next image below shows two oscillators, the Composite Index and the RSI.
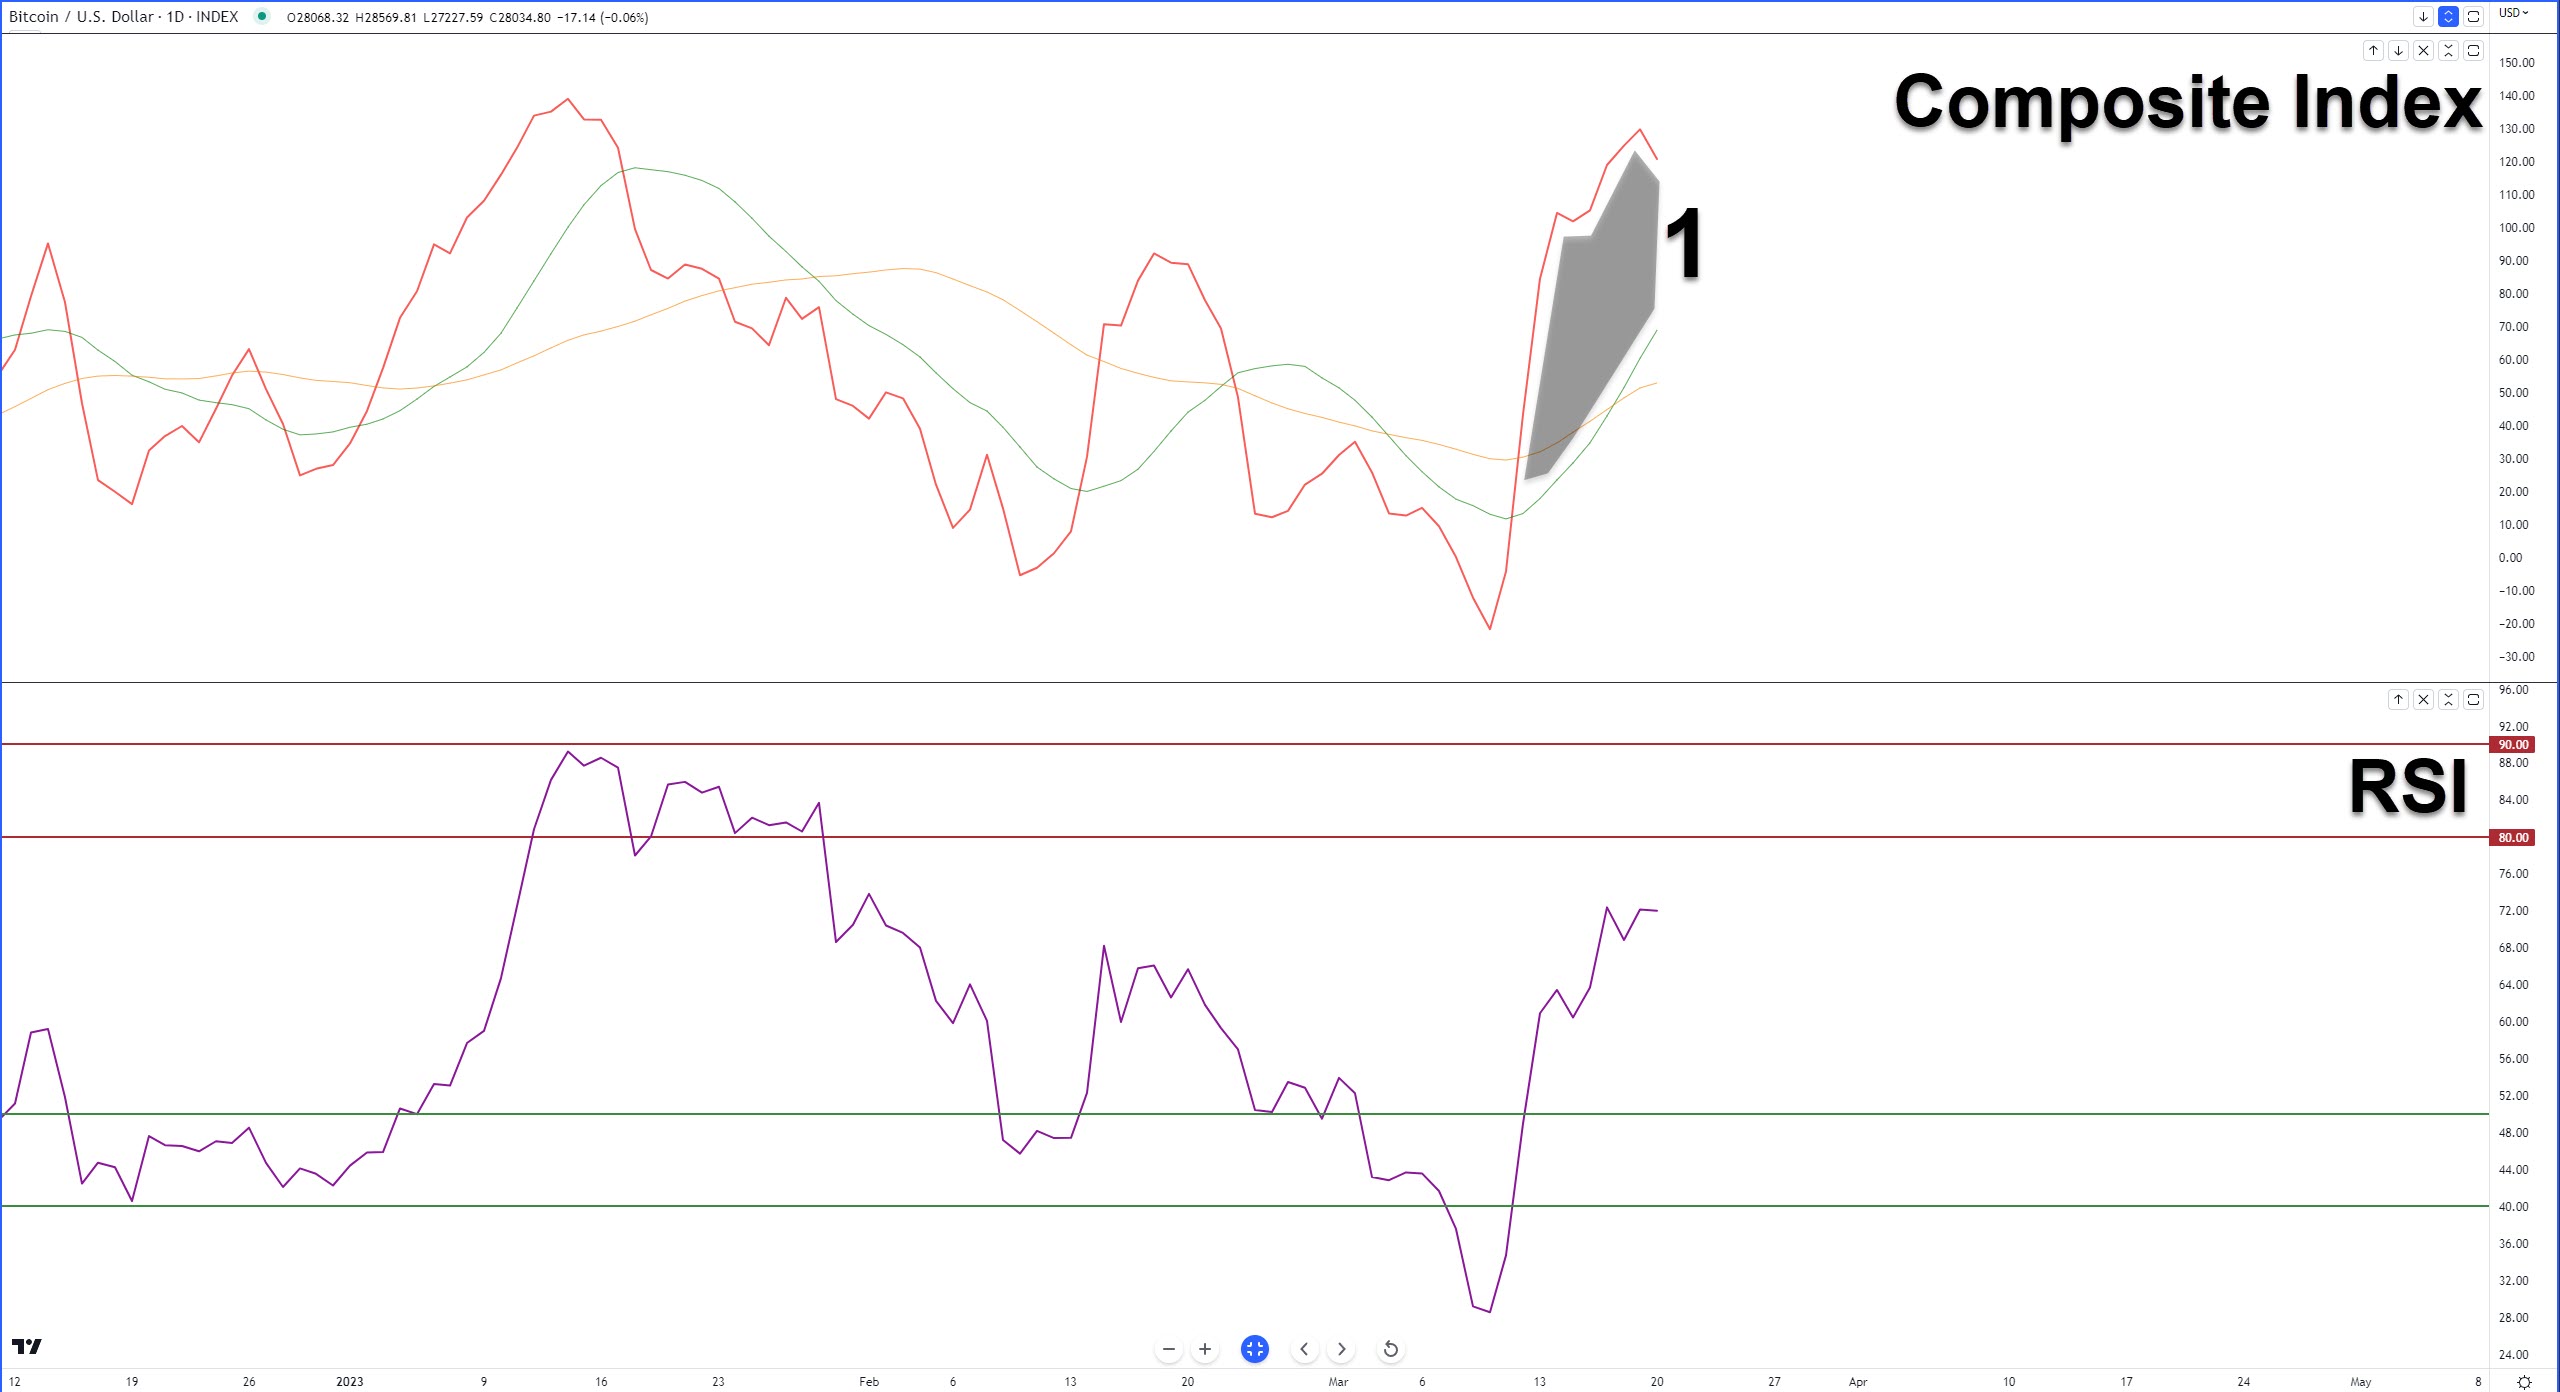
The second reason a pullback is likely can be seen in the Composite Index above. Similar to the gaps between the candlestick bodies and the Tenkan-Sen. A large gap exists between the Composite Index line (red) and the fast-moving average (green line). Additionally, the Composite Index on the daily chart is sitting near historical highs. 🔝
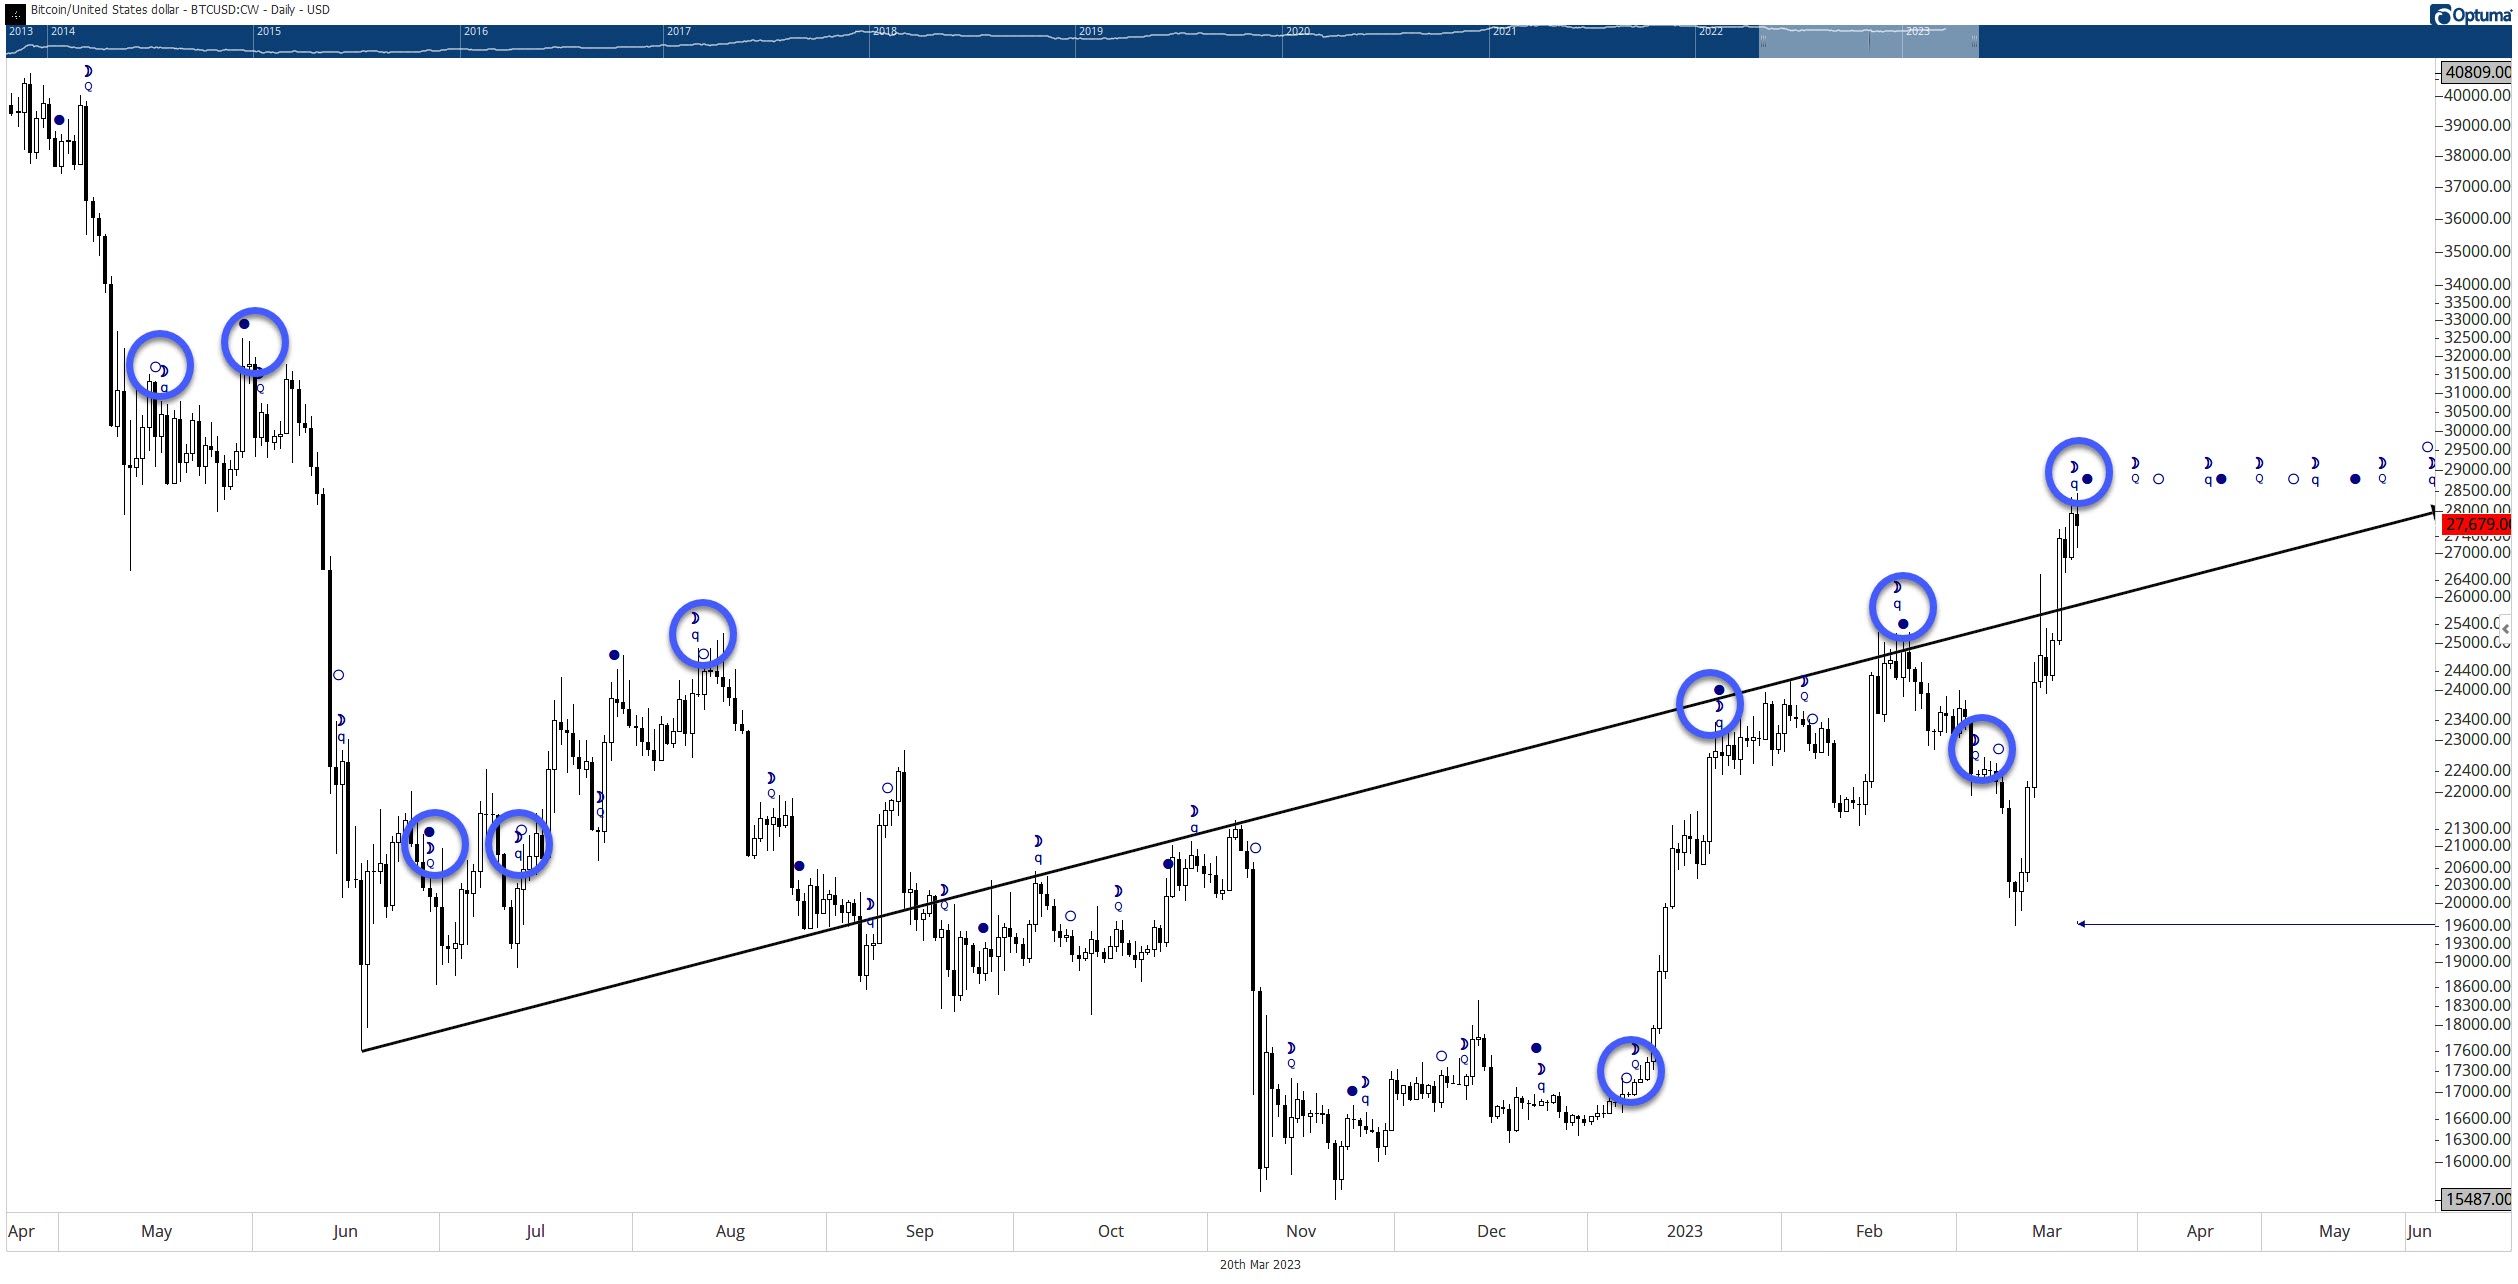
The third reason and this gets into the tinfoil hat part of technical analysis, is the presence of two important astronomical lunar phases: A Full Moon on March 21 and the Moon Perigee (when the moon is closest to Earth).
For whatever reason, the combination of those two lunar events, when close together, has a high probability of appearing near major/minor swing highs/lows. The screenshot below highlights some recent periods where a Full/New Moon phase occurs within a few days of the Moon Apogee/Perigee.
Continuing with the tinfoil hat analysis, March 20 completes one of Gann’s Cycles of the Inner Year: the 120-day cycle.
March 20 is 120 days from the November 21, 2022, low.
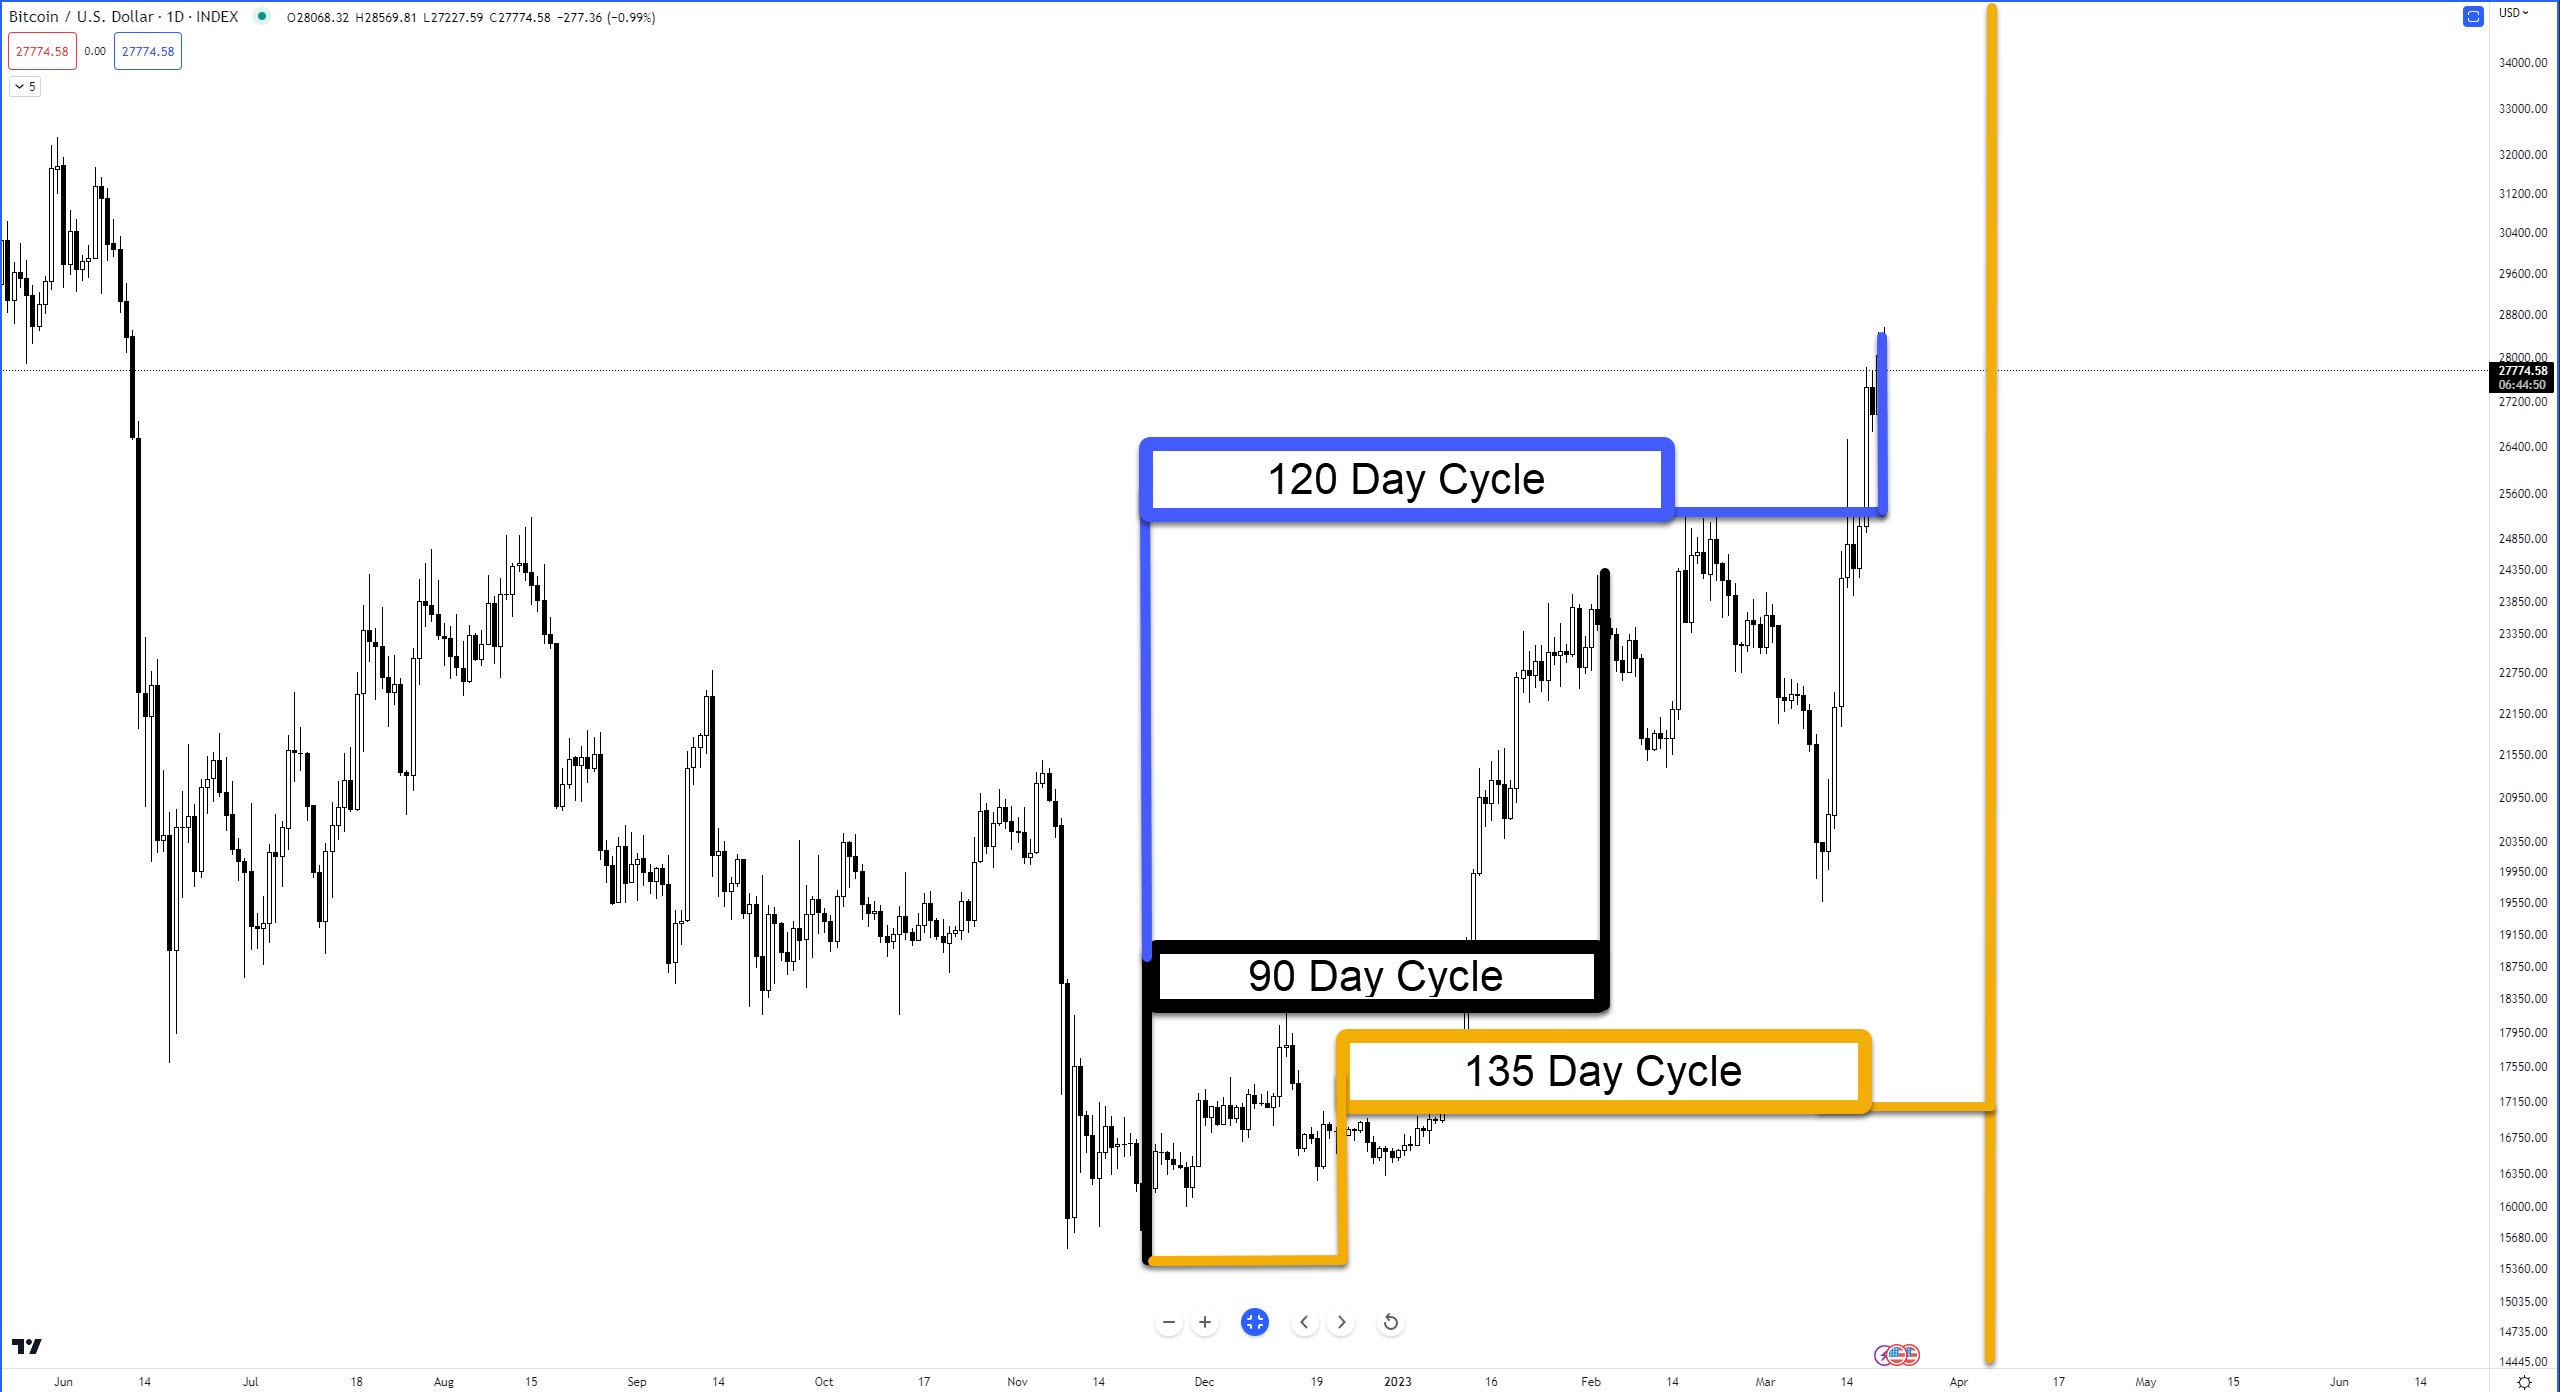
Gann wrote that the 120-day cycle usually occurs with the trend and should be watched as a countertrend low if the 90-day cycle was high. Historically, Bitcoin is not very sensitive to the 120-day cycle.
The next cycle, the 135-day cycle, occurs on April 5 – one day after the Kumo Twist. 🔀
TL;DR
Analysts warn that a combination of time cycles warns along with overbought levels on the daily chart indicated Bitcoin and the broader crypto market may face a pullback shortly.
Additionally, Bitcoin is right up against the bottom of the weekly Ichimoku Cloud (not shown) – an area it hasn’t traded near since April 11, 2022.
Near-term support is a confluence zone of a dominant interior angle and the daily Tenkan-Sen in the $25,300 to $26,000 value areas.
Future Time Cycle Cluster Dates
Cluster dates are identified to help analysts determine when a new high/low may occur, especially if price is trending strongly into that cluster.
Cluster One
- April 15 – Moon perigee
- April 19 – New Moon
- April 21 – Venus 72-degrees
Cluster Two
- May 2 – 49-day cycle **
- May 6 – Gann Seasonal Date
Cluster Three
- June 22 – Gann Seasonal Date
- July 4 – 225-day cycle
- July 4 – Full moon, Moon perigee
- July 7 – Gann Date, Gann warned that advances and declines usually culminate around this date and to watch for trend changes.
Cluster Four
- July 17 – New Moon
- July 20 – Moon Perigee
- July 24 – 135-day cycle **
- August 8 – Gann Date, Gann warned to watch for important changes in trends and to watch for tops and bottoms to occur
Cluster Five
- August 2023 – Ichimoku number 9 (9 monthly candlesticks from November 2022)
- August 18 – 270-day cycle *
- August 21 – 180-bar cycle (weekly chart, from Covid Low)
Cluster Six
- September 12 – Moon Apogee
- September 14 – New Moon
- September 16 – 180-day cycle**
Cluster Seven
- September 23 – Gann Seasonal Date
- September 27 – Moon Perigee
- September 29 – Full Moon
- October 2 – 315-day cycle *
Cluster Eight
- January 11, 2024 – New Moon
- January 13, 2024 – Moon Perigee
- January 19, 2024 – 315-day **
April 2024 – Ichimoku number 17 (17 Monthly candlesticks from November 2022)
November 2024 – Kumo Twist (Monthly)
January 2015 – Ichimoku number 26 (26 monthly candlesticks from November 2022)
* From the November 2021, 2022 low.
** From the March 10, 2023, low.