Ethereum’s made its move, but where might it find resistance?
And two altcoins, Tezos and Hedera, are well-positioned for breakouts of their own soon.
New to the Ichimoku Kinko Hyo system? You can read our 101 on it here.
Ethereum
Ethereum’s run this week has been phenomenal. It was just a few bucks away from making a new 2023 high but got halted. Let’s see where it’s at going into the weekend. 🌫️
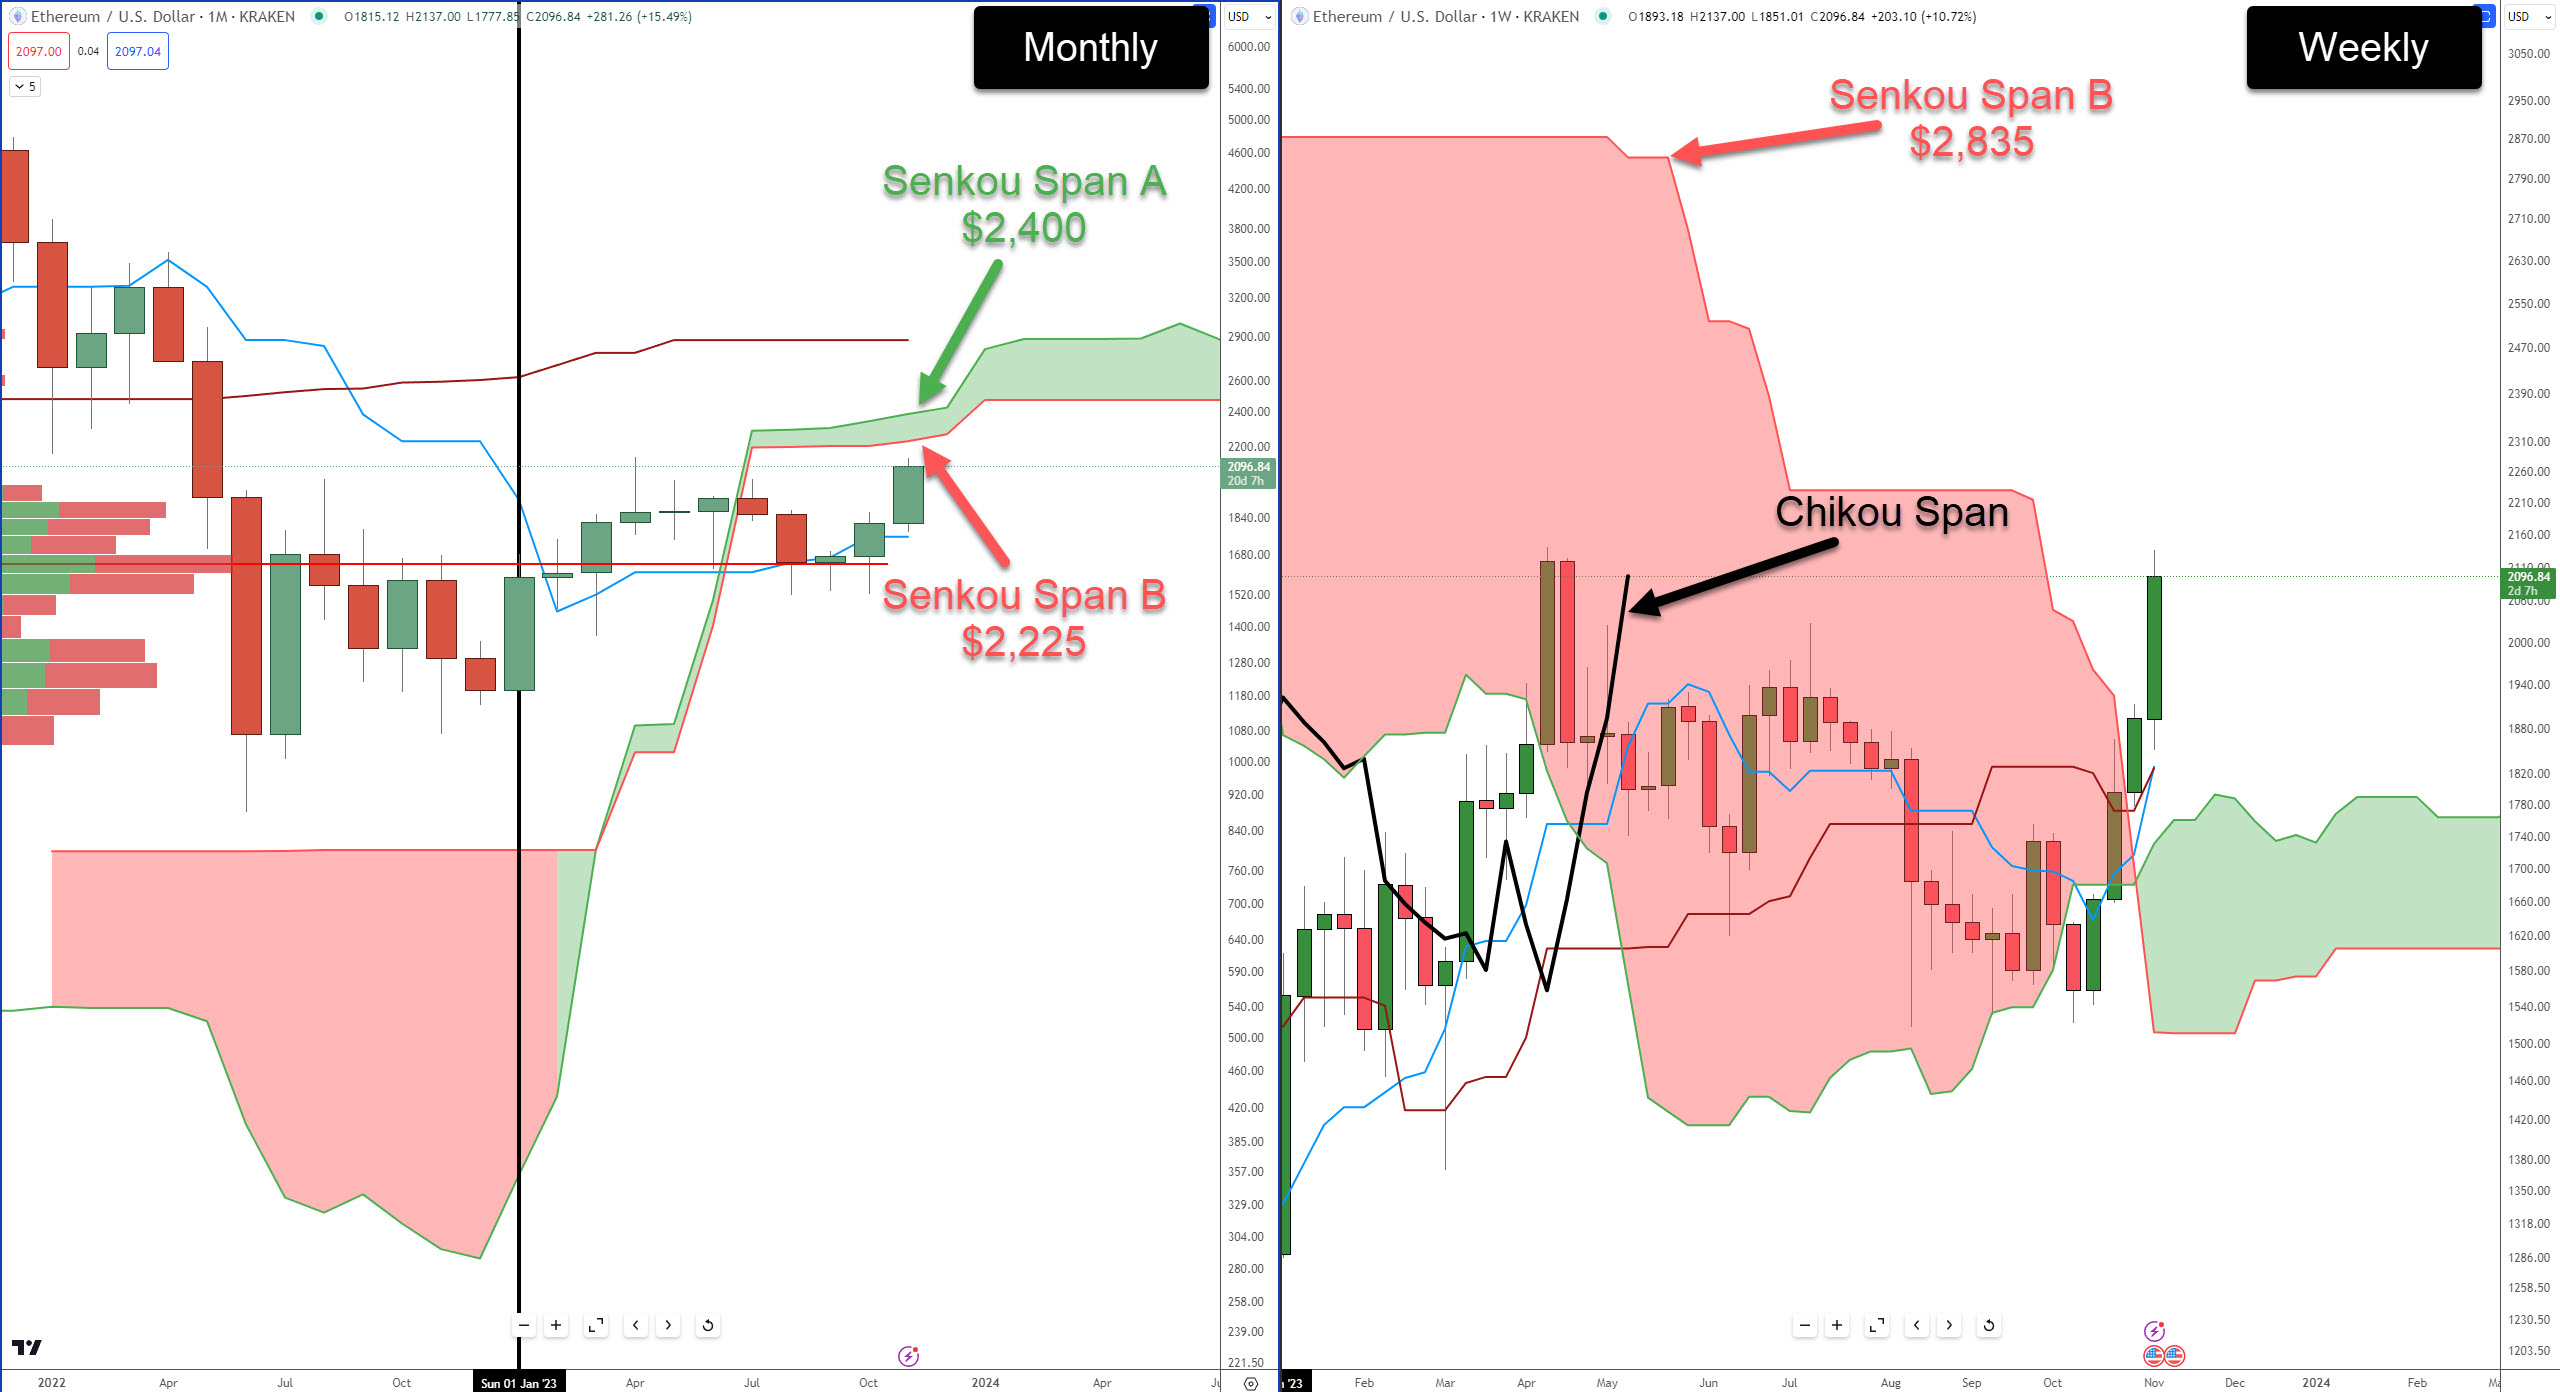
On the weekly chart (right), Ethereum is above the Cloud and has a confirmed Ideal Bullish Ichimoku Breakout – one of the most sought-after setups within the Ichimoku Kinko Hyo system.
The only near-term resistance for $ETH on the weekly chart is when the Chikou Span hits the top of the Cloud (Senkou Span B) at $2,835.
On the monthly chart (left), Ethereum is creeping closer to its next resistance zone, Senkou Span B (the bottom of the Cloud), at $2,225. Senkou Span B is the most powerful level of support/resistance within the Ichimoku system.
However, thin Clouds represent weakness, not strength – so, as strong as Senkou Span B naturally is, its strength could be significantly weakened because of how thin the Cloud is.
Tezos
$XTZ used to be one of the darlings of the altcoin community, but it’s suffered during crypto winter along with the broader market. ❄️
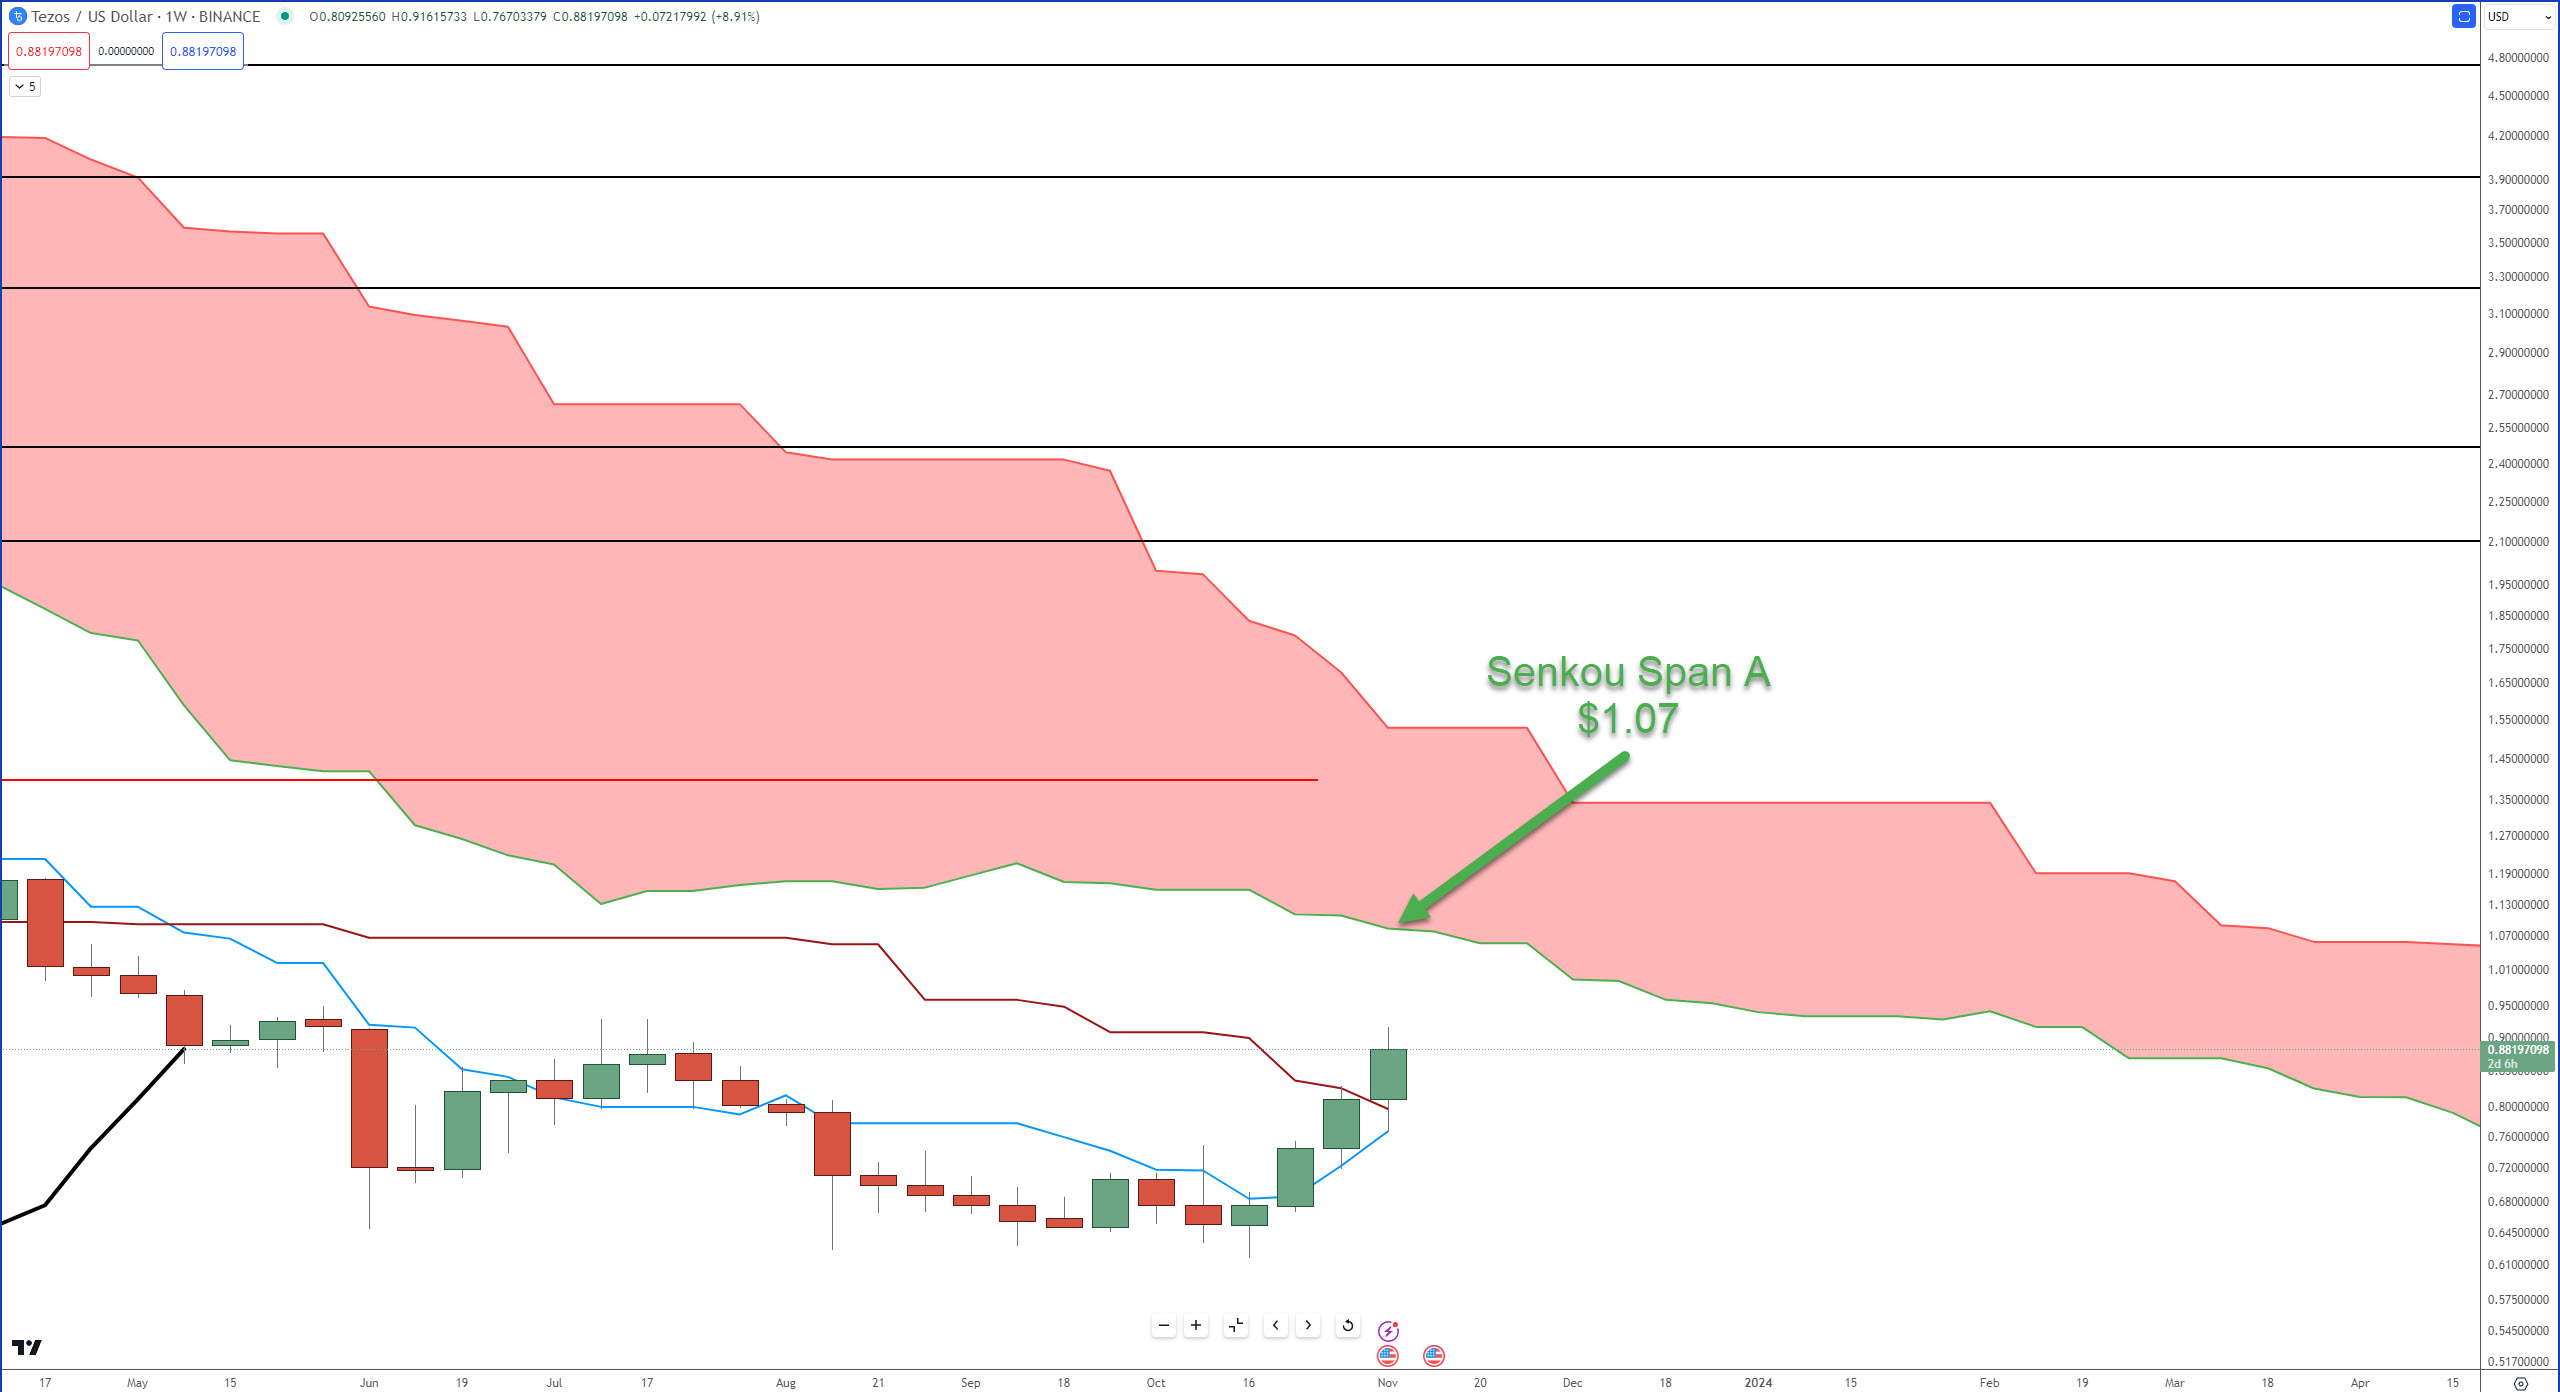
The pain has been worse for Tezos hodlers in some ways because it made new all-time lows as recently as mid-October 2023. Since those lows were hit, Tezos has rallied almost +50% from $0.61 to $0.91.
Does it have more room to run higher? Absolutely. On the daily chart (not shown), the Tenkan-Sen and candlestick bodies have moved closely together for almost a month, a signal of strength.
And on the weekly chart, Tezos is looking to pull off a weekly close above Kijun-Sen. If you disregard the weekly close earlier this March, where XTZ barely closed above the weekly Kijun-Sen, this week is the first major close above that Ichimoku level since November 2021.
Near-term support for Tezos on the weekly chart is the Tenkan-Sen and Kijun-Sen in the $0.80 value area, with near-term resistance against the bottom of the Cloud (Senkou Span A) at $1.07.
Hedera Hashgraph
Out of the three cryptocurrencies here, $HBAR‘s weekly chart has the highest probability of executing an Ideal Bullish Ichimoku Breakout. 🖼️
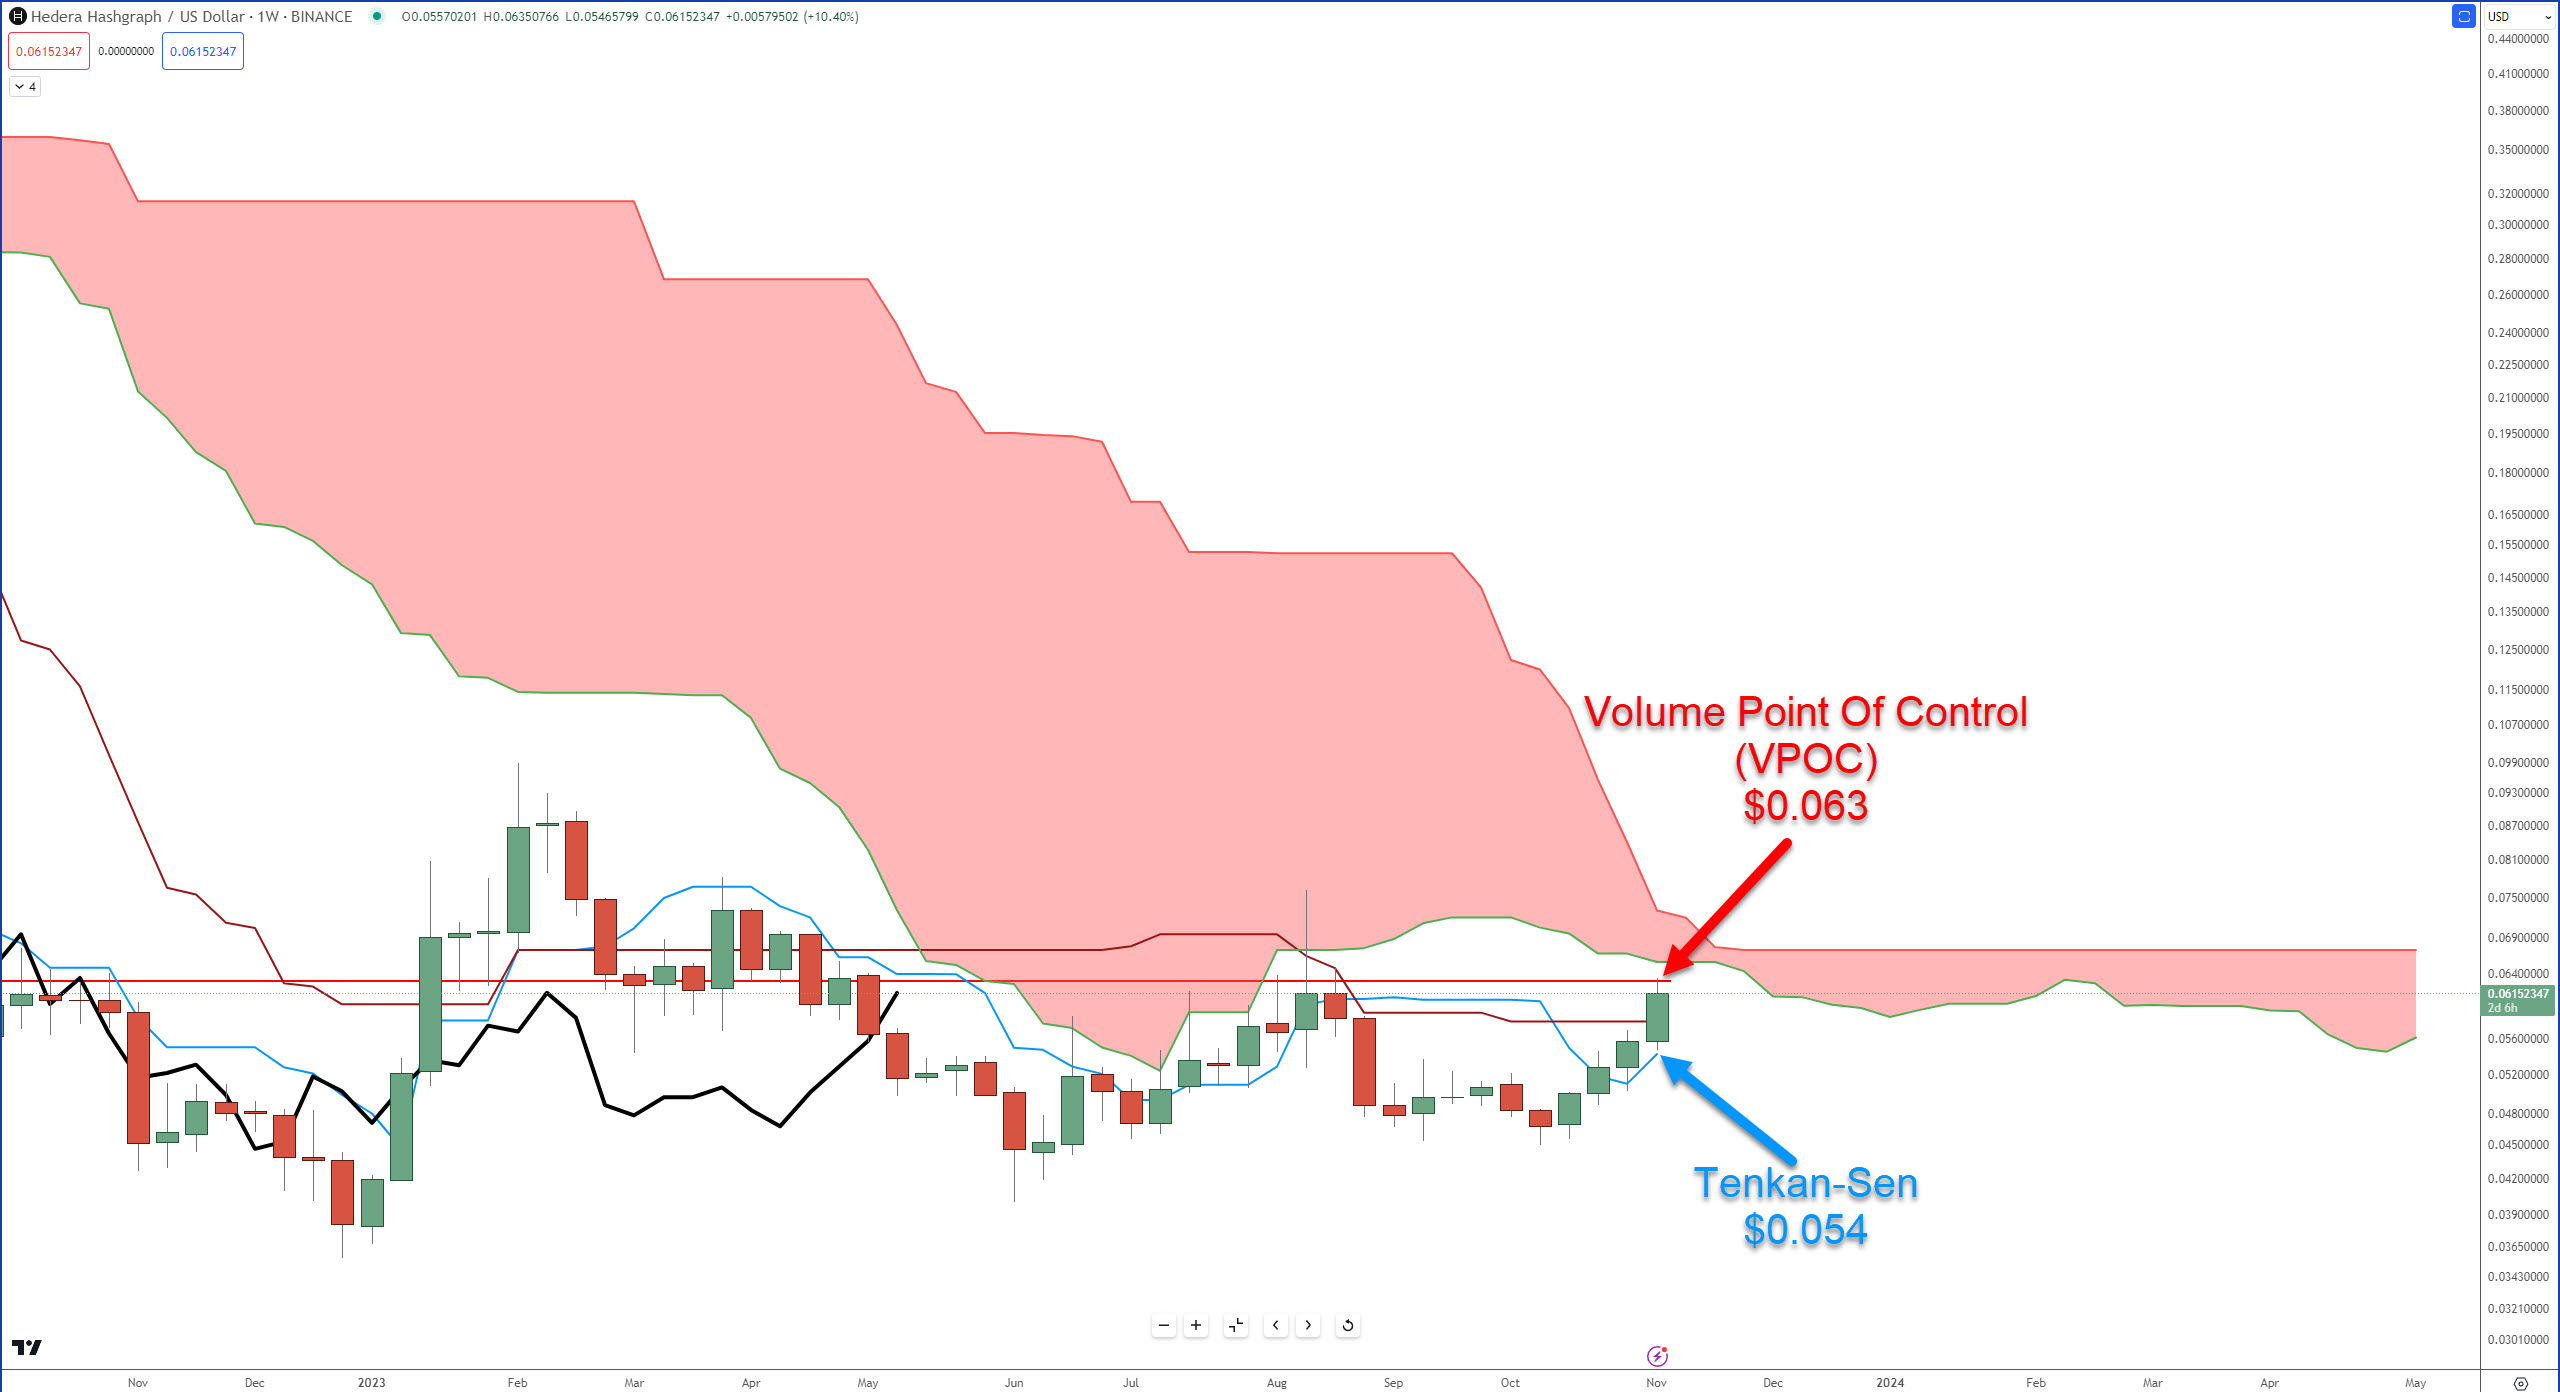
Because the Cloud is extremely thin over the next two weeks and because of Hedera’s proximity to the Cloud, this is the best position it’s ever had to initiate a bullish breakout.
The VPOC at $0.063 is the nearest resistance level – and has proven difficult for bulls to crack.
Bears are likely looking for a rejection against the VPOC and a return below the Tenkan-Sen ($0.054) for a continuation move lower.