We’re looking at the beginning of another breakout higher or a very ugly, nasty fakeout. 🤷♂️
Today we’re looking at Cardano and Chainlink – two cryptos whose charts look much like the rest of the altcoin market.
Cardano
It’s hard to believe that $ADA‘s consolidation is almost a month long. And there’s some early warning signs that a breakout higher might be right around the corner. ⤴️
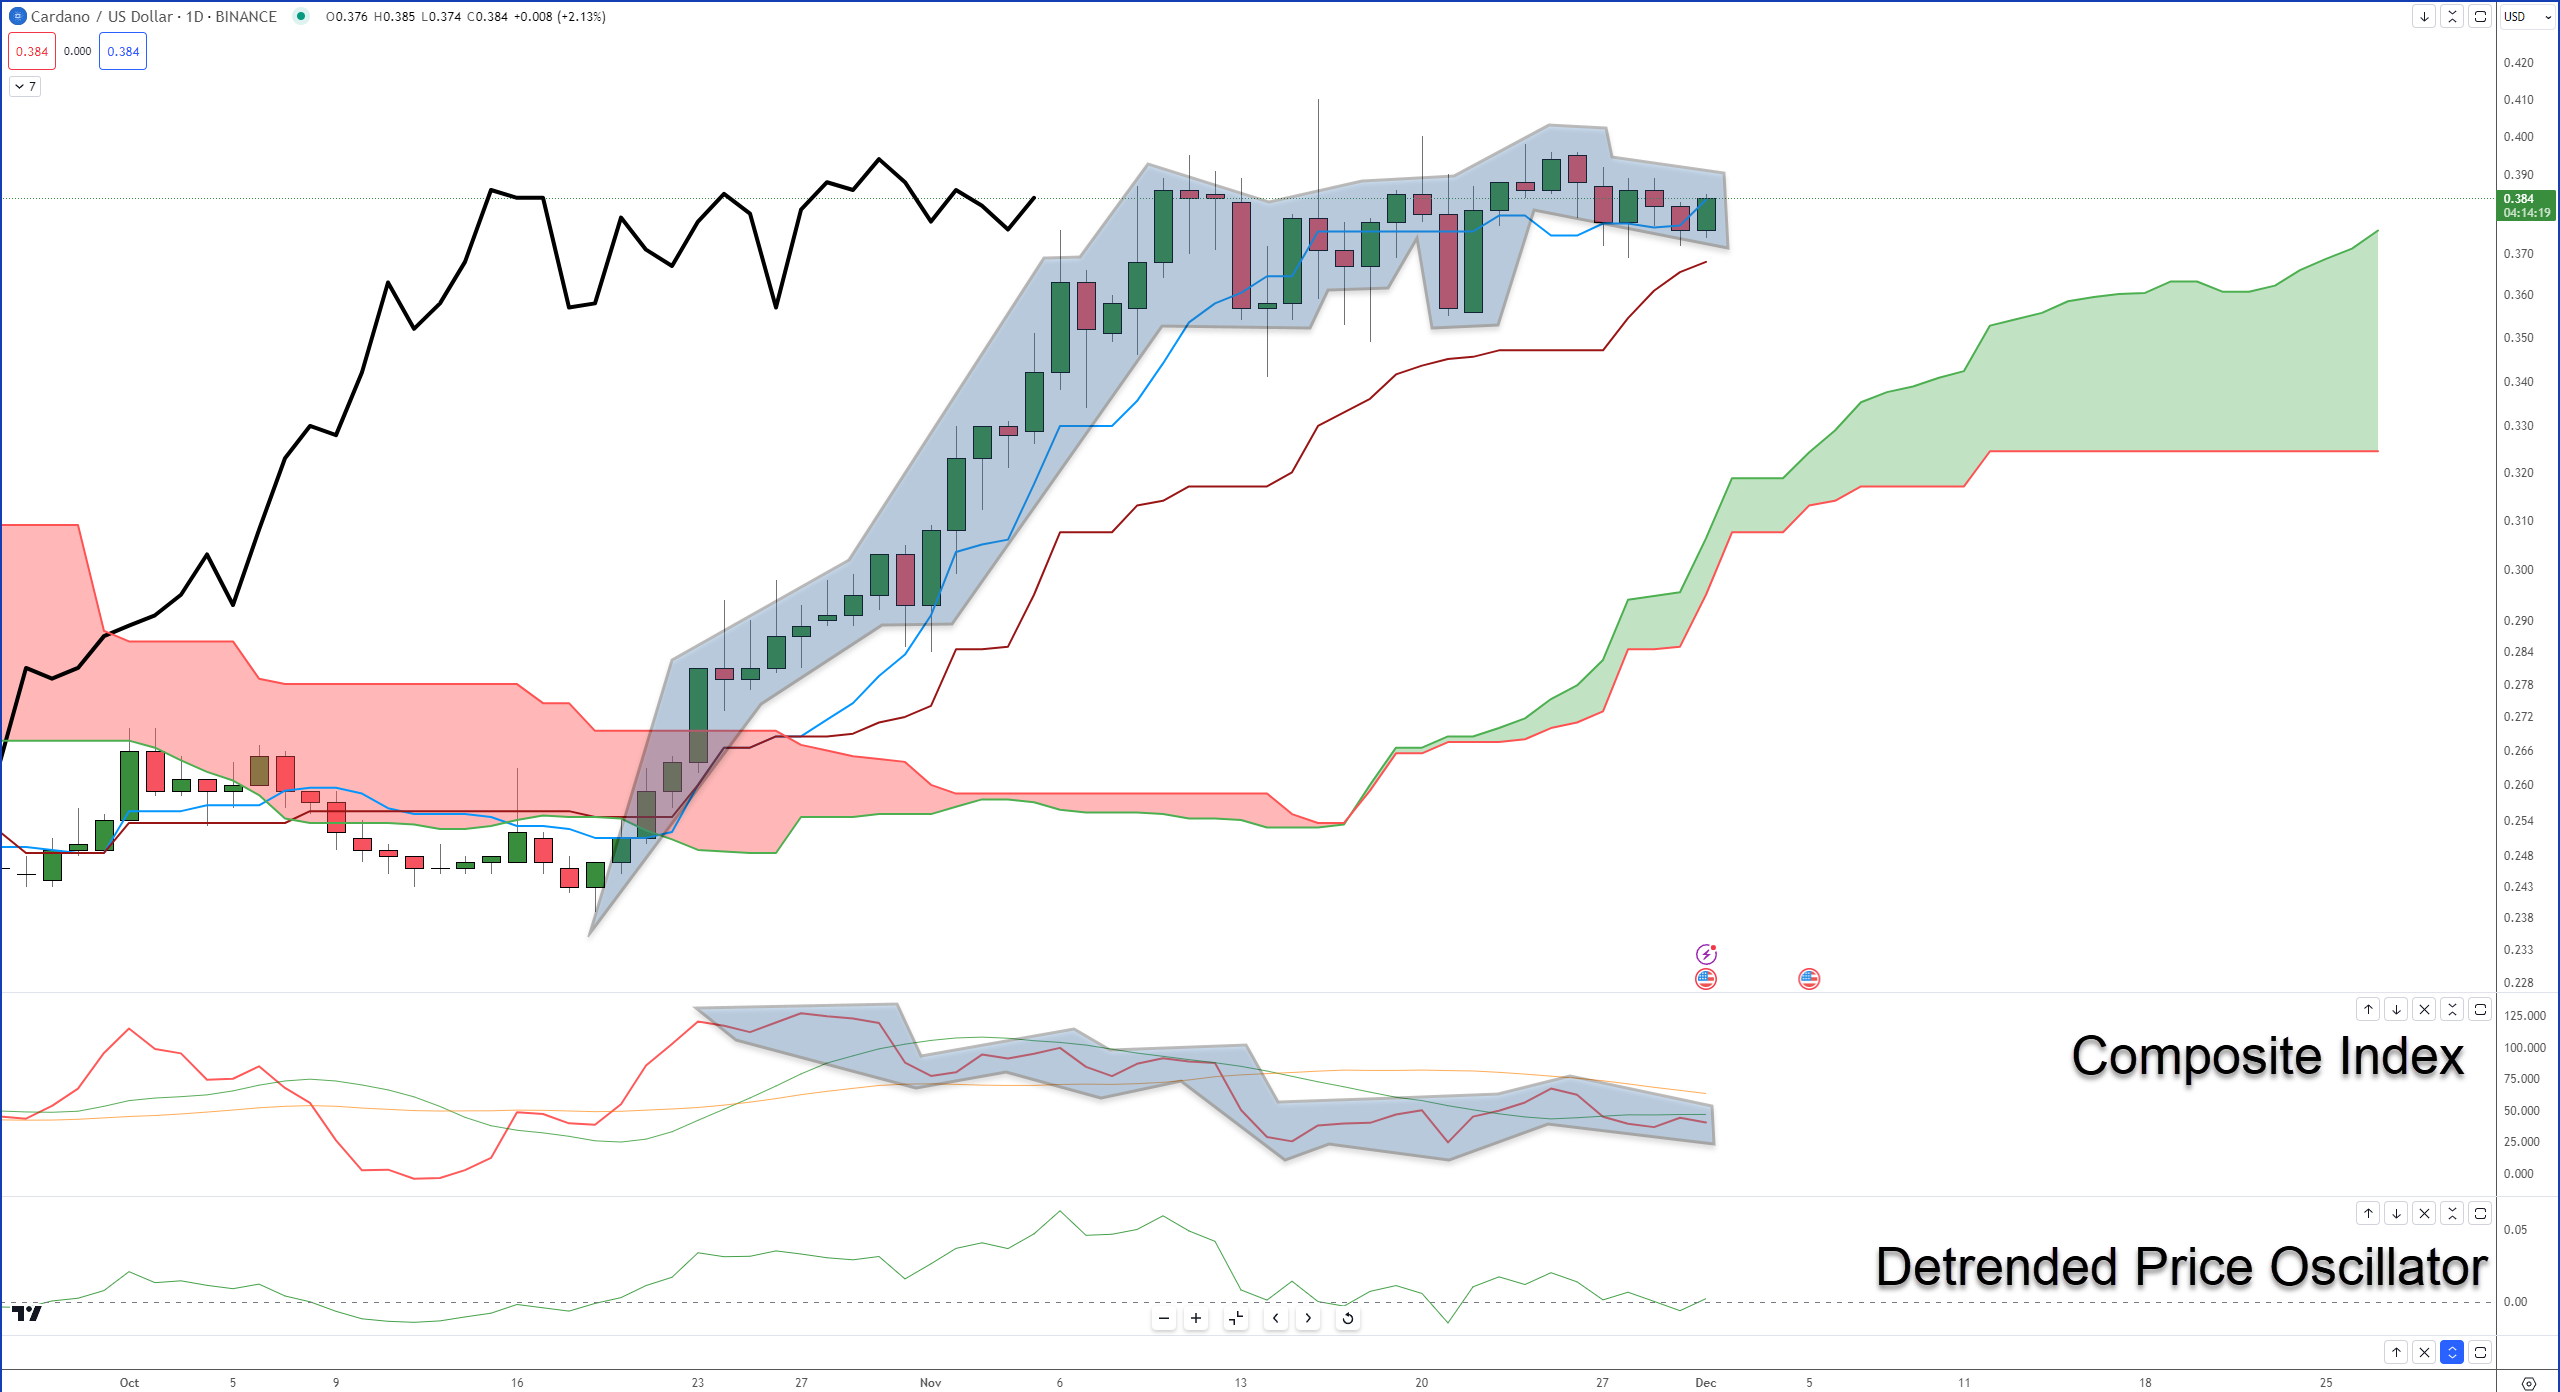
I’ve highlighted Cardano’s price action, and the Composite Index’s movement to show the overall direction of price action is higher with higher lows, and the Composite Index’s overall direction is lower with lower lows – also known as hidden bullish divergence.
Hidden bullish divergence is a warning sign that the prior move is likely to continue, and there have been many hidden bullish divergences since late October.
Because the Composite Index has slid down into its historical neutral territory and the Detrended Price Oscillator is about to cross above the zero line, a new upswing for Cardano looks imminent.
But, and there’s always a but, be aware that Cardano’s stuck in the Cloud on the weekly chart (not shown), and the Composite Index is pointing lower after returning to its historical resistance level. 🛑
Chainlink
$LINK is one of the best-performing major market-cap cryptocurrencies of 2023. From the June lows, Chainlink has moved up almost +250%! 😱
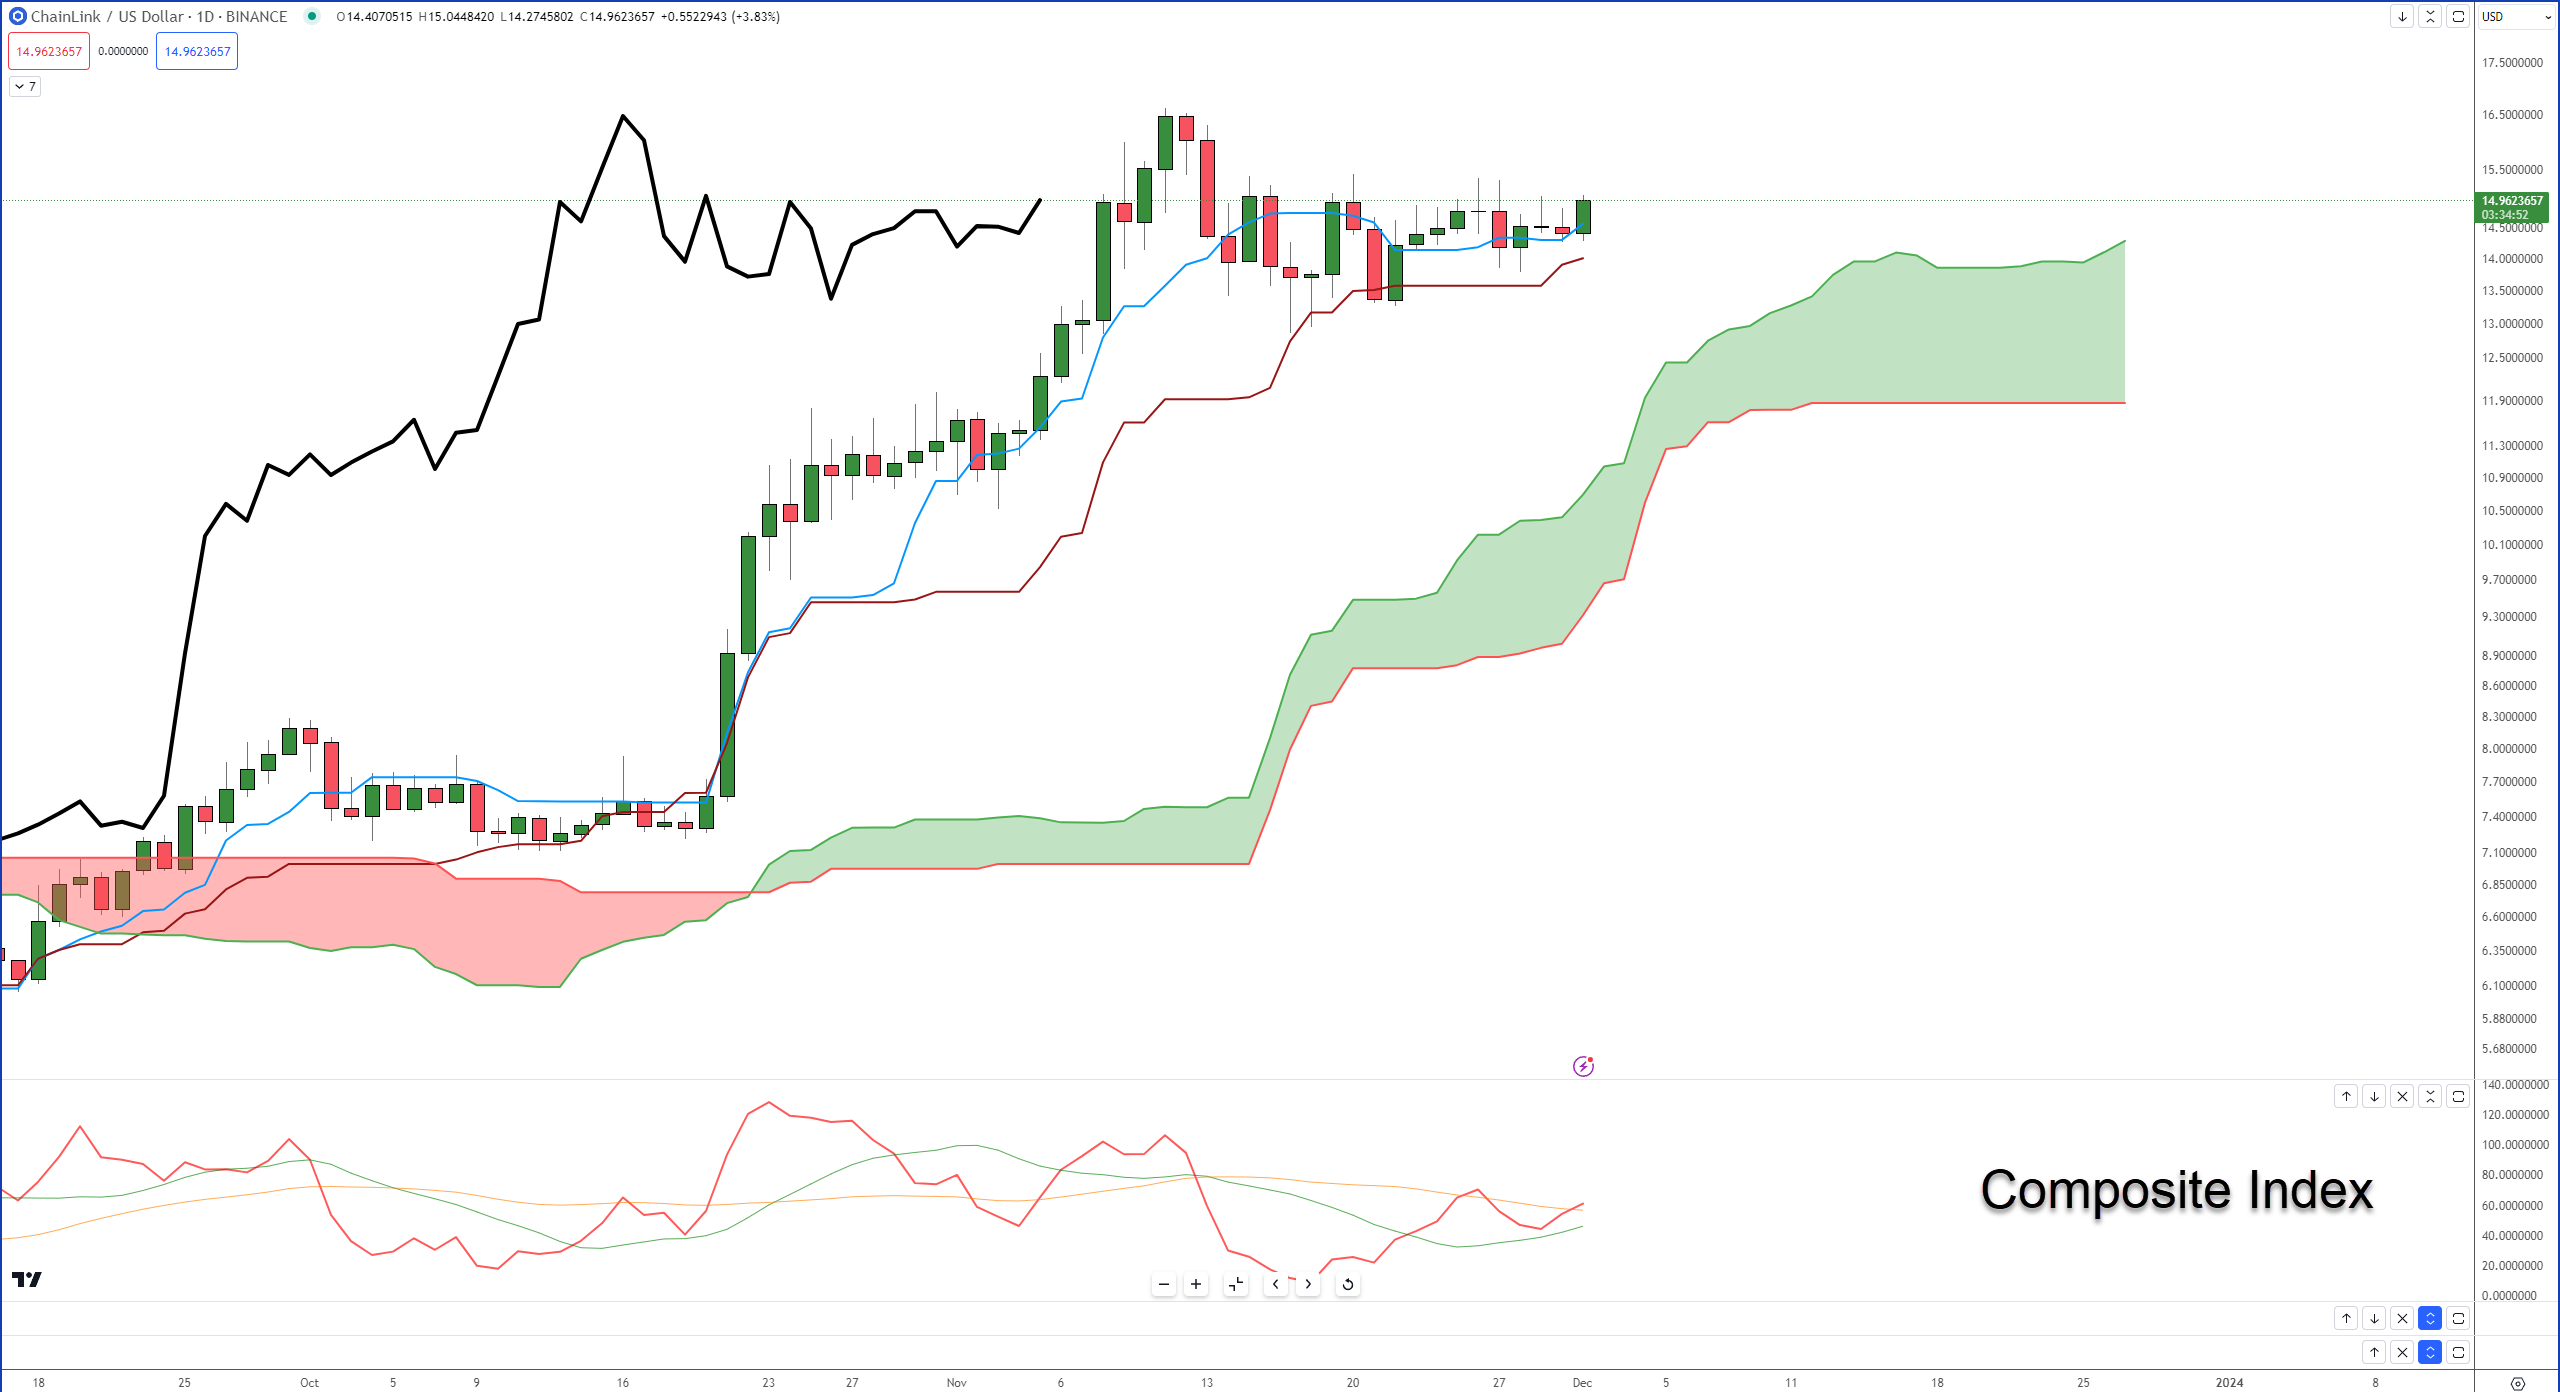
Bulls are working on the highest close in over two weeks, and because the Composite Index just crossed above its slow-moving average, momentum hasn’t really begun to come in yet.
But, like Cardano, the weekly chart warns of caution.
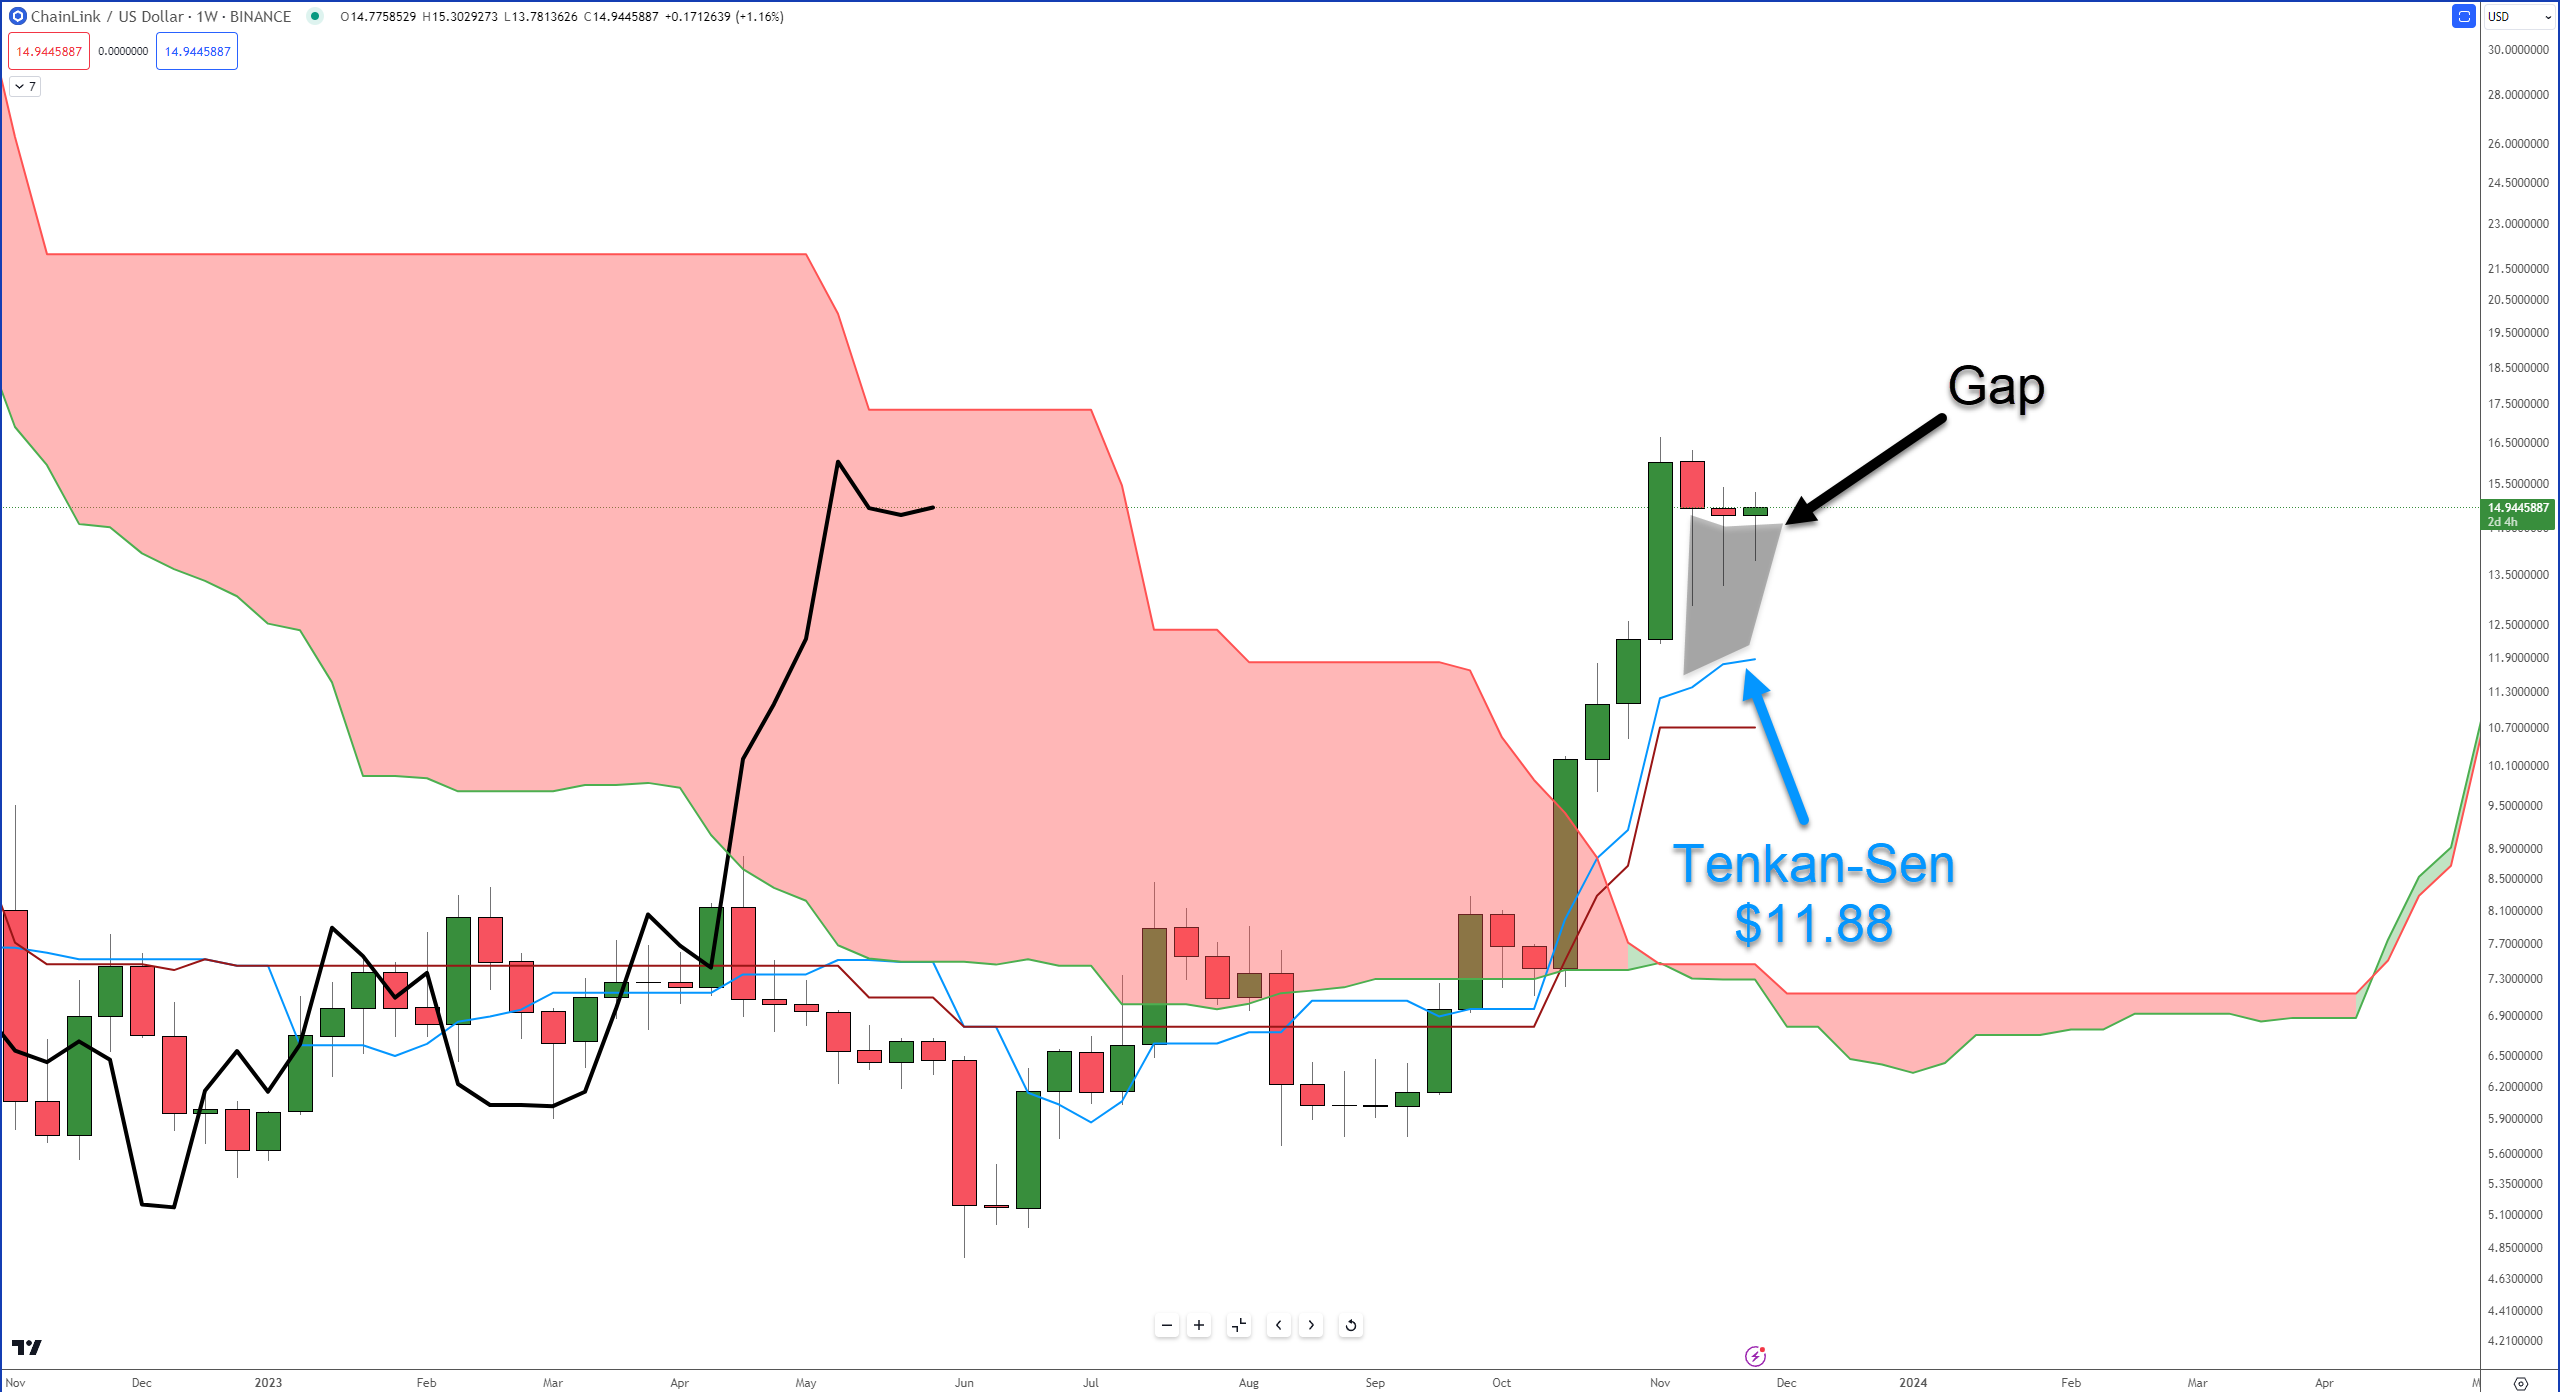
Depending on how long you’ve been reading the Litepaper, you’ll know I keep a strong focus on gaps between candlestick bodies and the Tenkan-Sen because those gaps often correct quickly.
So if you’re looking at the daily and things seem bullish as hell, but nothing is happening, take a peak at the weekly chart. 🔭