Bitcoin hit $54,000, bla bla bla, and Ethereum hit $3,200. Yes, that’s awesome, but if you’re like me, I want to know what hasn’t moved yet or is about to break out or, even more importantly, what might be hitting some profit-taking/reversal zones. 💡
Also, if you want to learn, check out our Ichimoku 101 article here, or watch this instructional video here.
Make sure to check out the screenshots, too, because there are price levels of importance that analysts and traders have identified as important.
yearn.finance
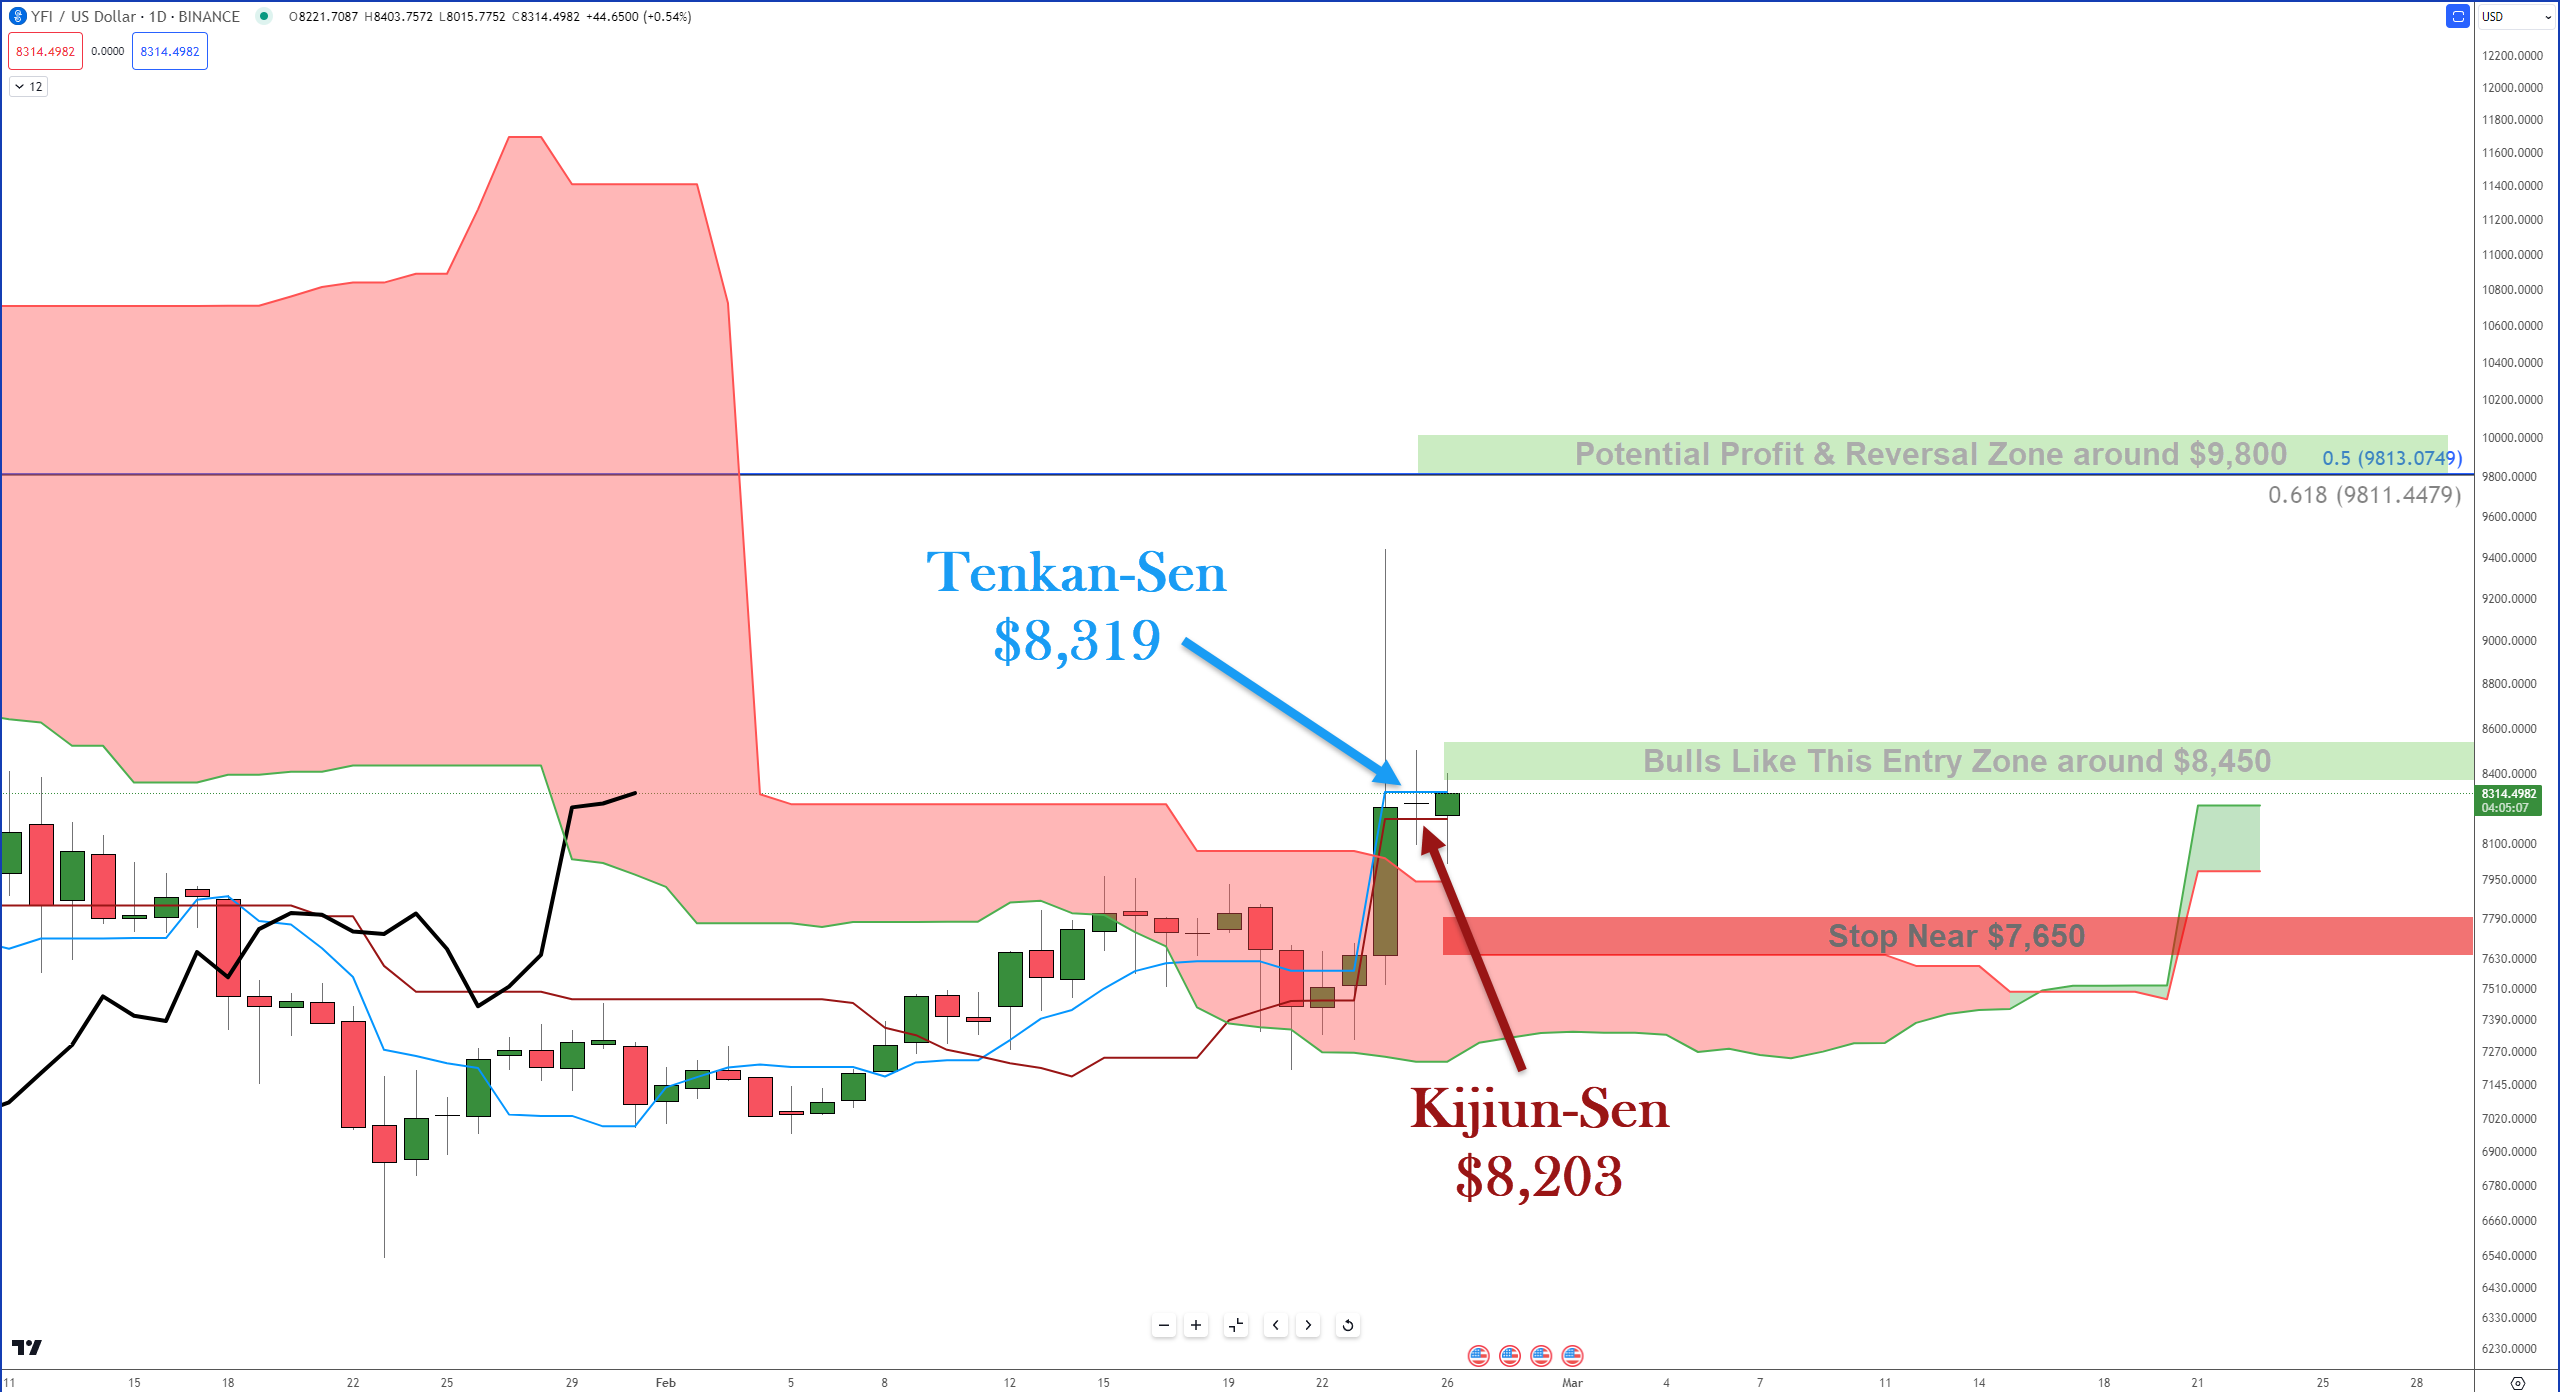
If you want to go dumpster diving for treasure, this might be one. On Saturday, $YFI looked poised to complete the first Ideal Bullish Ichimoku Breakout on the daily chart since October 23, 2023. However, it failed to close above the Tenkan-Sen.
Yesterday, the same thing happened. Bulls are likely looking for anything close above the daily Tenkan-Sen, but because of a strong confluence zone of Fibonacci levels in the $8,441 value area, above that might be more attractive. Also, note the Kumo Twist that occurs between March 16 and 17. If YFI is trending strongly around that date, look for a change in direction. 🔦
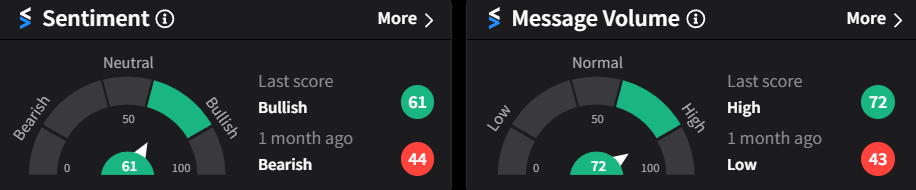
Stocktwits Social Sentiment Data for YFI
Mina
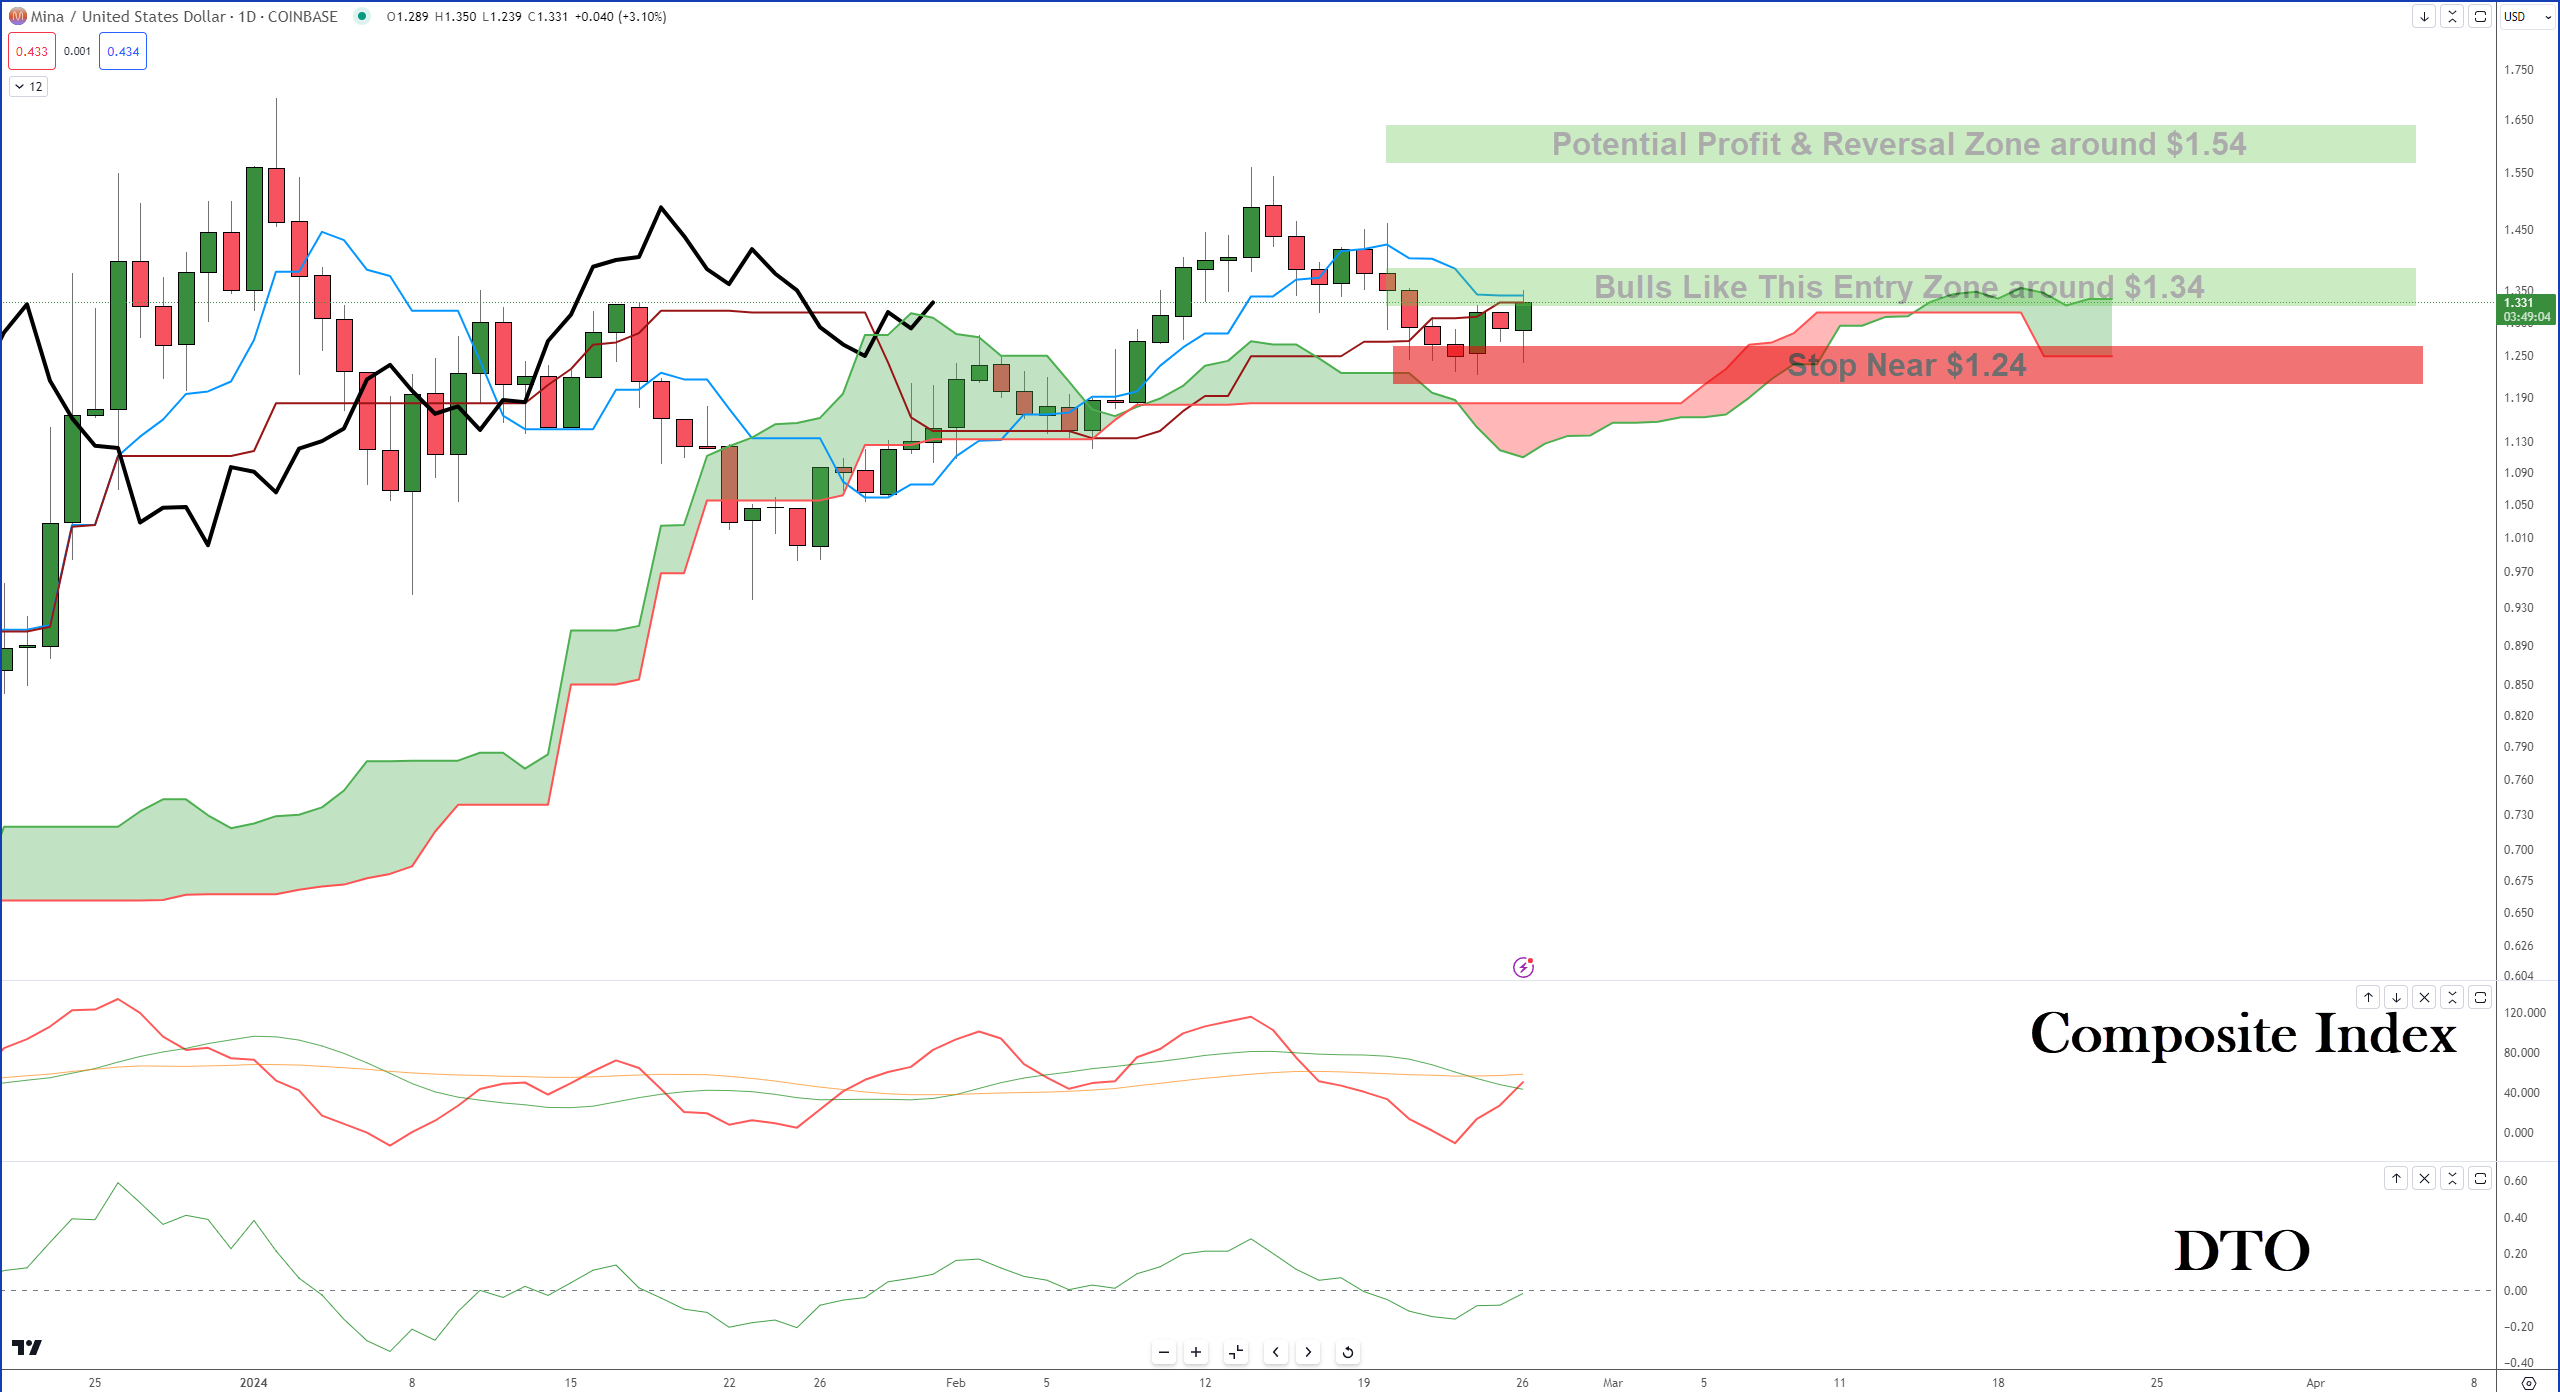
$MINA‘s daily chart shows a great example of a developing continuation move. The only thing missing is a daily close above the Tenkan-Sen and Kijun-Sen.
The Composite Index has crossed above its fast average, and if the momentum continues, it will move above its slow average as well – all of this after developing a hidden bullish divergence.
Additionally, the Detrended Price Oscillator’s angle suggests it’s about to cross above the zero line. Confirmation is key, and things only look good if bulls can pull off a close at or above $1.344.
Upside potential may be limited to a prior resistance area near $1.54. #️⃣
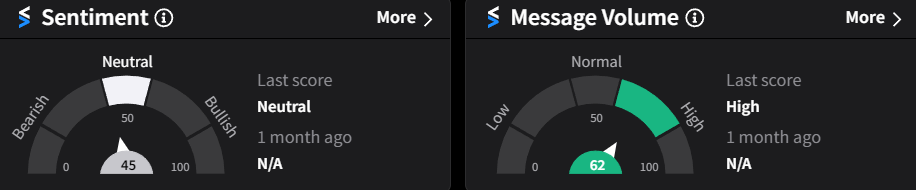
Stocktwits Social Sentiment Data for MINA
Injective Protocol
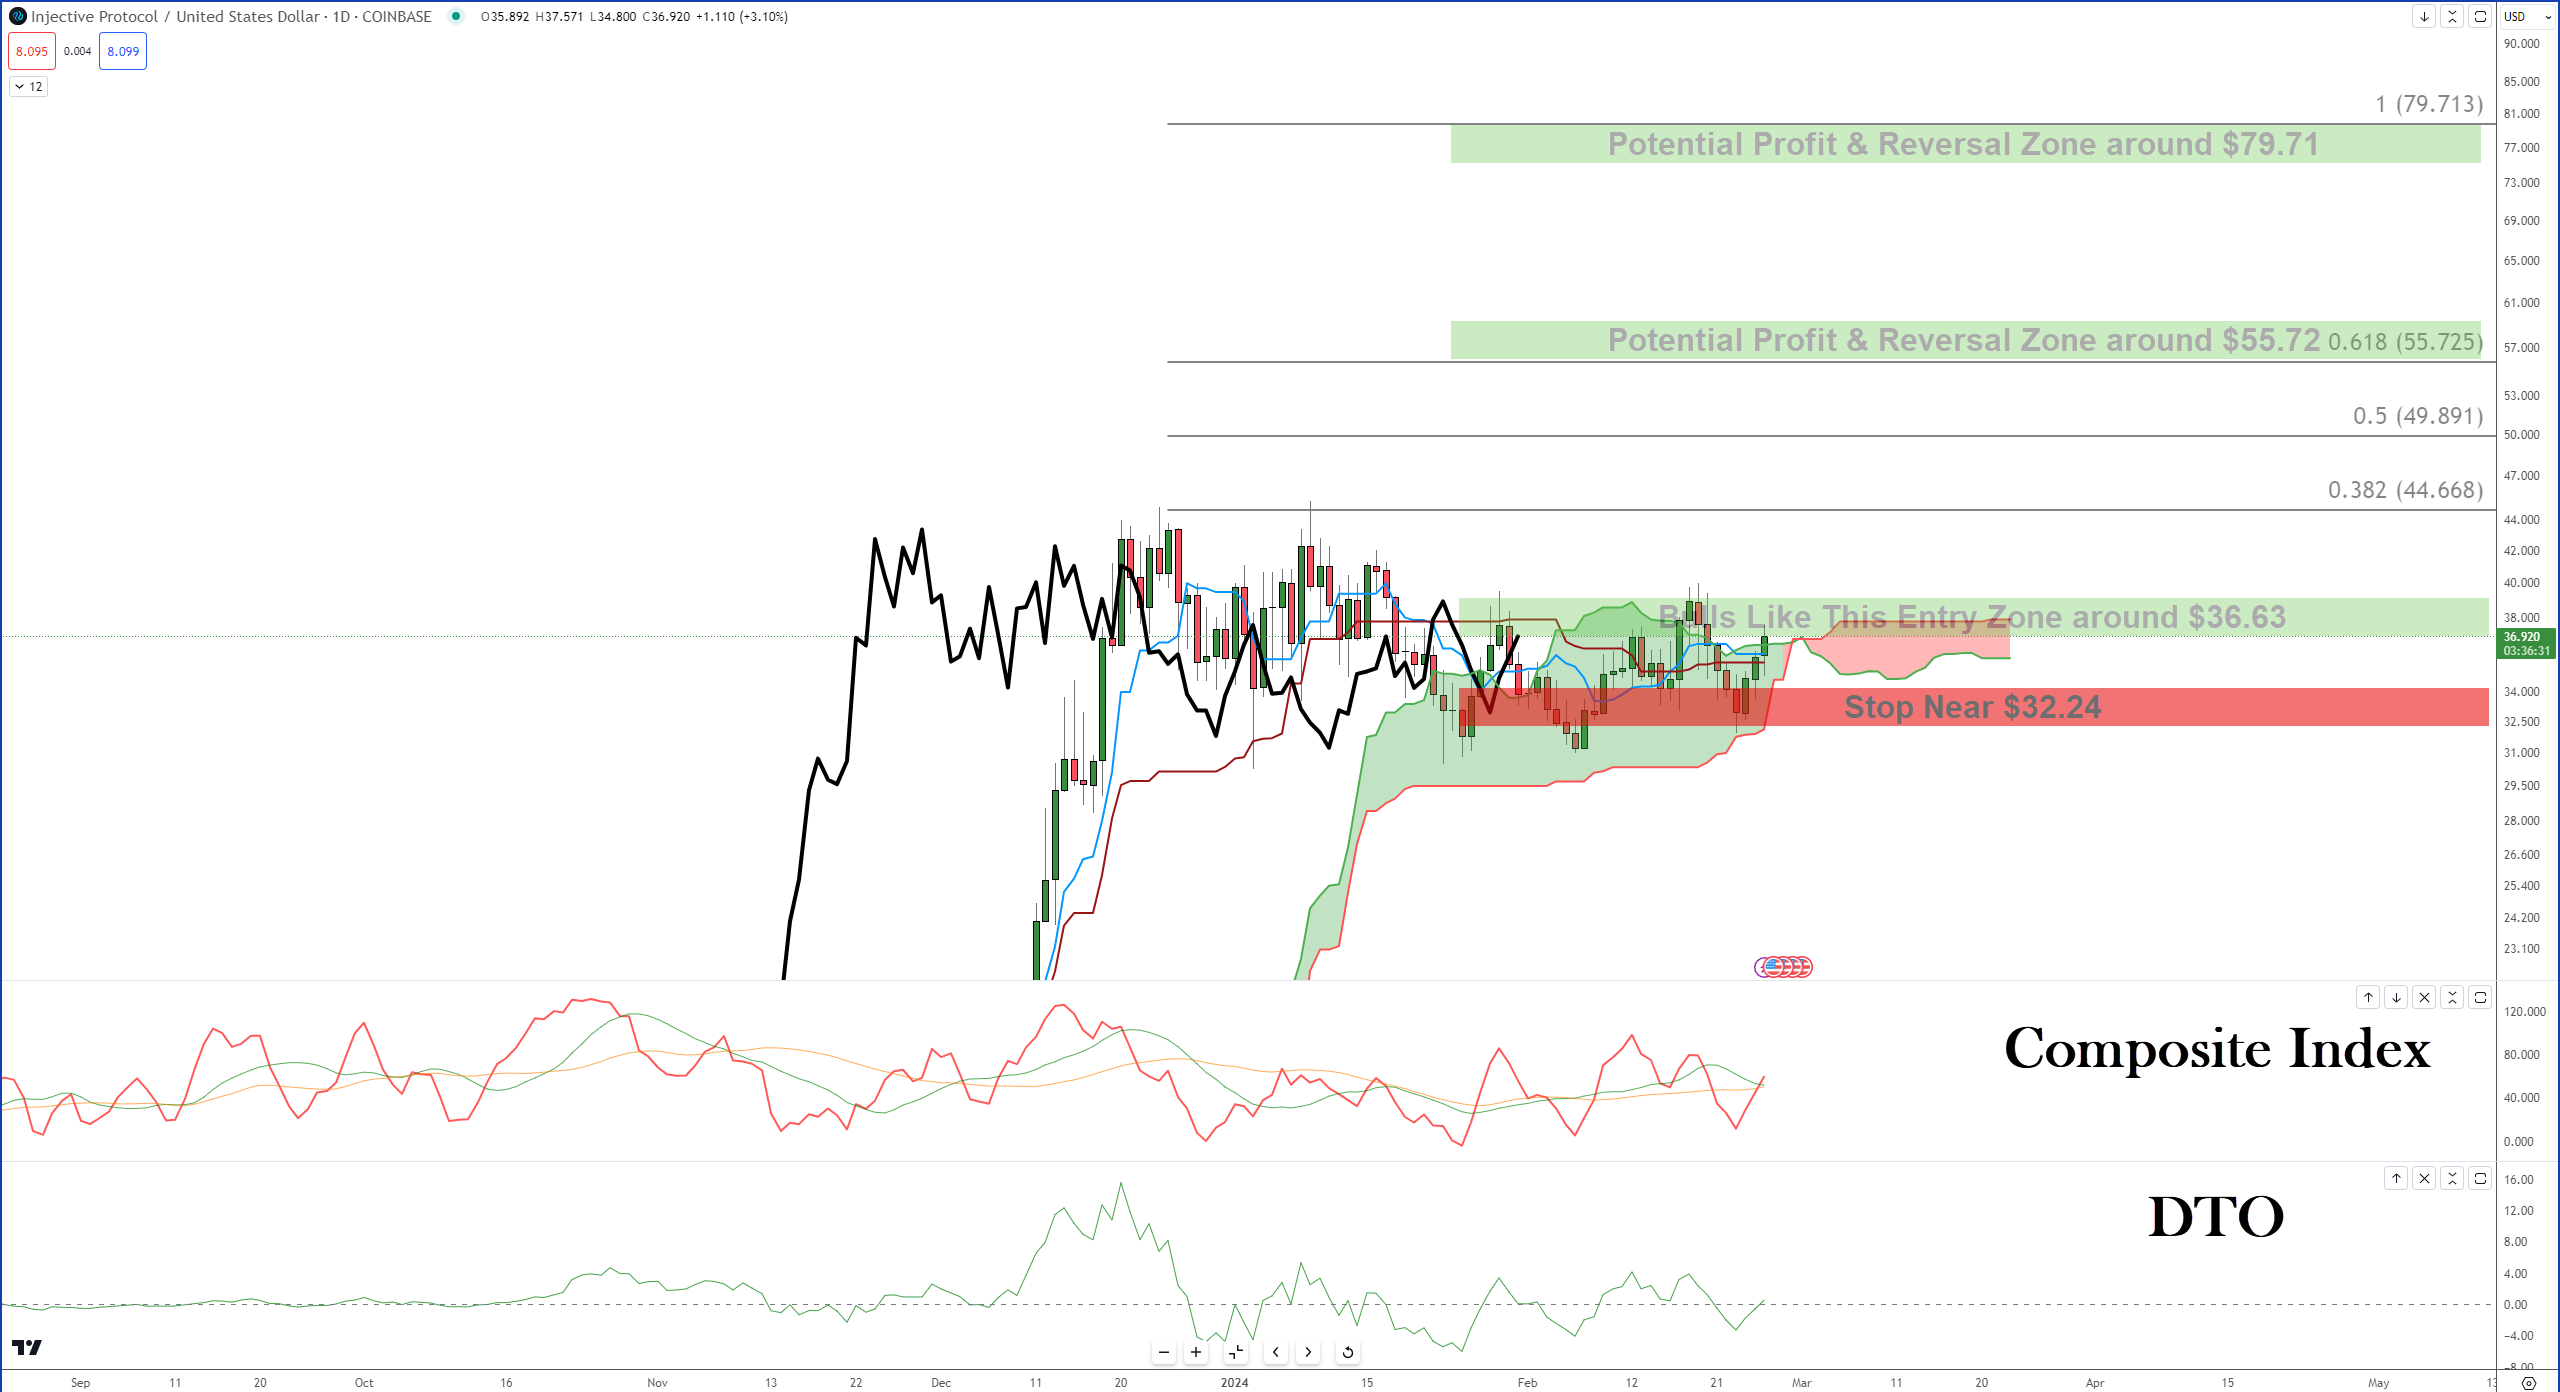
It’s easy to forget that this monster of a mover gained $2,880% and was 2023’s best performer. It’s easy to forget because $INJ‘s been in a long consolidation zone since Christmas.
INJ is positioned perfectly for an Ideal Bullish Ichimoku Breakout – I mean it’s one of the most perfect setups you can find. However, the same thing happened on February 18, but without any follow-through from buyers.
Will this time be any different? The proximity to the Kumo Twist suggests the answer is: yes. Complimenting the price action on any confirmed close at or above $36.63 are the Composite Index and Detrended Price oscillators, which would support any strong breakout. 👍
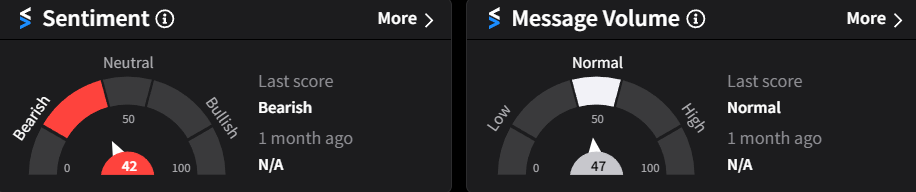
Stocktwits Social Sentiment Data for Injective Protocol