Inflation’s Downward Path Remains Volatile

Today’s consumer price index showed inflation rose more than expected in January. 📝

Headline inflation rose by 0.5% MoM and 6.4% YoY (vs. the 0.4% and 6.2% expected). Stripping out food and energy, core CPI rose 0.4% MoM and 5.6% YoY (0.1% higher than expected). 🔚

Driving those increases were two things. ✌ïļ

First, energy prices rose 2% MoM, and food prices rose 0.5% MoM. Those numbers are typically volatile and not something the Fed is too focused on. Within the core CPI number, rising shelter costs contributed a good portion of the gain…but those numbers involve a significant lag. âēïļ

As a result, many market participants and the Fed are looking at “super-core” inflation, which takes out shelter prices. That value rose just 0.2% MoM and 4% YoY. The argument is that this way of looking at inflation is a lot more reflective of the prices the Fed can directly impact through its policy. And for now, those are headed in the right direction.

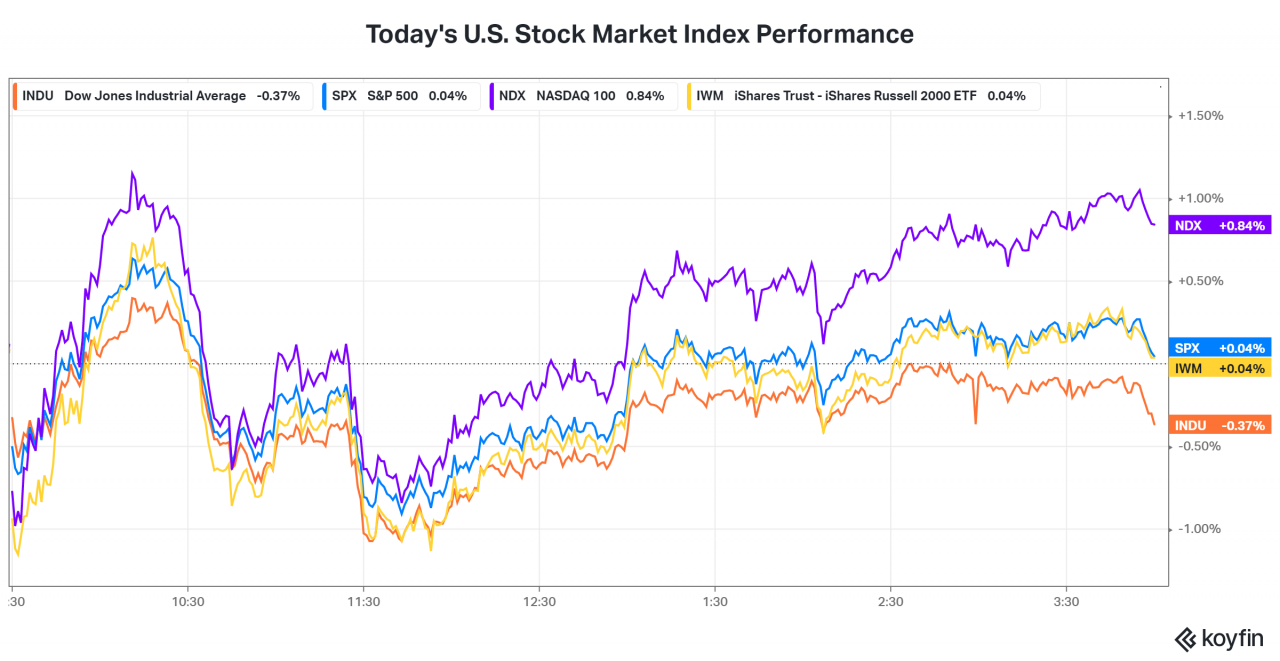
That’s likely why the stock market’s initial reaction was to sell off. Meanwhile, the bond market is no longer pricing in any rate cuts in 2023. Instead, it sees a terminal rate between 5% and 5.25%, where it’s likely to stay until more progress is made on inflation.

Overall, the stock market continues to err on the side of optimism. Leading today’s gainers was the tech-heavy Nasdaq index. 👍

Now we wait to see if the producer price index on Thursday indicates a similar trend. ⌚
More in   Economy

View All

Producer Prices’ Third Straight Rise

After twelve straight months of year-over-year declines, producer prices have stabilized and are back on the rise these last three months. That, combined with the stickiness in core consumer prices, has investors wondering if inflation could return from the dead. 😎

The headline producer price index (PPI) rose 0.5% MoM and 2.2% YoY in September. Excluding food and energy, core PPI rose 0.3% MoM as services drove the larger-than-expected increase. 🔚

Read It

Gas Rules Everything Around Me (G.R.E.A.M)

It was another closely watched day of economic data, with investors focused on employment and consumer sentiment. 👀 

Unlike the JOLTs data and ADP employment report that signaled a continued slowdown in the labor market, today’s nonfarm payrolls bucked the trend again. The economy added 199,000 jobs in November, beating estimates of 190,000 and October’s 150,000 figure.

Read It

A Divergence In Homebuilders

Today’s National Association of Home Builders/Wells Fargo Housing Market Index experienced its first negative reading in seven months. ðŸ”ŧ

The index dropped 5 points to 45 in September, with all three components declining. Current sales conditions slipped to 51, sales expectations in the next six months fell to 49, and buyer traffic dropped to 30.

Read It

Job Market Continues Cooling

The U.S. labor market continues to cool, which is great news for the Federal Reserve and its 2% inflation goal. While we’ll get more employment data in the days ahead, the November Job Openings and Labor Turnover Survey (JOLTs) report was significant.

From a job openings perspective, they fell to their lowest level since March 2021 at 8.79 million. That pushed the ratio of job openings to available workers down to 1.4:1, well off its peak of 2:1, where it sat for most of 2022. 📊

Read It