Welcome to the Stocktwits Crypto Data Dive for Week 10 of 2023!
This data-centric issue aims to keep track of the overall crypto market’s progress and highlight new and old trends. 🤩
The Stocktwits Crypto Data Dive serves three main purposes:
- Tracks the crypto total market cap every week.
- Tracks the 25 best-performing cryptocurrencies of the week.
- Tracks the top 10 cryptocurrencies in each of the three best-performing indices of the week. Our custom indices include “Proof of Work,” “Web 3,” “Smart Contracts,” and more!
There are a couple of big changes in the Crypto Data Dive:
- All eleven indices are listed according to their weekly performance (instead of just the top three and the biggest loser).
- All indices have been rebalanced – so you’ll notice a big difference in the RRGs compared to last week.
So without further adieu, let’s get into the data from week 10:
Total Market Cap
Total Market Cap Update
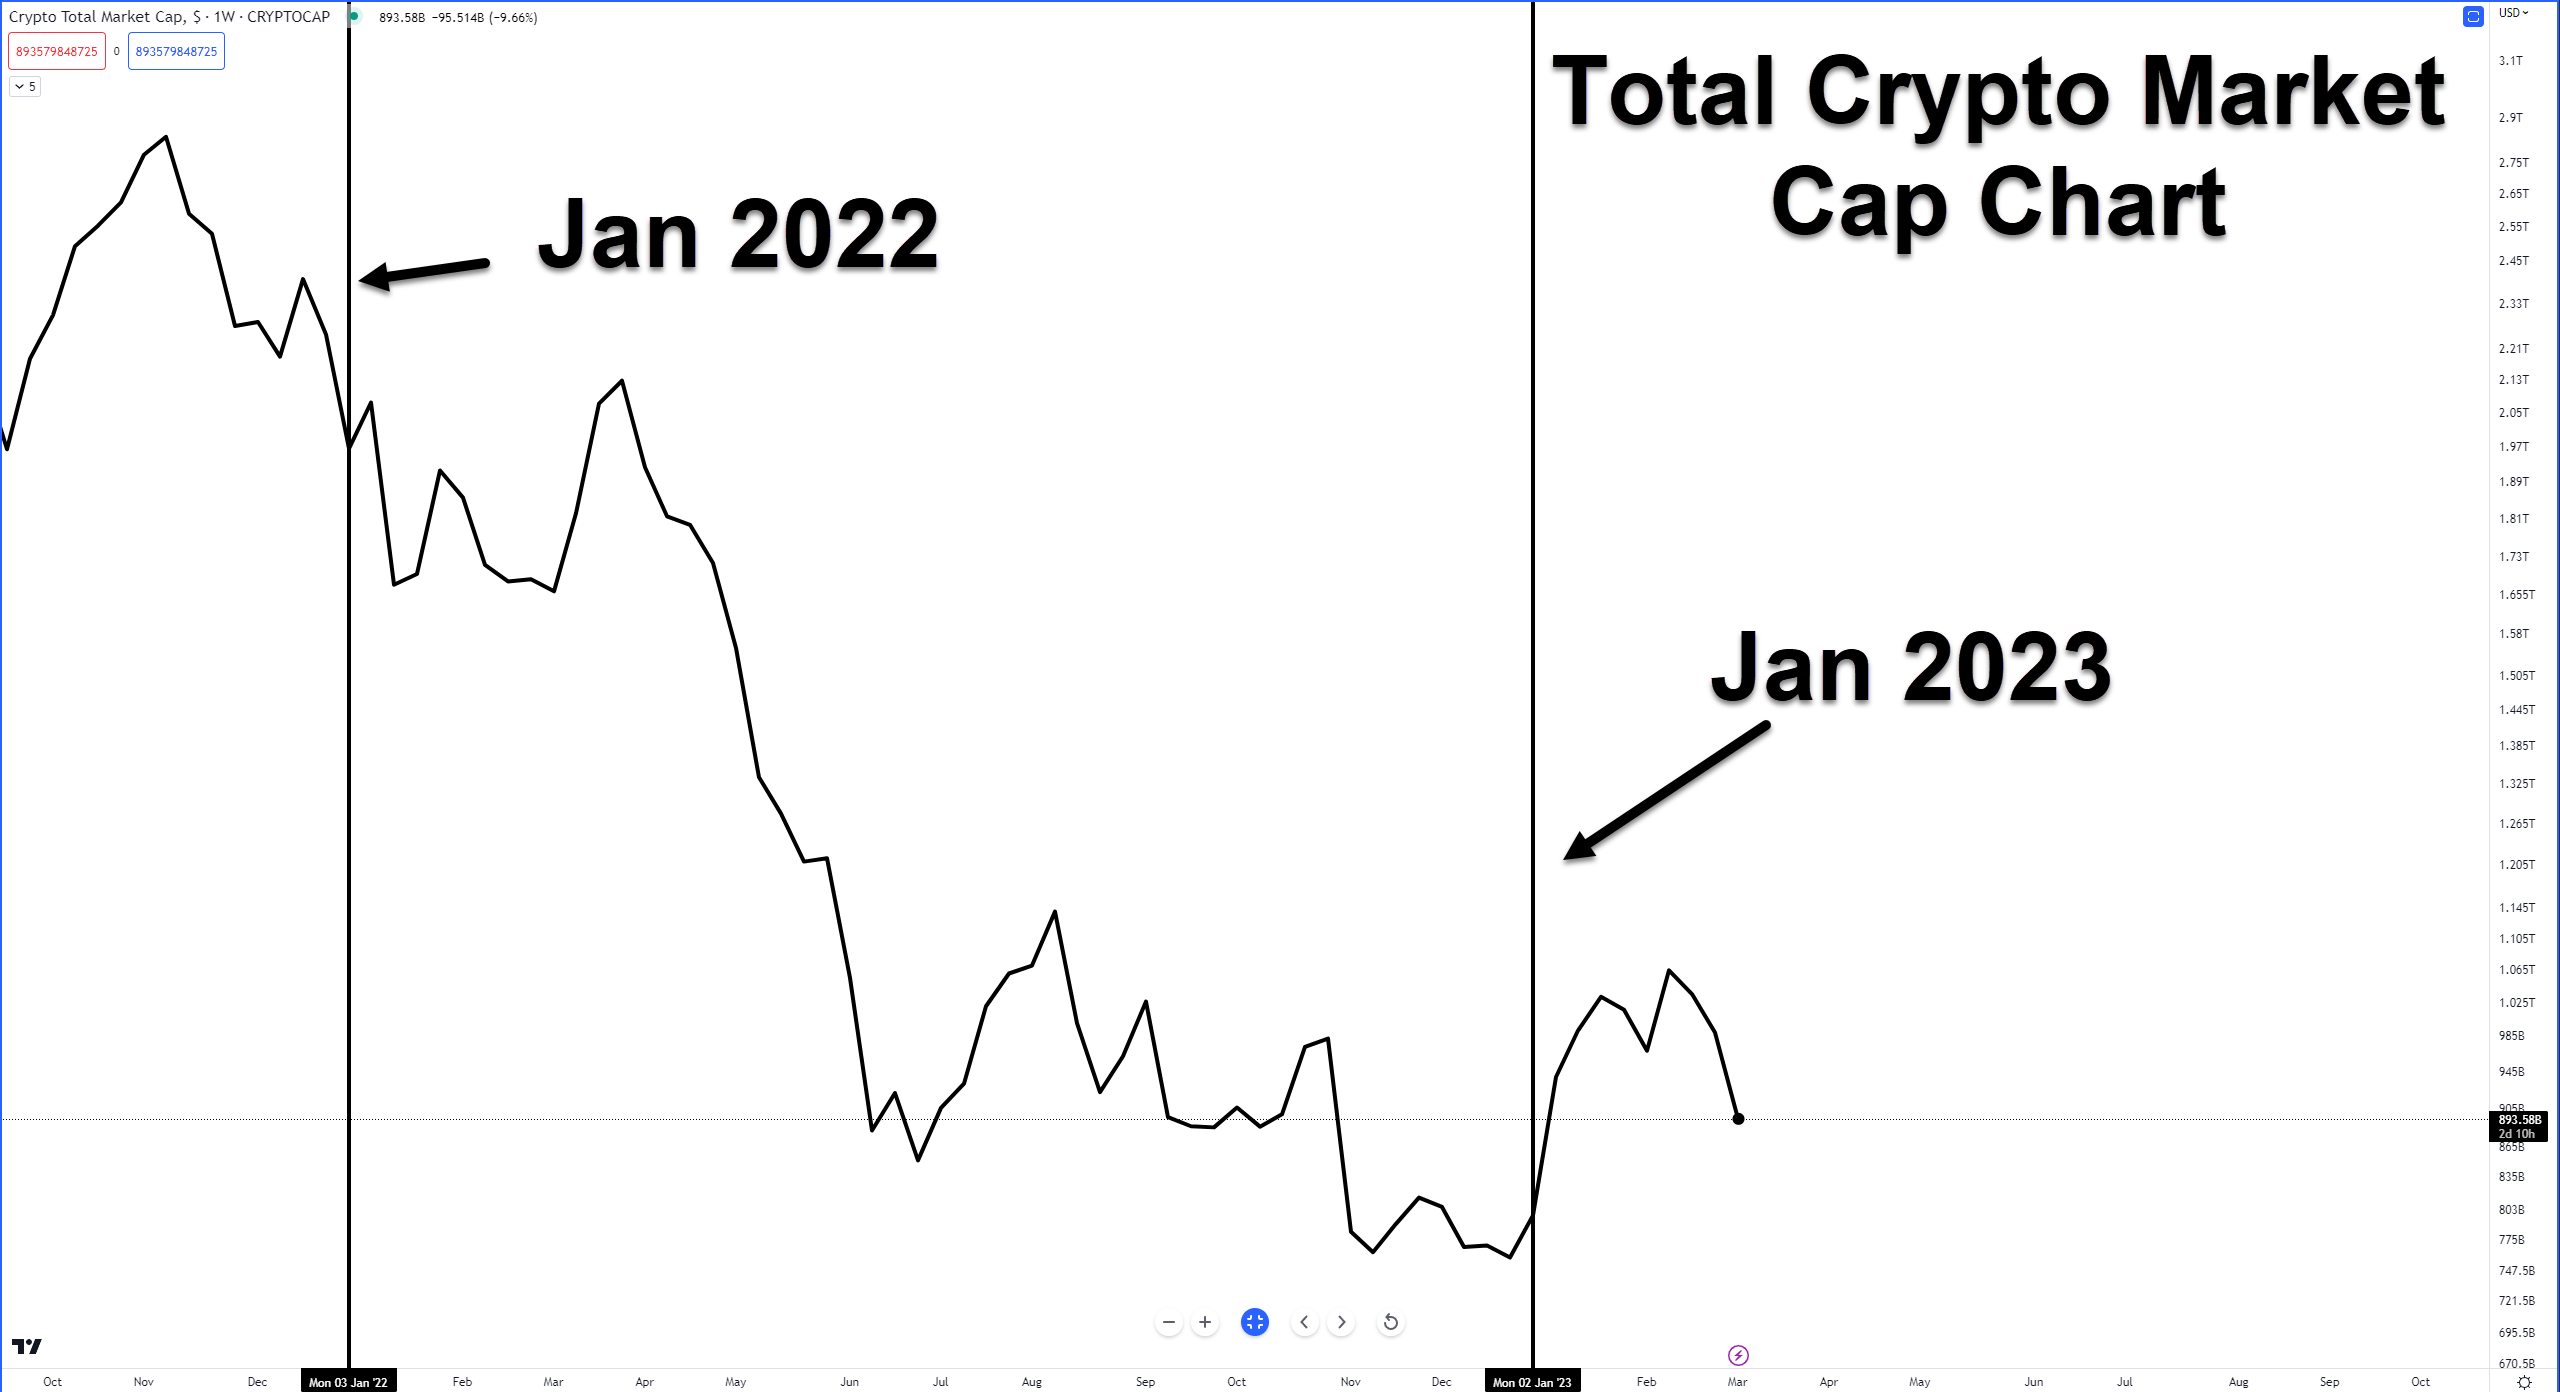
What is the broader trend within the crypto market? The simplest way to track that is using a total market capitalization chart. So let’s see what we’ve got. 🔭
From the highest all-time market cap close of $2.834 Trillion, crypto is down -68.41%, versus -63.37% from last week.
Week 10 is the worst performing week for crypto in 2023 so far, down -10.33%.
*the price levels and performance values may be very different from what you read in your mailbox vs. what’s happening in the live market. This is especially true when crypto faces a new bull or bear run.
Top 25 Cryptocurrencies
Top 25 Cryptocurrency Update
There were ten changes in the Top 25 this week.
In: $ALGO, $ATOM, $AVAX, $DOT, $FIL, $HBAR, $ICP, $MATIC, $NEAR, and $VET.
Out: $AAVE, $AXS, $EOS, $FLOW, $GRT, $LTC, $LUNC, $SOL, $STX, and $THETA.
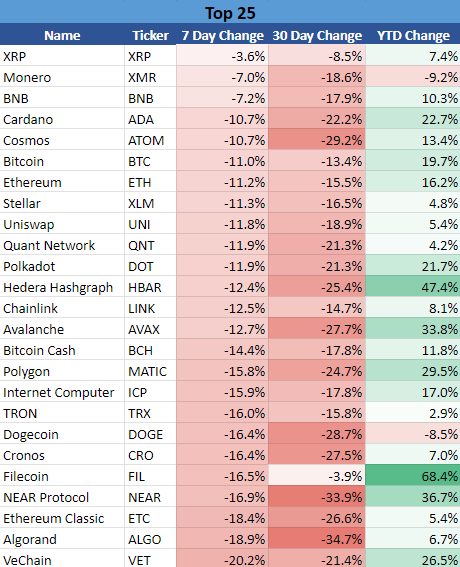
Overall, the Top 25 cryptocurrencies were down for the week, down by -11.1% versus -2.6% prior. 👍
*The universe used to construct the Top 25 list consists of all cryptocurrencies with at least $1 billion in market cap, excluding stablecoins.
Stocktwits Crypto Index RRG
Stocktwits Crypto Index RRG
Relative Rotation Graphs (RRG) are useful visual tools to identify how an instrument or a sector performs against a benchmark. The RRG image below shows eleven customized crypto indices. Each contains the top ten by market cap (excluding stablecoins and some exchange-based tokens).
They are rebalanced monthly, and the RRG tracks the last seven days’ performance.
Without going into the nitty-gritty details, the four colored sectors can be thought of like this, so imagine you’re in a race:
- Leading Quadrant (green) – You are in 1st, 2nd, or 3rd place. You are leading the pack. You’re going to medal. Anthems will be sung, tears will fall, and you may or may not pass a doping test.
- Weakening Quadrant (yellow) – You’re losing your momentum and out of breath. You just realized that your spouse or your mom didn’t show up to watch you, sapping your enthusiasm. You’re falling back and in the middle of the pack.
- Lagging Quadrant (red) – You pulled a hamstring. You pulled a Michael Scott and ate five pounds of fettuccine alfredo an hour before your race. You fell down. You’re dead last. No anthems will be sung, but tears will fall, and no one will remember your name.
- Improving Quadrant (blue) – You see your spouse or your mom in the stands. The crowd starts to see you get up. Emotional music begins, and the camera pans to the crowd in slow motion. You’re back on your feet and in the middle of the pack, gaining on the leaders.
Because all of the indices were rebalanced, you’ll notice things look at a lot more dramatic compared to last week.
To say there have been some major moves since the beginning of 2023 is an understatement – especially intra-index.
Some analysts interpret the current RRG like this: strong momentum, strong sentiment, and bullish as hell.
The GIF below shows the past seven weeks of movement on the RRG.
A.I.
1. A.I. Index
The A.I. Index comprises cryptocurrencies dedicated to making the Battlestar Galactica, 2001 Space Odyssey, I Robot, and the Terminator universes very real.
We construct this index by limiting the assets in this space to a minimum market cap of $20 million.
There were no changes to the assets in the index this week.
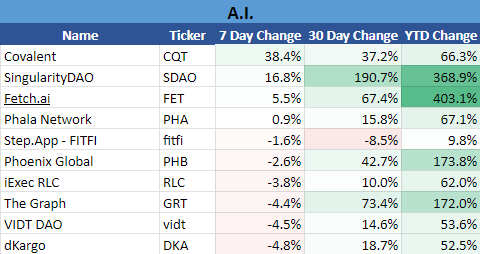
Current week’s performance: -3.3%
Last week’s performance: +2.9%
Proof-Of-Work
2. Proof-Of-Work Index
The Proof-Of-Work Index is a collection of cryptocurrencies that, you guessed it, are blockchains that use Proof-Of-Work as their primary consensus mechanism. Bitcoin is the most well-known and biggest Proof-Of-Work cryptocurrency.
We construct this index by limiting the assets in this space to a minimum market cap of $100 million.
There were 3 major changes this week.
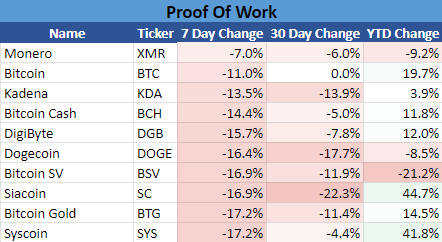
Current week’s performance: -11.4%
Last week’s performance: -2.47%
Smart Contracts
3. Smart Contracts Index
The Smart Contracts Index includes cryptocurrencies whose blockchains allow for smart contracts. Ethereum and Cardano would be examples of cryptocurrencies that fall into this index.
We construct this index by limiting the assets in this space to a minimum market cap of $250 million.
70% of the assets in this index were swapped this week!
Out: $CSPR, $LUNC, $MINA, $XEM, $EOS, $STX, and $TRX.
In: $ADA, $ATOM, $AVAX, $DOT, $HBAR, $KSM, and $XRD.
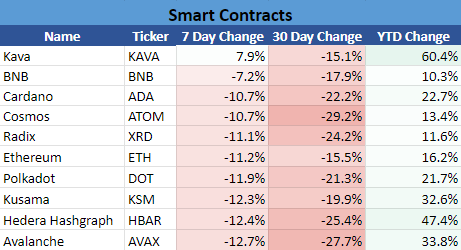
Current week’s performance: -11.5%
Last week’s performance: -2.5%
Privacy
4. Privacy Coins/Tokens Index
Privacy coins/tokens are cryptocurrencies that either focus on creating complete anonymity with transactions or offer anonymity as an option when performing transactions.
We construct this index by limiting the assets in this space to a minimum market cap of $10 million.
There were two major changes this week.
$HOPR and $RAIL replaced $LOKI and $PIVX.
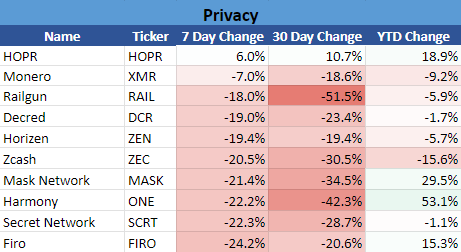
Current week’s performance: -11.8%
Last week’s performance: -2.9%
DEX
5. Decentralized Exchange Index (DEX)
The DEX Index (Decentralized Exchange) comprises the cryptocurrencies and tokens that make up the DEX space.
We construct this index by limiting the assets in this space to a minimum market cap of $100 million.
There were two major changes this week.
$SUSHI and $LRC replaced $DYDX and $ZRX.
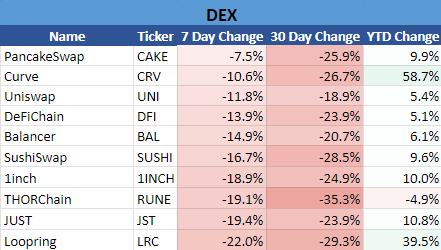
Current week’s performance: -%
Last week’s performance: -3.8%13.8
Lending
6. Lending Index
The Lending Index comprises cryptocurrencies and platforms where users can offer their cryptocurrency for liquidity or loans for a return.
We construct this index by limiting the assets in this space to a minimum market cap of $50 million.
There were 2 major changes this week.
$MFT and $XVS replaced $ACA and $COMP.
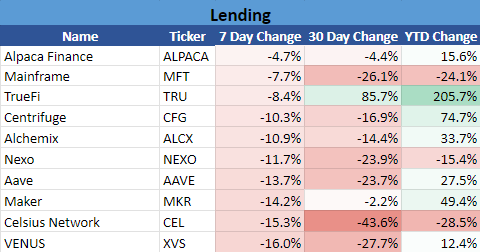
Current week’s performance: -14.2%
Last week’s performance: +0.7%
DeFi
7. Decentralized Finance (DeFi)
The DeFi Index (Decentralized Exchange) comprises the cryptocurrencies and tokens that make up the DeFi space. Cryptocurrencies such as Curve Finance, yearn.finance, and Clover are examples of assets that make up this index.
It’s not uncommon to see cryptos that also the DEX Index also in the DeFi Index.
We construct this index by limiting the assets in this space to a minimum market cap of $200 million.
There were fiver major changes to the index this week.
In: $AAVE, $CRV, $DFI, $JEWEL, and $XRD.
Out: $BAL, $DYDX, $SNX, $YFI, and $ZRX.
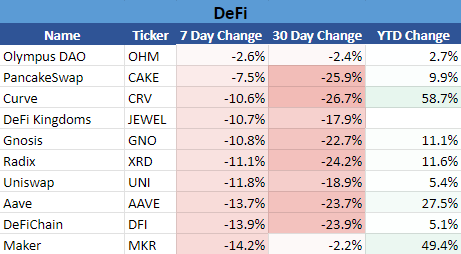
Current week’s performance: -14.4%
Last week’s performance: -2.4%
Proof-Of-Stake
8. Proof-Of-Stake Index
The Proof-of-Stake Index includes any cryptocurrency that has a Proof-of-Stake consensus mechanism.
We construct this index by limiting the assets in this space to a minimum market cap of $100 million.
70% of the assets in the index changed this week!
In: $ADA, $AVAX, $DOT, $HBAR, $KSM, $MATIC, and $XTZ.
Out: $ARDR, $CSPR, $FET, $GRT, $MINA, $NMR, and $RUNE.
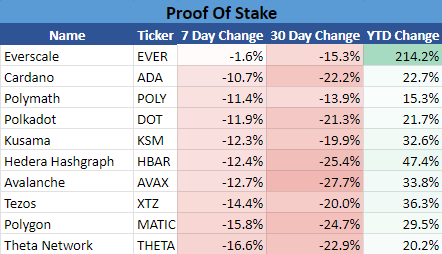
Current week’s performance: -15.3%
Last week’s performance: -9.0%
Web 3
9. Web 3 Index
The Web3 Index comprises cryptocurrencies focusing on the next generation of the internet: blockchain, publicly distributed ledgers, transparency, openness, decentralization, and tokenonomics.
$LINK.X and $GNT.X are examples of assets in this category.
We construct this index by limiting the assets in this space to a minimum market cap of $50 million.
There were six major changes this week.
In: $ENS, $FIL, $HNT, $LINK, $BIT, and $LPT.
Out: $CVC, $FET, $MASK, $NU, and $STX.
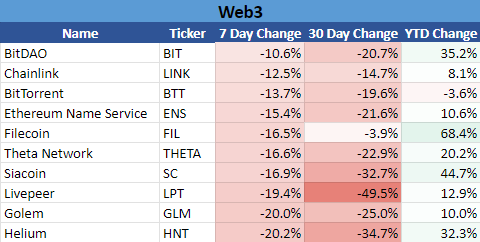
Current week’s performance: -18.6%
Last week’s performance: -5.2%
NFT
10. The NFT Index
The NFT Index is made up of cryptocurrencies that offer non-fungible tokens.
We construct this index by limiting the assets in this space to a minimum market cap of $50 million.
70% of the assets in this index changed this week.
In: $GALA, $GHST, $LYXE, $MANA, $MC, $RARE, and $UOS.
Out: $ALI, $JEWEL, $IMX, $ILV, $AXS, $FLOW, and $GODS.
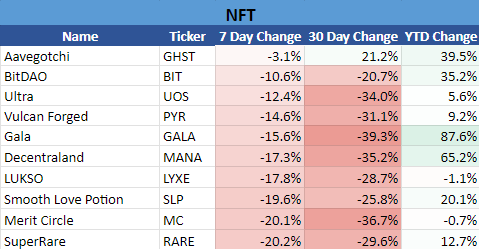
Current week’s performance: -18.9%
Last week’s performance: -6.7%
Metaverse
11. Metaverse Index
The Metaverse Index is a collection of cryptocurrencies that focuses on virtual worlds and environments, including the Play 2 Earn and gaming class of cryptocurrencies.
We construct this index by limiting the assets in this space to a minimum market cap of $10 million.
There were two changes in the index this week.
$MC and $UOS replaced $GOG and $ILV.
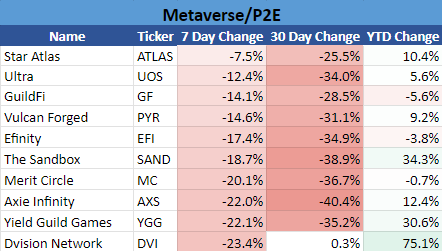
Current week’s performance: -20.2%
Last week’s performance: -8.2%
Summary
Putting It All Together
So far, week 10 is the worst-performing week for crypto in 2023.
Surprisingly, despite the massive amount of regulatory FUD and banking FUD, most of the market is still up YTD.
Additionally, on-chain metrics show whale wallets have been buying at these multi-week lows and adding to their positions.
Given the collapse or near collapse of some important banks in the crypto space, it will be very interesting to see if capital flees the space altogether, or, as we’ve seen occur since 2022, move into the decentralized areas of crypto.
Let’s see what the rest of the month of March looks like!
See You Next Saturday!

Credits & Feedback
Today’s Litepaper was written by Jon Morgan. Let him know how he did: