Advertisement|Remove ads.
Bulls Struggle At 20-Day EMA: SEBI RAs See Short-Term Range Of 25,000–25,500 For Nifty


The Nifty 50 ended on a muted note on Wednesday but managed to sustain its short-term uptrend by forming a higher low for the second consecutive day. The index held the 25,200 mark.
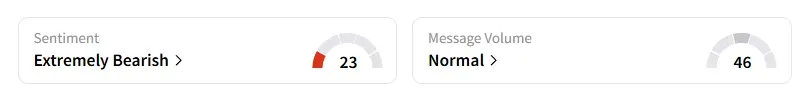
However, data on Stocktwits shows that retail sentiment has turned ‘extremely bearish’ on the Nifty.
SEBI-registered analyst Mayank Singh Chandel noted that the price action reflected indecision through a small-bodied bullish candle with long lower and minor upper shadows. The 25,250–25,300 zone remains a critical resistance area. A decisive close above this band could pave the way for a move toward 25,500, he added.
Advertisement|Remove ads.
On the downside, 25,100–25,000 continues to offer firm support, protecting against deeper declines. The 20-day Exponential Moving Average (EMA) at 25,250 is acting as a cap on the upside; a breakout above it is essential for directional clarity.
The Relative Strength Index (RSI) at 51.05 indicates ongoing consolidation, lacking strong momentum in either direction. Derivatives data shows maximum Call writing at 25,250 (resistance pressure) and maximum Put writing at 25,150 (immediate support).
Chandel concluded that the Nifty is likely to remain rangebound between 25,000 and 25,500 unless a breakout above 25,300 confirms strength. He advised watching for price behavior around 25,250–25,300, which is termed the make-or-break zone in the short term. A dip toward 25,100–25,000 can be used as a buying opportunity if defended with strength.
Advertisement|Remove ads.
He identified resistance at 25,250, 25,300, and 25,500, with support at 25,150, 25,100, and 25,000.
Bharat Sharma of Stockace Financial Services observed that the Nifty index failed to surpass the 20-day EMA for the second attempt in two days, which indicated weakness in the bulls. If the index reclaims this level, it could indicate momentum and open the gates for a move towards 25,400 and higher.
Advertisement|Remove ads.
Ahead of the expiry session on Thursday, the Open Interest (OI) data shows an equilibrium between bulls and bears. The Put-Call Ratio (PCR) stands at 0.9, maximum pain is seen at 25,200. At-the-money (ATM) straddle premiums have nearly eroded, now trading in the 95-100 range; both indicators suggest a likely muted expiry session.
Sharma pegged immediate support at 25,180, which, if breached, could lead the index to 25,140, 25,100, 25,060, or 25,000. On the upside, resistance is seen at 25,240-25,550. If the index crosses this level, we can expect a significant upside towards 25,400.
Advertisement|Remove ads.
Analyst Pradeep Carpenter highlighted that according to Central Pivot Range (CPR) data, Nifty’s pivot was at 25,196, with a crucial buy trigger above 25,204 and selling pressure expected below 25,188. Although the index briefly touched a high of 25,255, it failed to convincingly break above the bullish range, ending the session in a "wait and watch" zone. Key resistance levels have been identified at 25,271, 25,330, and 25,405, while support is seen near 25,137 and 25,003.
For Nifty Bank, he identifies resistance levels at 57,317, 57,466, and 57,656, while support levels are located at 56,978, 56,788, and 56,639.
He concluded that both indices are poised for directional moves depending on their CPR breakout. A sustained move above the respective Range 2 levels could trigger bullish momentum, especially if supported by institutional buying and global sentiment. However, failure to cross these levels may result in range-bound or corrective action.
Advertisement|Remove ads.
Carpenter advised traders to stay alert, as volatility is expected and intraday opportunities may arise near the breakout zones. PSU banks appear poised to outperform, while IT stocks may remain under pressure following their earnings.
Analyst Dipak Takodara observed that Nifty is holding above the short-term horizontal support at 25,116 and inching toward the 20-day Simple Moving Average (SMA) at 25,309, which remains an important hurdle. The long-legged Doji candlestick pattern on Wednesday showed market indecision — buyers stepped in at lower levels, but the bulls couldn’t sustain higher prices by close. The absence of follow-through volume suggests that big players are waiting for clearer directional confirmation.
Advertisement|Remove ads.
Takodara said that support remained firm at the 50-day SMA (24,999) and the horizontal zone around 25,116. On the upside, the immediate resistance is seen at the 20-day SMA at 25,309. A sustained move above that could open the path toward 25,330–25,380, which is a critical zone from the previous rectangle pattern.
He concluded that the index is currently in a phase of consolidation with early signs of recovery. If the Nifty manages to close above the 20-day SMA currently at 25,309 in the next session or two, it could trigger a short-term breakout toward higher levels. Until that happens, the short-term view stays neutral to cautiously bullish. At the same time, the medium-term trend remains positively biased as long as the index holds above the 24,500–24,460 support zone.
Advertisement|Remove ads.
For updates and corrections, email newsroom[at]stocktwits[dot]com.
Comments posted here will also appear on symbol pages.
Latest News
/filters:format(webp)https://news.stocktwits-cdn.com/large_Getty_Images_2225993272_jpg_c03859cabc.webp)
/filters:format(webp)https://news.stocktwits-cdn.com/shivani_photo_jpg_dd6e01afa4.webp) Shivani Kumaresan·32m ago
Shivani Kumaresan·32m ago/filters:format(webp)https://news.stocktwits-cdn.com/large_spacex_jpg_0ee570830f.webp)
/filters:format(webp)https://news.stocktwits-cdn.com/IMG_8805_JPG_6768aaedc3.webp) Deepti Sri·36m ago
Deepti Sri·36m ago/filters:format(webp)https://news.stocktwits-cdn.com/large_Getty_Images_2257538429_jpg_3266ee5580.webp)
/filters:format(webp)https://news.stocktwits-cdn.com/Aashika_Suresh_Profile_Picture_jpg_2acd6f446c.webp) Aashika Suresh·55m ago
Aashika Suresh·55m ago/filters:format(webp)https://news.stocktwits-cdn.com/large_Getty_Images_2285958555_jpg_3b020b5c3e.webp)
/filters:format(webp)https://st-everywhere-cms-prod.s3.us-east-1.amazonaws.com/IMG_9209_1_d9c1acde92.jpeg) Yuvraj Malik·1h ago
Yuvraj Malik·1h ago/filters:format(webp)https://news.stocktwits-cdn.com/large_pharma_stock_jpg_c9a7452f1f.webp) Deepti Sri·2h ago
Deepti Sri·2h ago/filters:format(webp)https://news.stocktwits-cdn.com/large_deckers_resized_jpg_a3426e9db8.webp) Shivani Kumaresan·2h ago
Shivani Kumaresan·2h ago