


Advertisement|Remove ads.
Nifty Weekly Outlook: SEBI RA Sees Negative Bias Unless 25,300 Is Reclaimed


The Nifty 50 closed the previous week on a bearish note, falling by 311 points, and forming a long red candle on the weekly chart.
According to SEBI-registered analyst Mayank Singh Chandel, this is a strong technical sign of seller dominance, particularly after the Nifty index failed to hold above the psychological mark of 25,300 and the 20-day Exponential Moving Average (EMA) on the daily timeframe.
For the first time in several weeks, the index closed below the key support zone of 25,200, raising the risk of an extended correction. Additionally, the technical indicators such as the weekly Relative Strength Index (RSI) and Stochastic Oscillator have both rolled over, trading below their respective signal lines, which indicates weakening momentum and a shift in sentiment toward the downside.
What To Expect This Week
Chandel noted that the break below 25,200 is technically significant. If Nifty sustains below this level, it could trigger further downside toward 25,000, followed by 24,800–24,500, which is a major support cluster from the May-June base.
On the flip side, any rebound above 25,300 could open the door for a quick rally toward 25,500–25,800. However, such recovery would need strong volume support and favorable global cues, he added. The index is likely to oscillate in a wide band of 24,500–25,800, with a negative bias as long as it remains below 25,300.
Key Levels To Watch
Chandel identified resistance at 25,300 and 25,500, with support pegged at 25,000, 24,800, and 24,500.
He concluded that till we see a decisive close above 25,300, the market will remain under pressure. Chandel advised traders to remain cautious with long positions and look for sell-on-rise opportunities near key resistance zones. On the downside, 24,800 will be critical, and any breakdown below that may intensify the weakness.
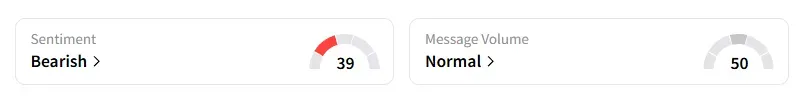
Data on Stocktwits shows that retail sentiment on the Nifty index has flipped to ‘bearish’ from ‘neutral’ last week.
For updates and corrections, email newsroom[at]stocktwits[dot]com.
Latest News
/filters:format(webp)https://st-everywhere-cms-prod.s3.us-east-1.amazonaws.com/large_adam_smigielski_K5m_Pt_O_Nmp_HM_unsplash_f365ee93f4.jpg)
/filters:format(webp)https://news.stocktwits-cdn.com/jaiveer_jpg_280ad67f36.webp) Jaiveer Shekhawat·16m ago
Jaiveer Shekhawat·16m ago/filters:format(webp)https://news.stocktwits-cdn.com/large_trump_jpg_fc59d30bbe.webp)
/filters:format(webp)https://news.stocktwits-cdn.com/Aashika_Suresh_Profile_Picture_jpg_2acd6f446c.webp) Aashika Suresh·34m ago
Aashika Suresh·34m ago/filters:format(webp)https://news.stocktwits-cdn.com/large_Getty_Images_1190665957_jpg_92088206ed.webp) Jaiveer Shekhawat·50m ago
Jaiveer Shekhawat·50m ago/filters:format(webp)https://news.stocktwits-cdn.com/large_Getty_Images_2235337192_jpg_56c00409cf.webp)
/filters:format(webp)https://st-everywhere-cms-prod.s3.us-east-1.amazonaws.com/unnamed_jpg_9dff551b50.webp) Anan Ashraf·51m agoAashika Suresh·1h ago
Anan Ashraf·51m agoAashika Suresh·1h ago/filters:format(webp)https://news.stocktwits-cdn.com/large_Getty_Images_2232147590_jpg_a31aecbfad.webp) Jaiveer Shekhawat·1h ago
Jaiveer Shekhawat·1h ago