


Advertisement|Remove ads.
S&P 500’s Narrow Rally Faces Fresh Tests From CPI, Bank Earnings: 3 Charts To Watch This Week


- The VIX-to-three-month volatility ratio is near the low end of its two-year range, suggesting investors are paying relatively little for near-term protection.
- Regional banks are underperforming the broader market, putting loan quality, funding costs and net interest income in focus as earnings season begins.
- Wednesday's September CPI report could shift expectations for the Federal Reserve's next move and test the market's confidence.
Advertisement|Remove ads.
The stock market looks calm, but three charts suggest a more complicated picture. The S&P 500 is near record highs even as its rally remains concentrated, options markets show limited demand for near-term protection, and regional banks continue to lag. September inflation data and a fresh round of bank earnings could test that uneasy balance this week.
The S&P 500 Rally Is Becoming More Concentrated
The S&P 500 has climbed roughly 80% since the start of 2024, but gains have not been evenly distributed across the market. The market-cap-weighted index has outpaced its equal-weight counterpart by about 16 percentage points, underscoring how much the rally has depended on a smaller group of large-cap stocks.
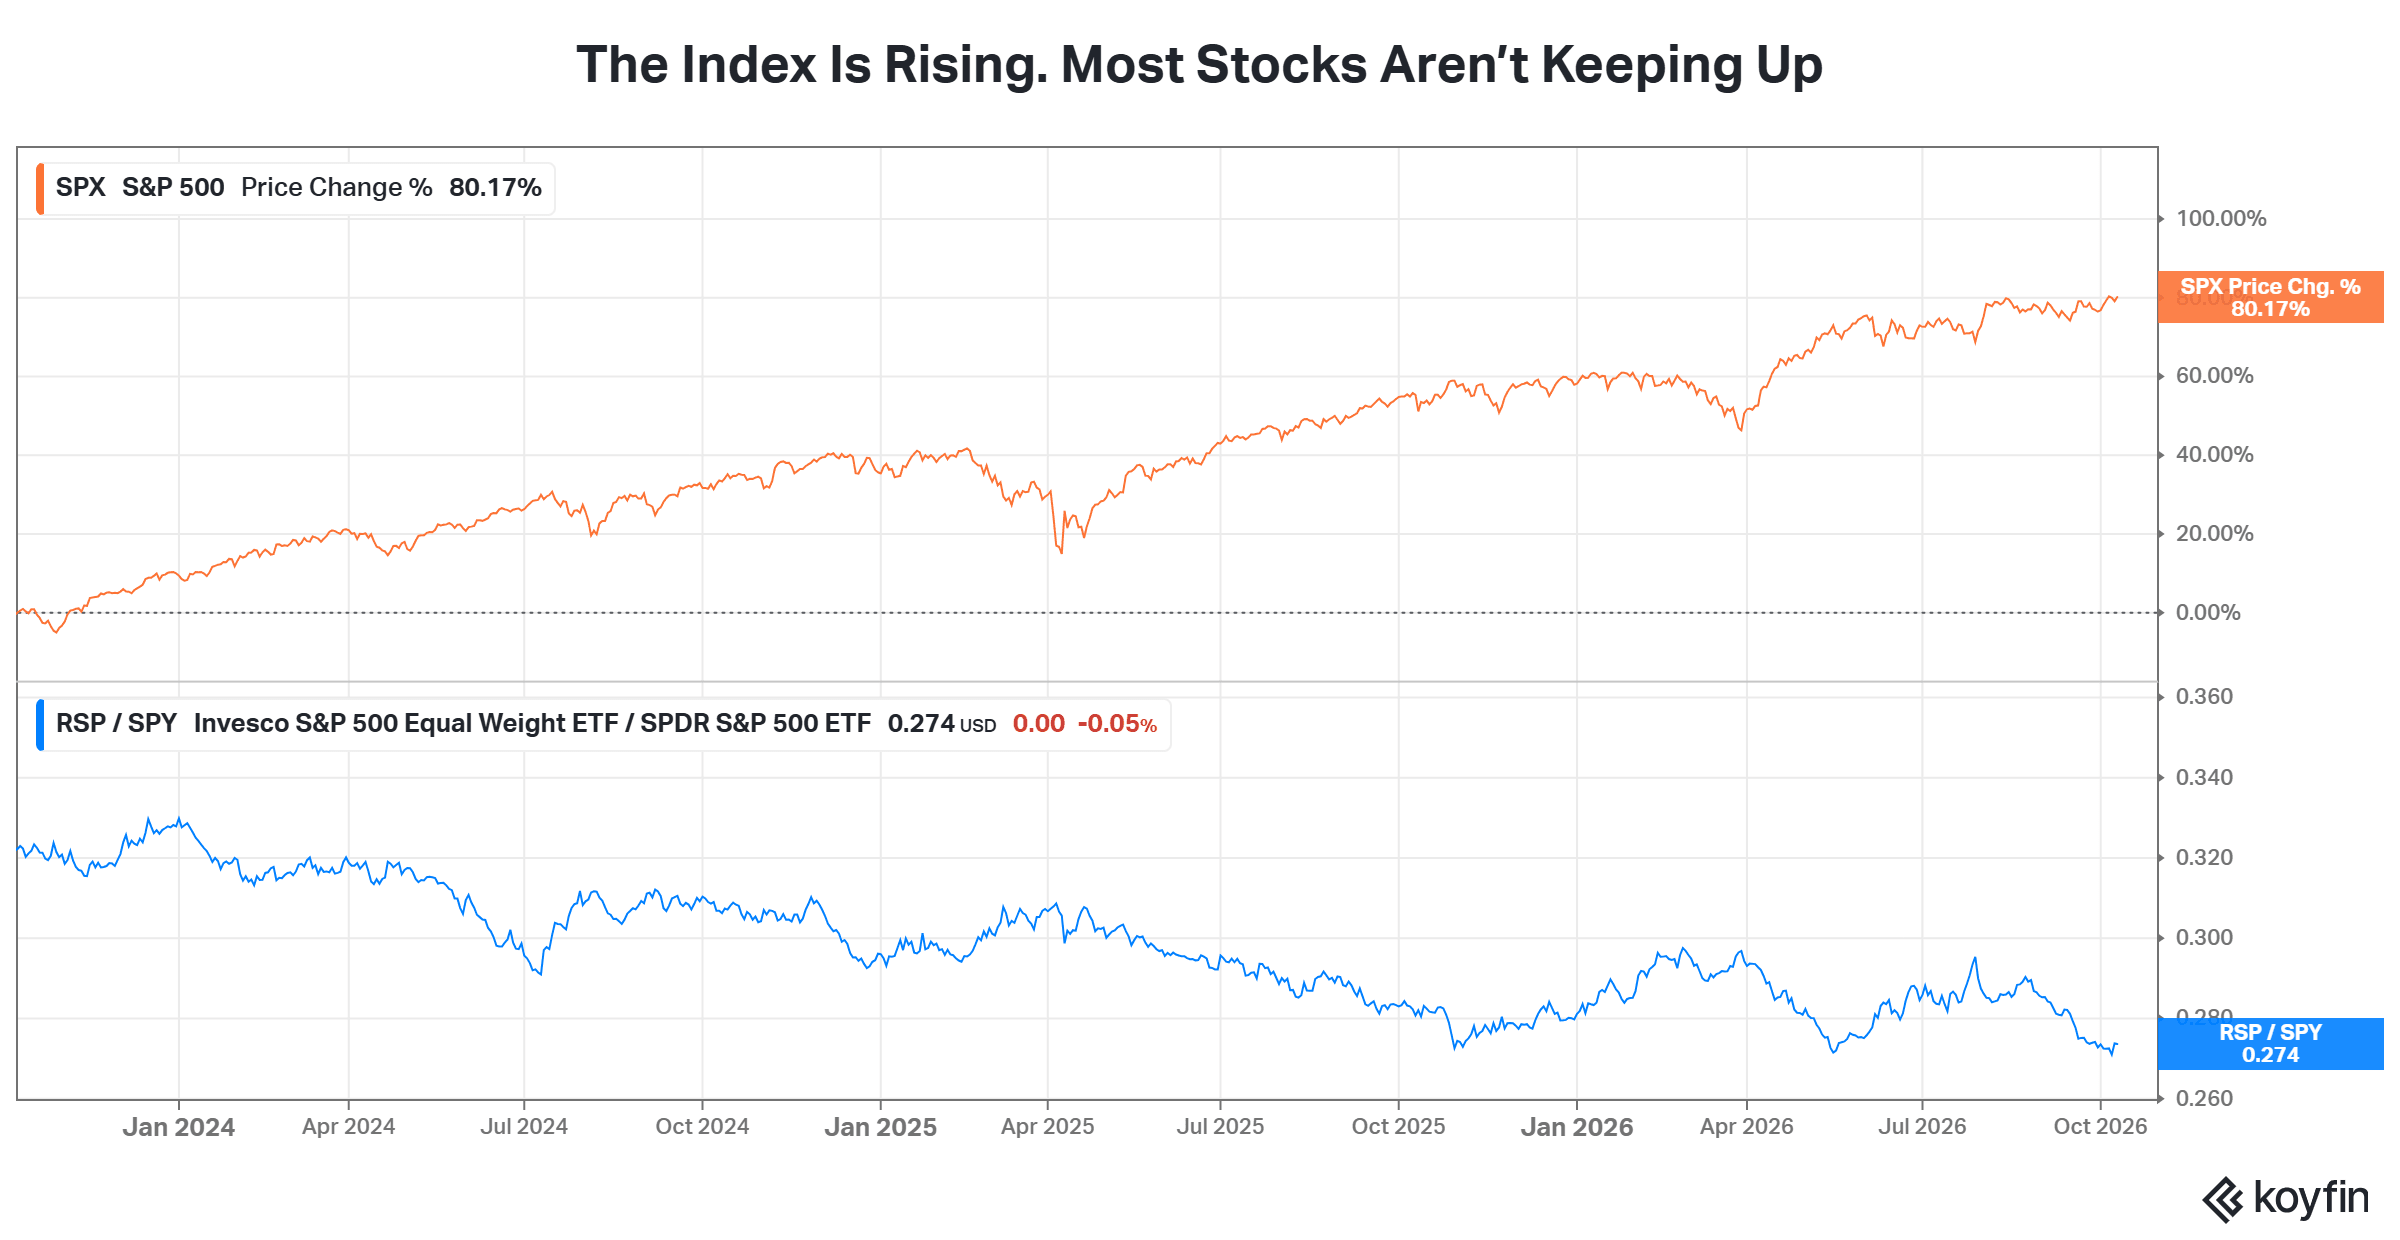
The rally has also narrowed since the spring 2026 low. Concentration is not a sell signal, but it changes the risk. An index held up by a few names is more exposed to a single earnings miss or a jump in yields.
Advertisement|Remove ads.
Strong inflation data this week could complicate the outlook for rate cuts and weigh on risk appetite, while a softer reading could help support stocks beyond the market’s biggest names.
The SPDR S&P 500 ETF Trust (SPY) traded flat in pre-market trade on Monday. On Stocktwits, retail sentiment around the ETF trended in ‘bullish’ territory over the past day.
Options Markets Show Little Demand For Near-Term Protection
The Cboe Volatility Index (VIX) is often called Wall Street’s fear gauge. It measures how much investors are paying for insurance against near-term swings in the S&P 500. This chart compares that short-term price with the price of insurance three months out. Right now short-term protection is cheaper, which is what you’d expect when nobody is worried about the next few weeks.
Advertisement|Remove ads.
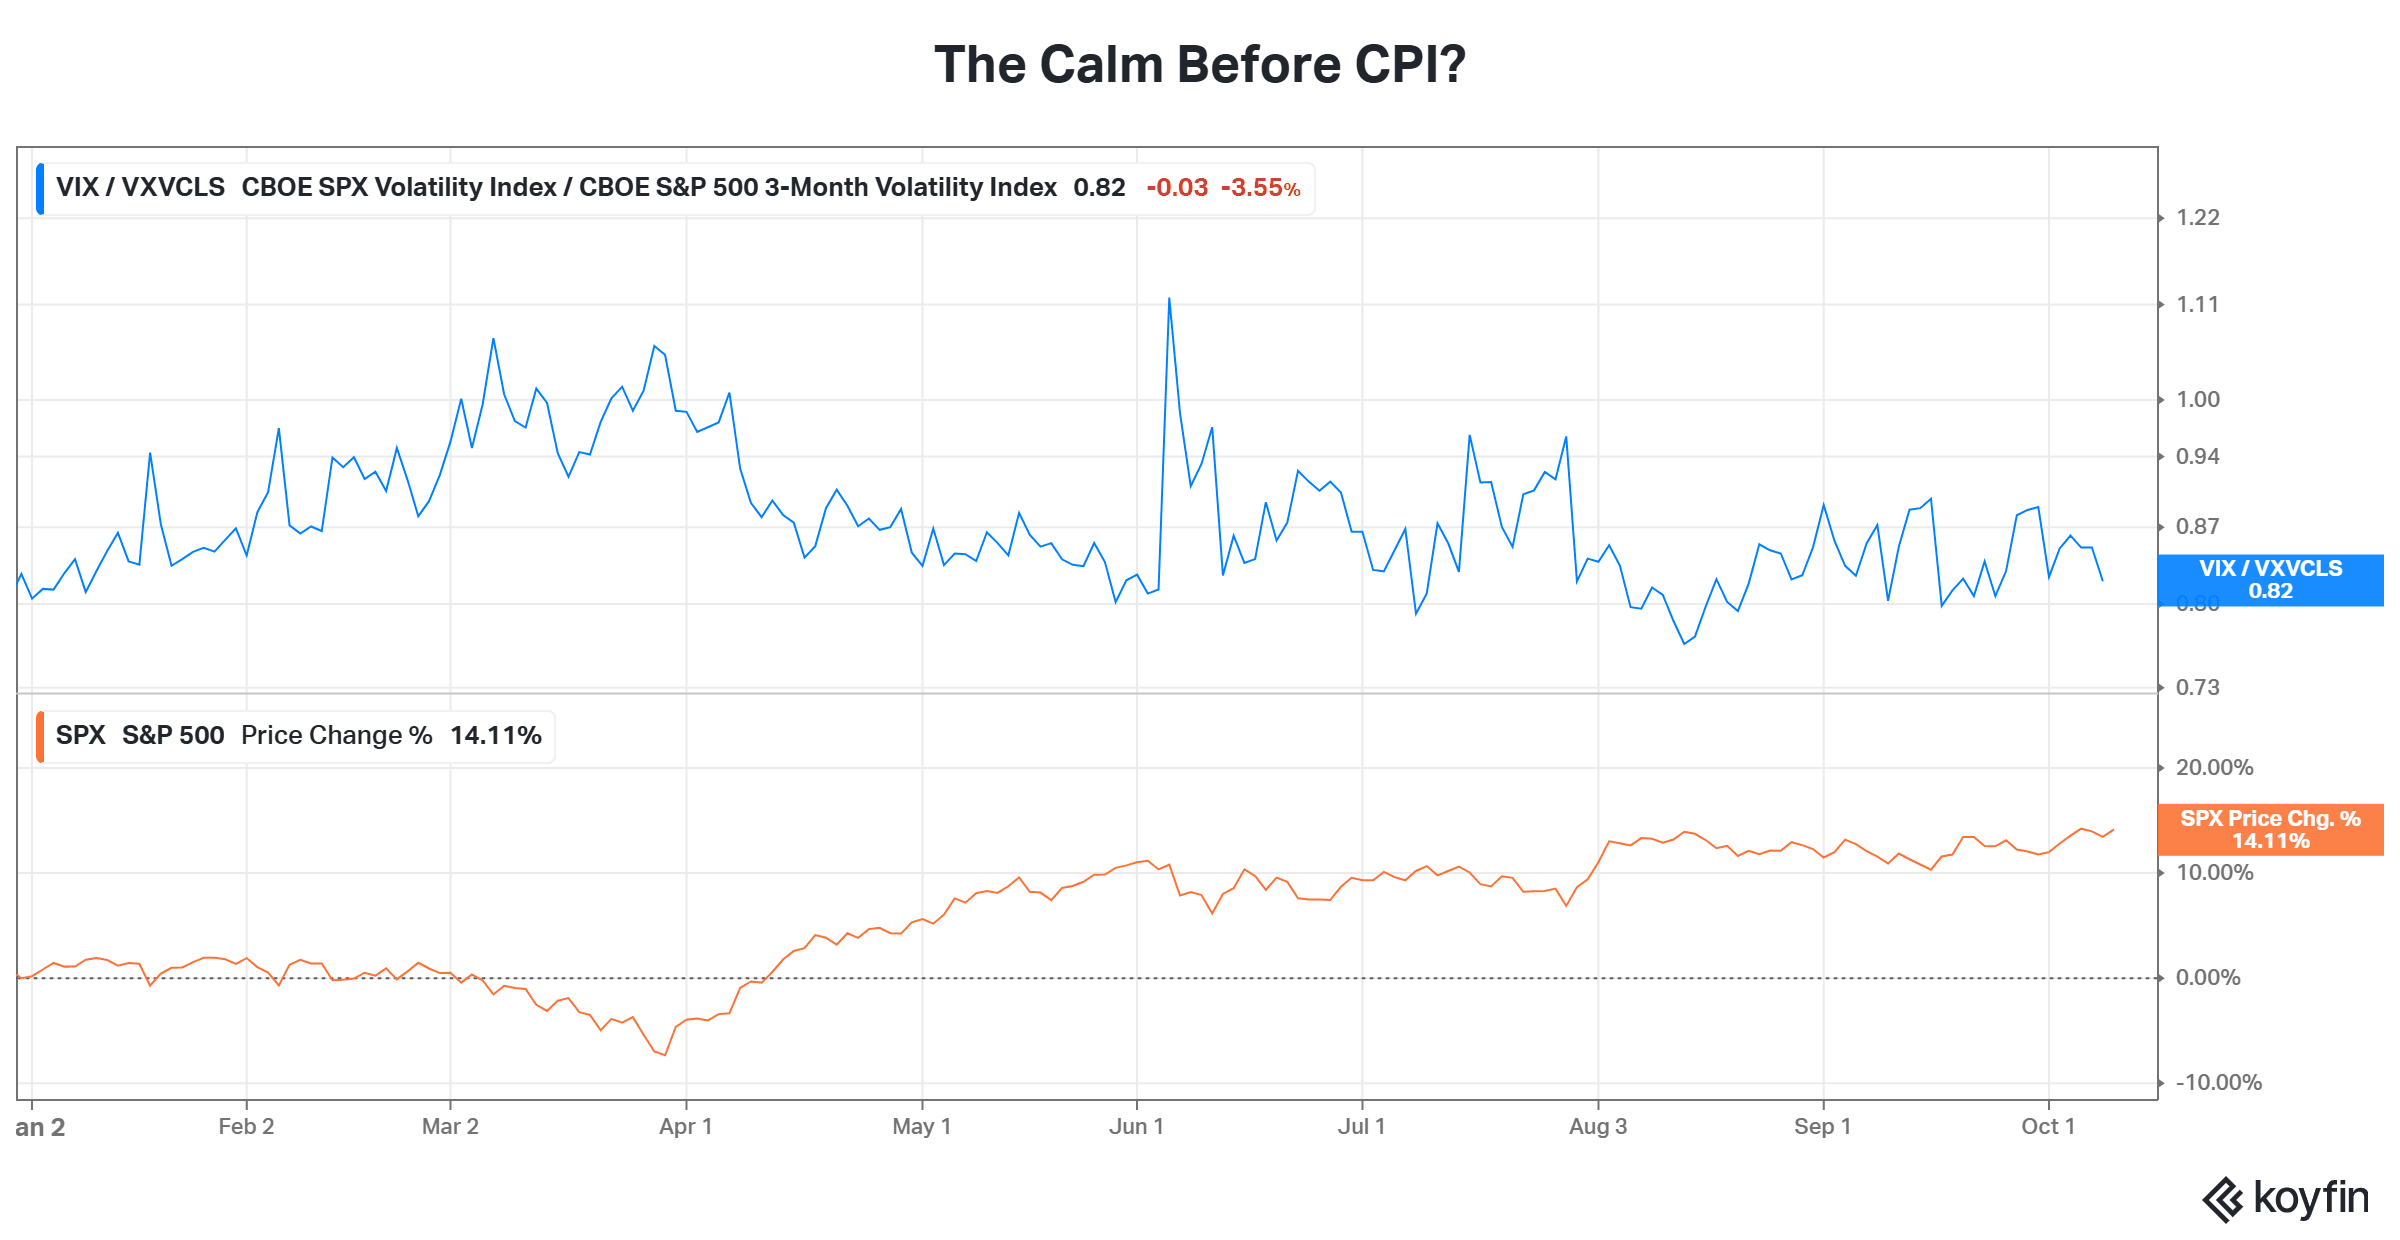
A reading below 1 suggests traders are pricing in less near-term volatility than volatility over a longer horizon. The ratio is near the low end of its two-year range.
The spikes above 1.0 are sharp and short-lived. They came in August 2024, December 2024 and April 2025, the last of which peaked near 1.28. In each case, the move came fast and with little warning.
That calm could hold if economic data and corporate results reassure investors. However, a hotter inflation reading or an earnings surprise could quickly change the picture, making the reaction in volatility markets worth watching.
Advertisement|Remove ads.
Regional Banks Continue To Lag
Big banks have not moved as a group this year. Citigroup (C) is up 11.1% and Morgan Stanley (MS) is up 7.0%. JPMorgan (JPM) is up 3.3% and Goldman Sachs (GS) is up 1.9%. Bank of America (BAC) is down 1.2%, and Wells Fargo (WFC) is down 10.4%. That is a spread of more than 20 points between the best and worst names.
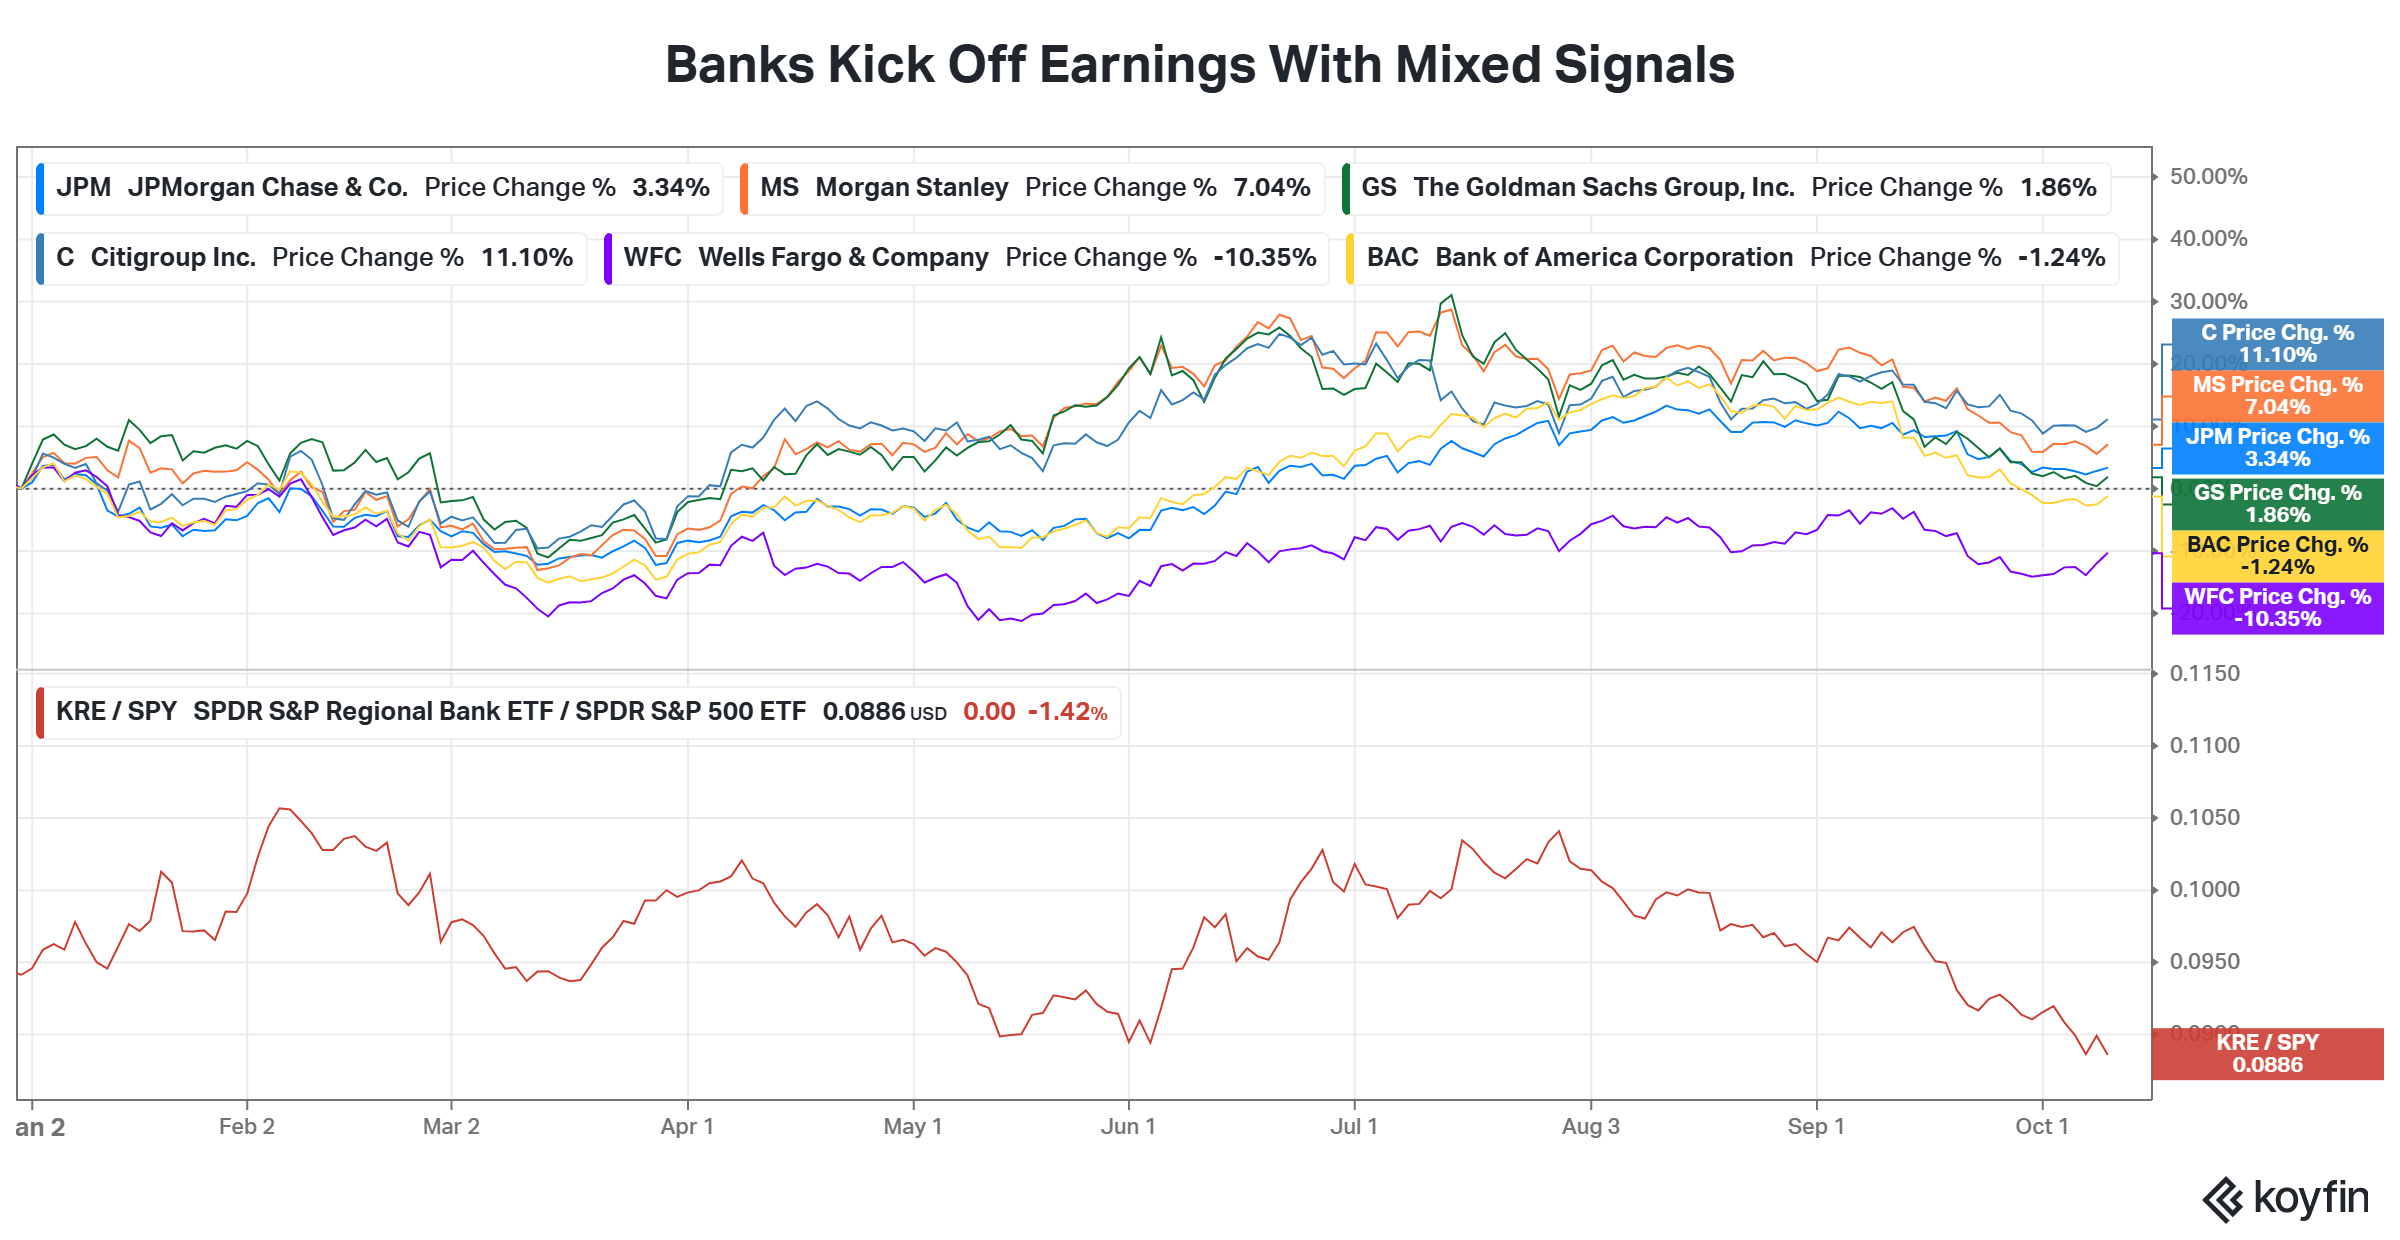
Meanwhile, the regional bank ETF relative to the S&P 500 is at 0.0886, its lowest level of the year. Higher-for-longer rates can help margins, but they can also raise funding costs and credit worries, and regionals tend to feel that first.
The Financial Select Sector SPDR Fund (XLF) edged up as much as 0.3% in pre-market trading. Retail sentiment around the ETF trended in ‘bullish’ territory over the past day.
Advertisement|Remove ads.
Earnings reports could offer a clearer view of those pressures, particularly through net interest income, deposit costs and loan-loss provisions. The results may help determine whether regional banks’ underperformance reflects lingering sector-specific concerns or a broader risk to financial stocks.
Three ways the week could go
- A hot inflation report: If inflation comes in above forecasts, expect talk of another Fed hike in October to come roaring back. One outlook noted that a rise in services prices to its highest level since July 2022 means a hot reading would put an October hike back in play. That would hit a narrow market with low insurance coverage, which is the combination we’ve described across the charts.
- An in-line report: If inflation matches expectations, the market probably breathes out. That keeps the focus on earnings and gives the record highs a chance to hold.
- A cool report: If inflation comes in below forecasts, hike fears should fade. The more interesting question is who benefits. If the rally broadens beyond the largest companies, the first chart will start to heal.
Read also: MAG 7 Voices: How Nvidia, Microsoft, Alphabet, Meta Reshaped AI This Week
For updates and corrections, email newsroom[at]stocktwits[dot]com.
Advertisement|Remove ads.
Comments posted here will also appear on symbol pages.

Latest News
/filters:format(webp)https://news.stocktwits-cdn.com/large_Getty_Images_2246580703_jpg_9700e1e7e8.webp)
/filters:format(webp)https://news.stocktwits-cdn.com/Prabhjote_DP_67623a9828.jpg) Prabhjote Gill·32m ago
Prabhjote Gill·32m ago/filters:format(webp)https://news.stocktwits-cdn.com/large_Getty_Images_2272981572_jpg_2b0afb3565.webp) Prabhjote Gill·50m ago
Prabhjote Gill·50m ago/filters:format(webp)https://news.stocktwits-cdn.com/large_Getty_Images_2253201732_jpg_7b39811d51.webp)
/filters:format(webp)https://news.stocktwits-cdn.com/Anushka_Basu_make_me_smile_in_the_picture_b92832aa_af59_4141_aacc_4180d2241ba8_1_2_png_1086e0ed8c.webp) Anushka Basu·1h ago
Anushka Basu·1h ago/filters:format(webp)https://news.stocktwits-cdn.com/large_ast_spacemobile_jpg_5a8ccae42d.webp)
/filters:format(webp)https://news.stocktwits-cdn.com/vivekkrishnanphotography_58_jpg_0e45f66a62.webp) Arnab Paul·1h ago
Arnab Paul·1h ago/filters:format(webp)https://news.stocktwits-cdn.com/large_ebay_resized_jpg_3e589ea309.webp)
/filters:format(webp)https://news.stocktwits-cdn.com/Heera_1_1c30cb0170.PNG) Heera Hari·1h ago
Heera Hari·1h ago/filters:format(webp)https://news.stocktwits-cdn.com/resized_lip_bu_tan_intel_ceo_jpg_3a809518df.webp) Prabhjote Gill·2h ago
Prabhjote Gill·2h ago