Advertisement|Remove ads.
Timken, Poonawala Fincorp, Central Bank: SEBI RAs Flag Breakout Setups


Indian equity markets traded subdued on Tuesday, with the Nifty above the 25,500 level. Analysts have flagged stocks such as Timken, Poonawala Fincorp, and Central Bank of India for further upside potential, driven by their technical chart setups.
Let’s take a look at the analyst recommendations:
1.Timken
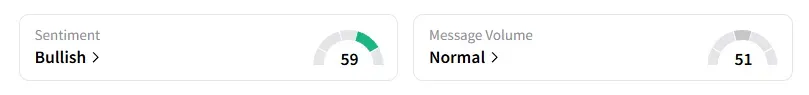
Timken shares have rallied 10% in the past month. SEBI-registered analyst Palak Jain has flagged an inverted head and shoulder pattern in Timken. She believes the stock is poised for a bullish move in the next few weeks, driven by a strong volume buildup. Jain set a target of ₹3,700 to be achieved by mid-July.
Data on Stocktwits shows that retail sentiment is ‘bullish’ on this counter.
2.Poonawala Fincorp
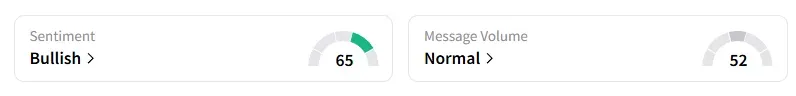
Poonawala Fincorp shares have risen 15% in the past month. Analyst Suryansh Singh Chandel sees a bullish setup in Poonawala Fincorp, supported by technical indicators, including the ADX.
He believes that the stock can rally to ₹500 if it breaks the ₹470 level with a stop-loss of ₹455 within a few weeks' timeframe.
Data on Stocktwits shows that retail sentiment is ‘bullish’ on this counter.
3.Central Bank of India
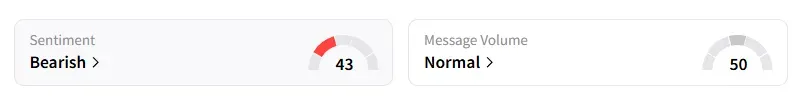
Central Bank of India shares have gained 6% in the last one week. Analyst Rajneesh Sharma noted that the stock is showing signs of trend reversal on the weekly chart, as it attempts to break out from the falling wedge pattern.
Support is seen between ₹34 and ₹36, with resistance at ₹44–₹48. Key technical indicators are also turning positive, with the On-Balance Volume (OBV) displaying bullish divergence at lower levels, suggesting accumulation, and the Relative Strength Index (RSI) showing improvement. Additionally, Fibonacci retracement zones highlight the next key levels at ₹48 and ₹53.
Sharma holds a short-term bullish bias on the stock above ₹41. He believes that a clean breakout with volume can open the way to the ₹47–₹53, and advised traders to watch for sustained moves above ₹44 for further confirmation.
Data on Stocktwits shows that retail sentiment is ‘bearish’ on this counter.
For updates and corrections, email newsroom[at]stocktwits[dot]com.
Latest News
/filters:format(webp)https://news.stocktwits-cdn.com/large_Meta_jpg_0f17dacb20.webp)
/filters:format(webp)https://news.stocktwits-cdn.com/Whats_App_Image_2026_05_11_at_09_45_43_1_jpeg_a08c0cf251.webp) Aveek Bhowmik·6m ago
Aveek Bhowmik·6m ago/filters:format(webp)https://st-everywhere-cms-prod.s3.us-east-1.amazonaws.com/large_LUNR_Intuitive_resized_cab4ddef01.jpg)
/filters:format(webp)https://news.stocktwits-cdn.com/1707726834303_jpg_11f20a9aa9.webp) Shashank Nayar·13m ago
Shashank Nayar·13m ago/filters:format(webp)https://news.stocktwits-cdn.com/large_Getty_Images_2260984359_jpg_566af2429c.webp) Shashank Nayar·25m ago
Shashank Nayar·25m ago/filters:format(webp)https://news.stocktwits-cdn.com/large_elon_musk_jpg_5c0420cf77.webp) Aveek Bhowmik·2h ago
Aveek Bhowmik·2h ago/filters:format(webp)https://st-everywhere-cms-prod.s3.us-east-1.amazonaws.com/large_national_cancer_institute_Cx0_Ls_Yr_M_Ns_unsplash_b3dc9b6ace.jpg) Aveek Bhowmik·2h ago
Aveek Bhowmik·2h ago/filters:format(webp)https://news.stocktwits-cdn.com/large_Getty_Images_492469887_jpg_1b932ad0fb.webp)
/filters:format(webp)https://news.stocktwits-cdn.com/vivekkrishnanphotography_58_jpg_0e45f66a62.webp) Arnab Paul·2h ago
Arnab Paul·2h ago