This week’s Consumer and Producer Price Indexes both showed a cooling of inflation, driven primarily by a drop in energy prices. 🔻
The headline readings get all the attention but are highly volatile and a lagging indicator.
Instead of focusing on the month-to-month changes in these measures, an alternative way to get a read on inflation may be to take a step back and look at the trend of the underlying commodity. After all, we do have a real-time view of these prices changing at the wholesale level…so why not use them? 💭
An easy way to measure crude oil’s trend is by applying a simple moving average. Below we’ve got a chart of prices with a 63-day (purple line) and 252-day (blue line) moving average, which tell us the average price over the last quarter and year, respectively.
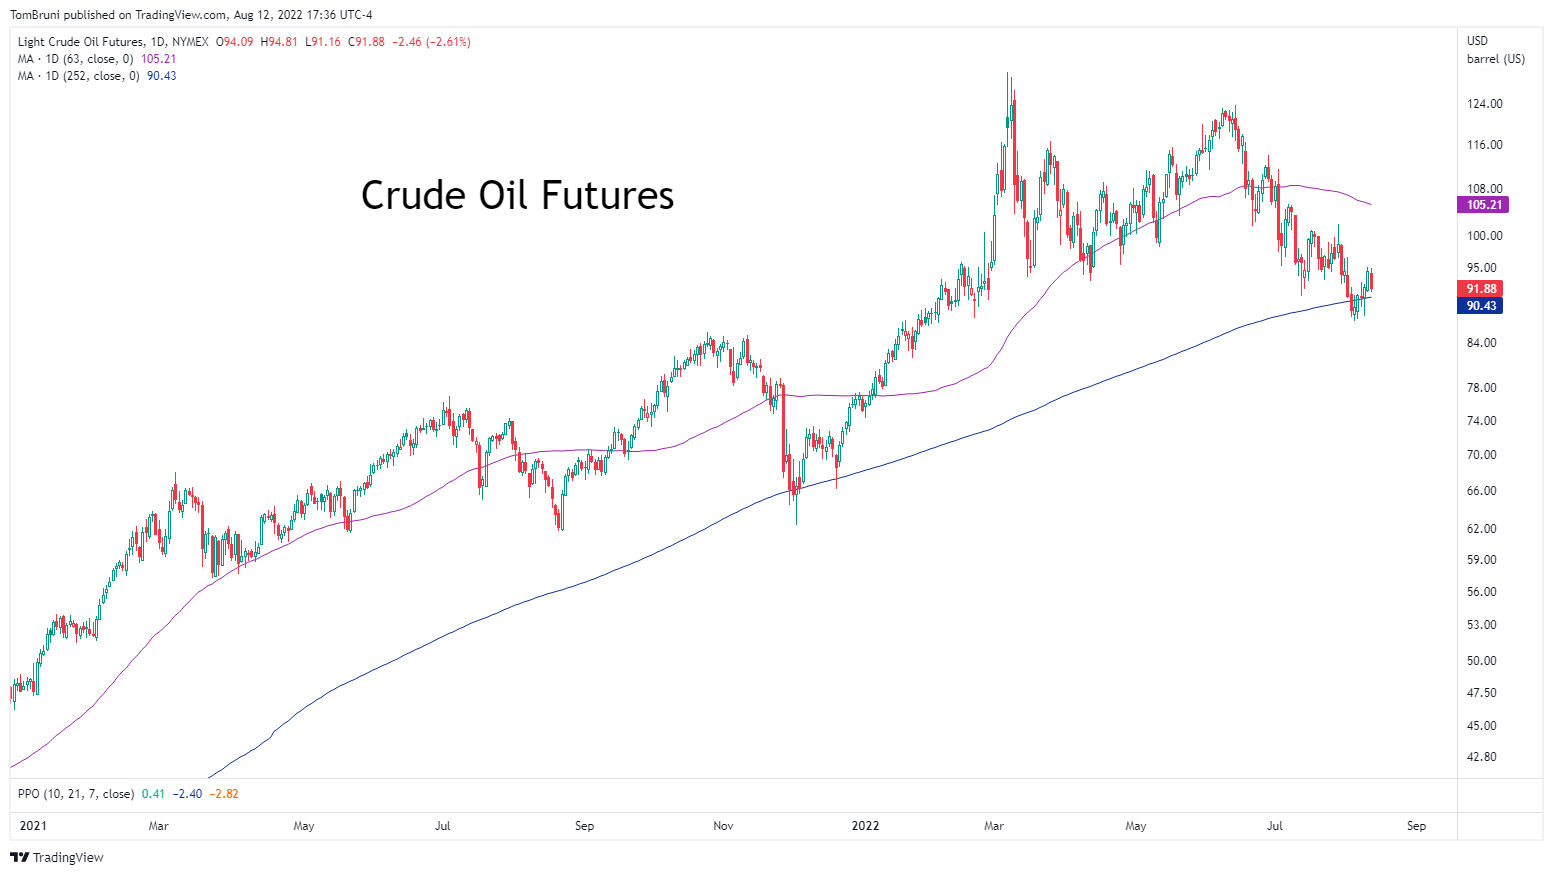
As we can see, the 252-day moving average is trending firmly higher, though the slope of its ascent has slowed marginally. A rising moving average tells us that the average price of crude over the last year has been rising and putting upward pressure on the inflation measures. 📈
Meanwhile, the 63-day moving average is sloping downward, showing that the average price has fallen over the last quarter, which is what we’re seeing the impact of in the July inflation data. 📉
While this is by no means a perfect measure, it gives us a general idea of what to expect in the inflation print by tracking the trend of oil prices in real-time.
Think about it — it would be difficult for the energy prices that go into the government’s inflation measures to come down if the underlying commodity’s price hasn’t gone down, right? 🤔
Additionally, it will take time for falling crude prices to work their way through the system. Futures prices are the starting point, and the inflation measures generally track the price of final goods (what you see on the shelves), so it’s going to take a sustained decline (or stalling) in crude prices to make a meaningful difference across all the goods/services measured.
But, that’s what the Fed is looking to do by raising rates. They can’t affect the supply side of things, so they’re trying to crush demand…which has had mixed results. With that said, weakness in the global economy may start helping them out. Today, OPEC lowered its 2022 oil demand estimates for the third time since April, so we’ll have to see what happens. 🤷♂️
The broader point here is that various Fed officials have reiterated that tightening will continue until long-run inflation makes meaningful progress towards 2%.
A big piece of that will be oil, so keep this chart on your radar in the weeks and months ahead. 🗓️