Shiba Inu
After Sunday’s massive +33% spike higher, Shiba Inu ($SHIBA.X) has spent the rest of the week retracing the entirety of that movement. Will it keep moving lower, or will there be some support?
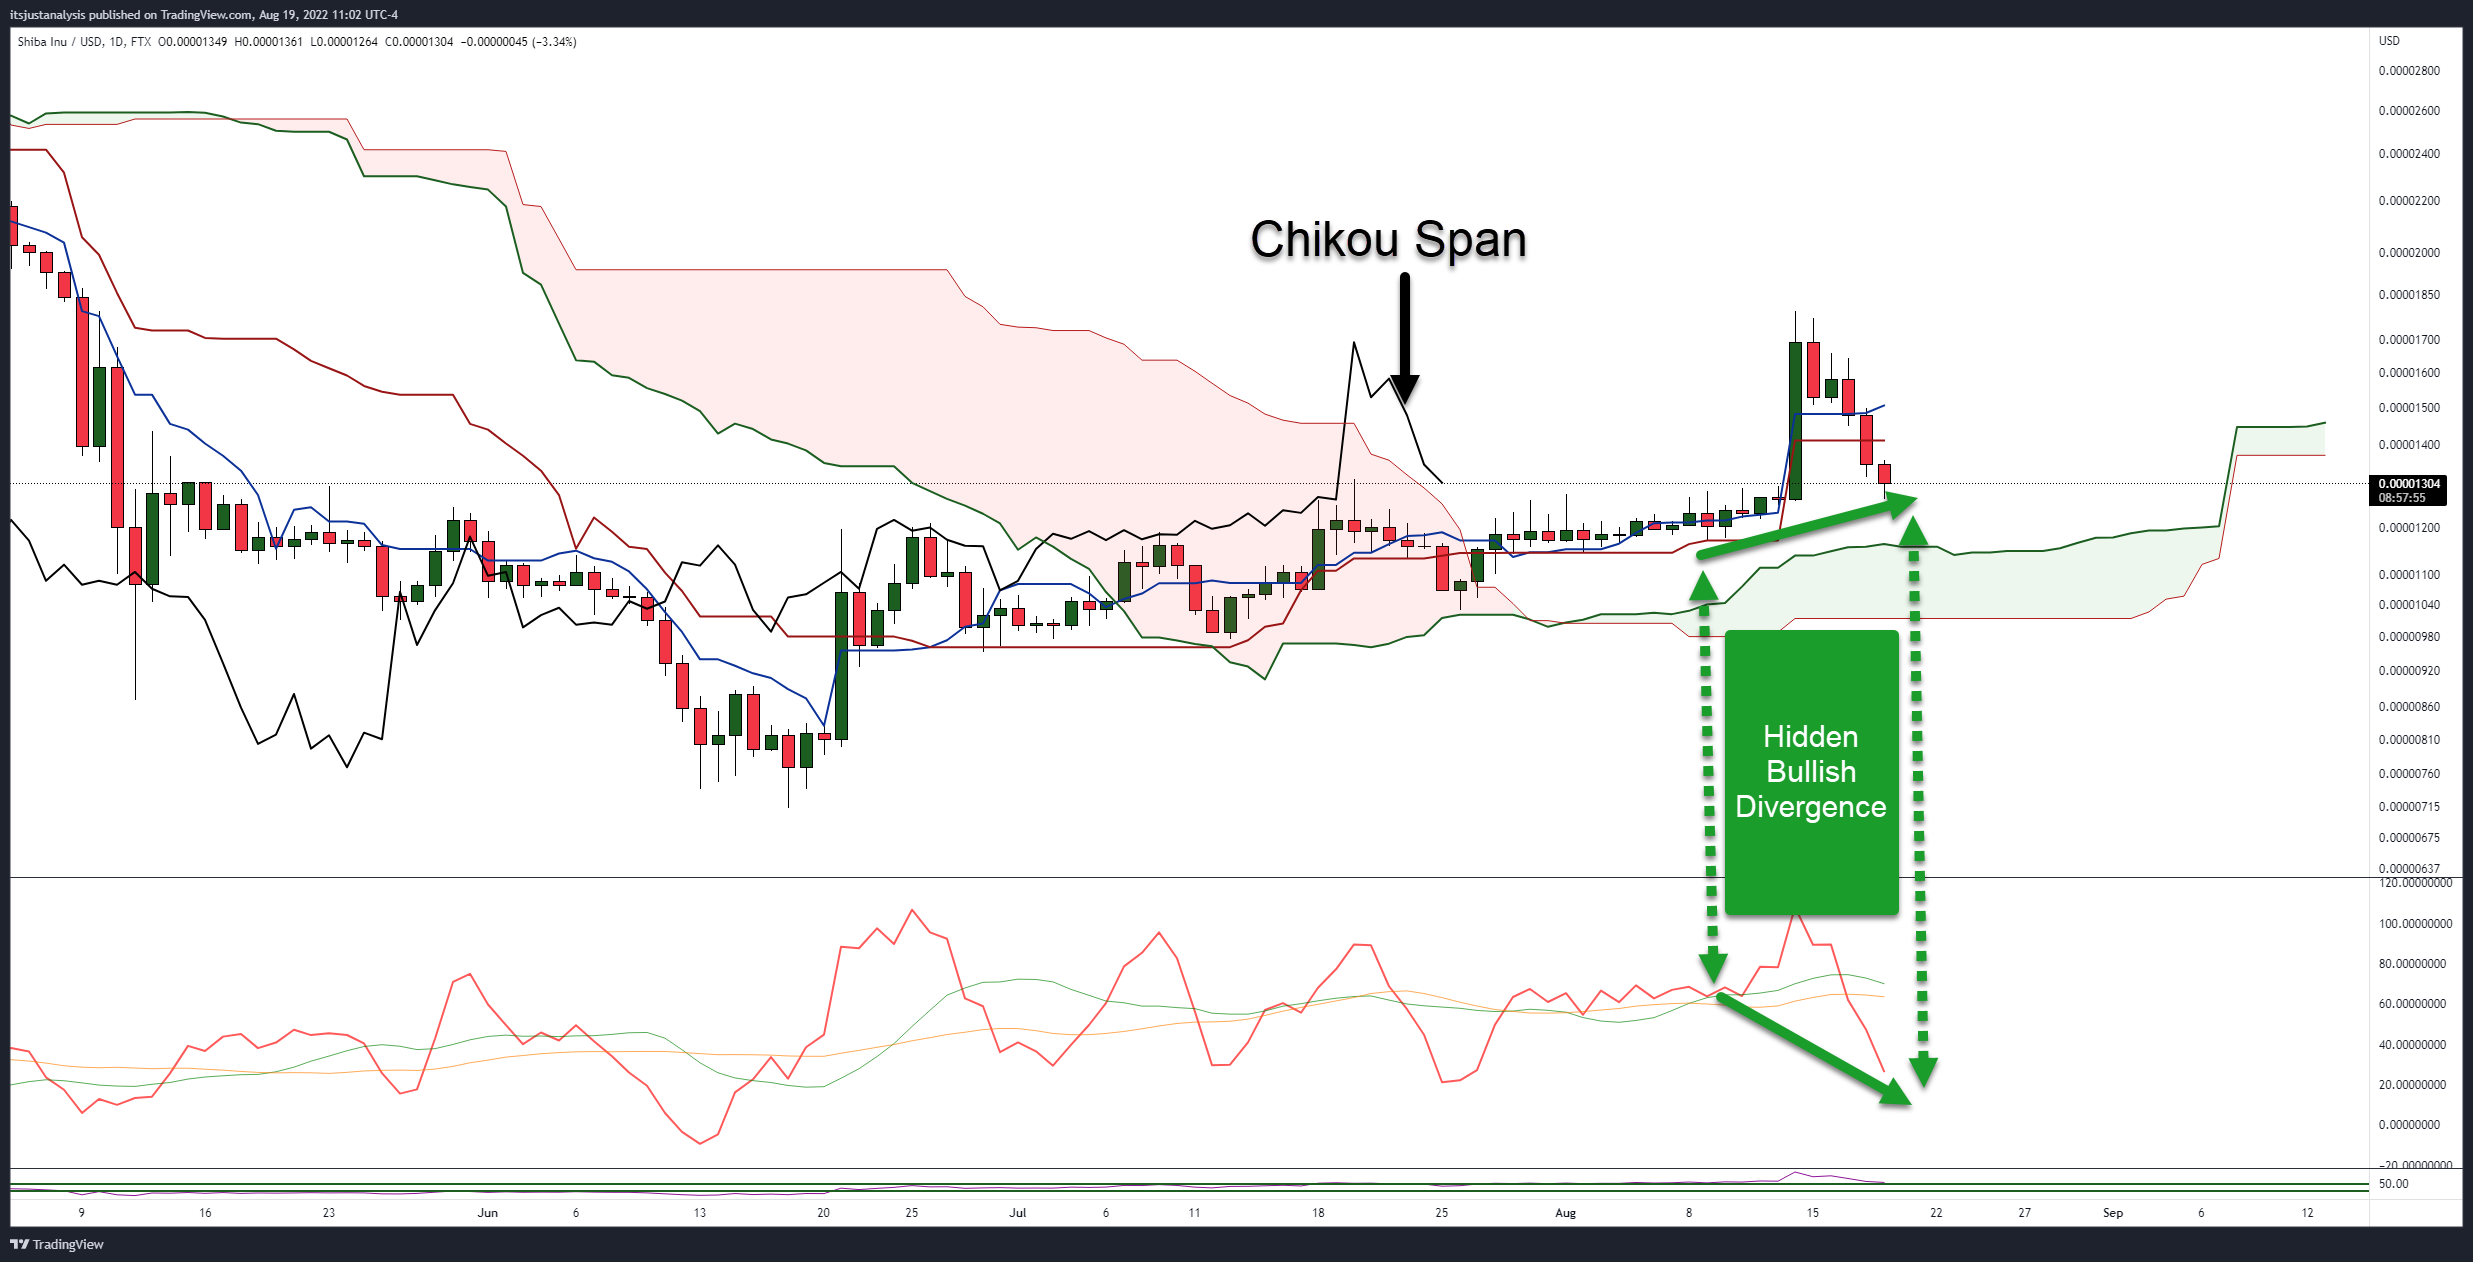
From an Ichimoku perspective, as long as Shiba remains above the Cloud, it’s still interpreted as bullish. Several other conditions on the daily chart above support a bullish thesis: The daily candlestick formation and hidden bullish divergence.
When writing this article, Shiba Inu’s daily candlestick looks like a Bullish Hammer. The bullish hammer pattern shows up at the end of a downtrend or pullback and can help analysts determine if a bounce will occur.
The second bullish condition is the Hidden Bullish Divergence between the candlestick chart and the Composite Index. Hidden bullish divergence is a condition where the candlestick chart prints higher lows, but the oscillator prints lower lows.
One more bullish condition for Shiba Inu is the location of the Chikou Span. If you read the Do You Ichimoku? Part One article, you’d know that the Chikou Span responds to the same support and resistance levels as price does.
So, while the current daily candlestick doesn’t show any near-term support within the Ichimoku system until the top of the Cloud (Senkou Span A) at $0.00001163, look where the Chikou Span and what is directly below it: Senkou Span B.
The strongest support/resistance level in the Ichimoku system, Senkou Span B, is at $0.00001265, precisely where the Chikou Span bounced off of and where the current daily low sits.
For bears/sellers, Shiba Inu’s daily chart is a waiting game. Shiba Inu would convert from a bullish Ichimoku setup to a bearish one only when there is a daily close below the Cloud, and the Chikou Span is in Open Space (read Part One of the Do you Ichimoku? article). For that to occur, Shiba Inu must close at or below $0.00001004. 🐶
Dogecoin
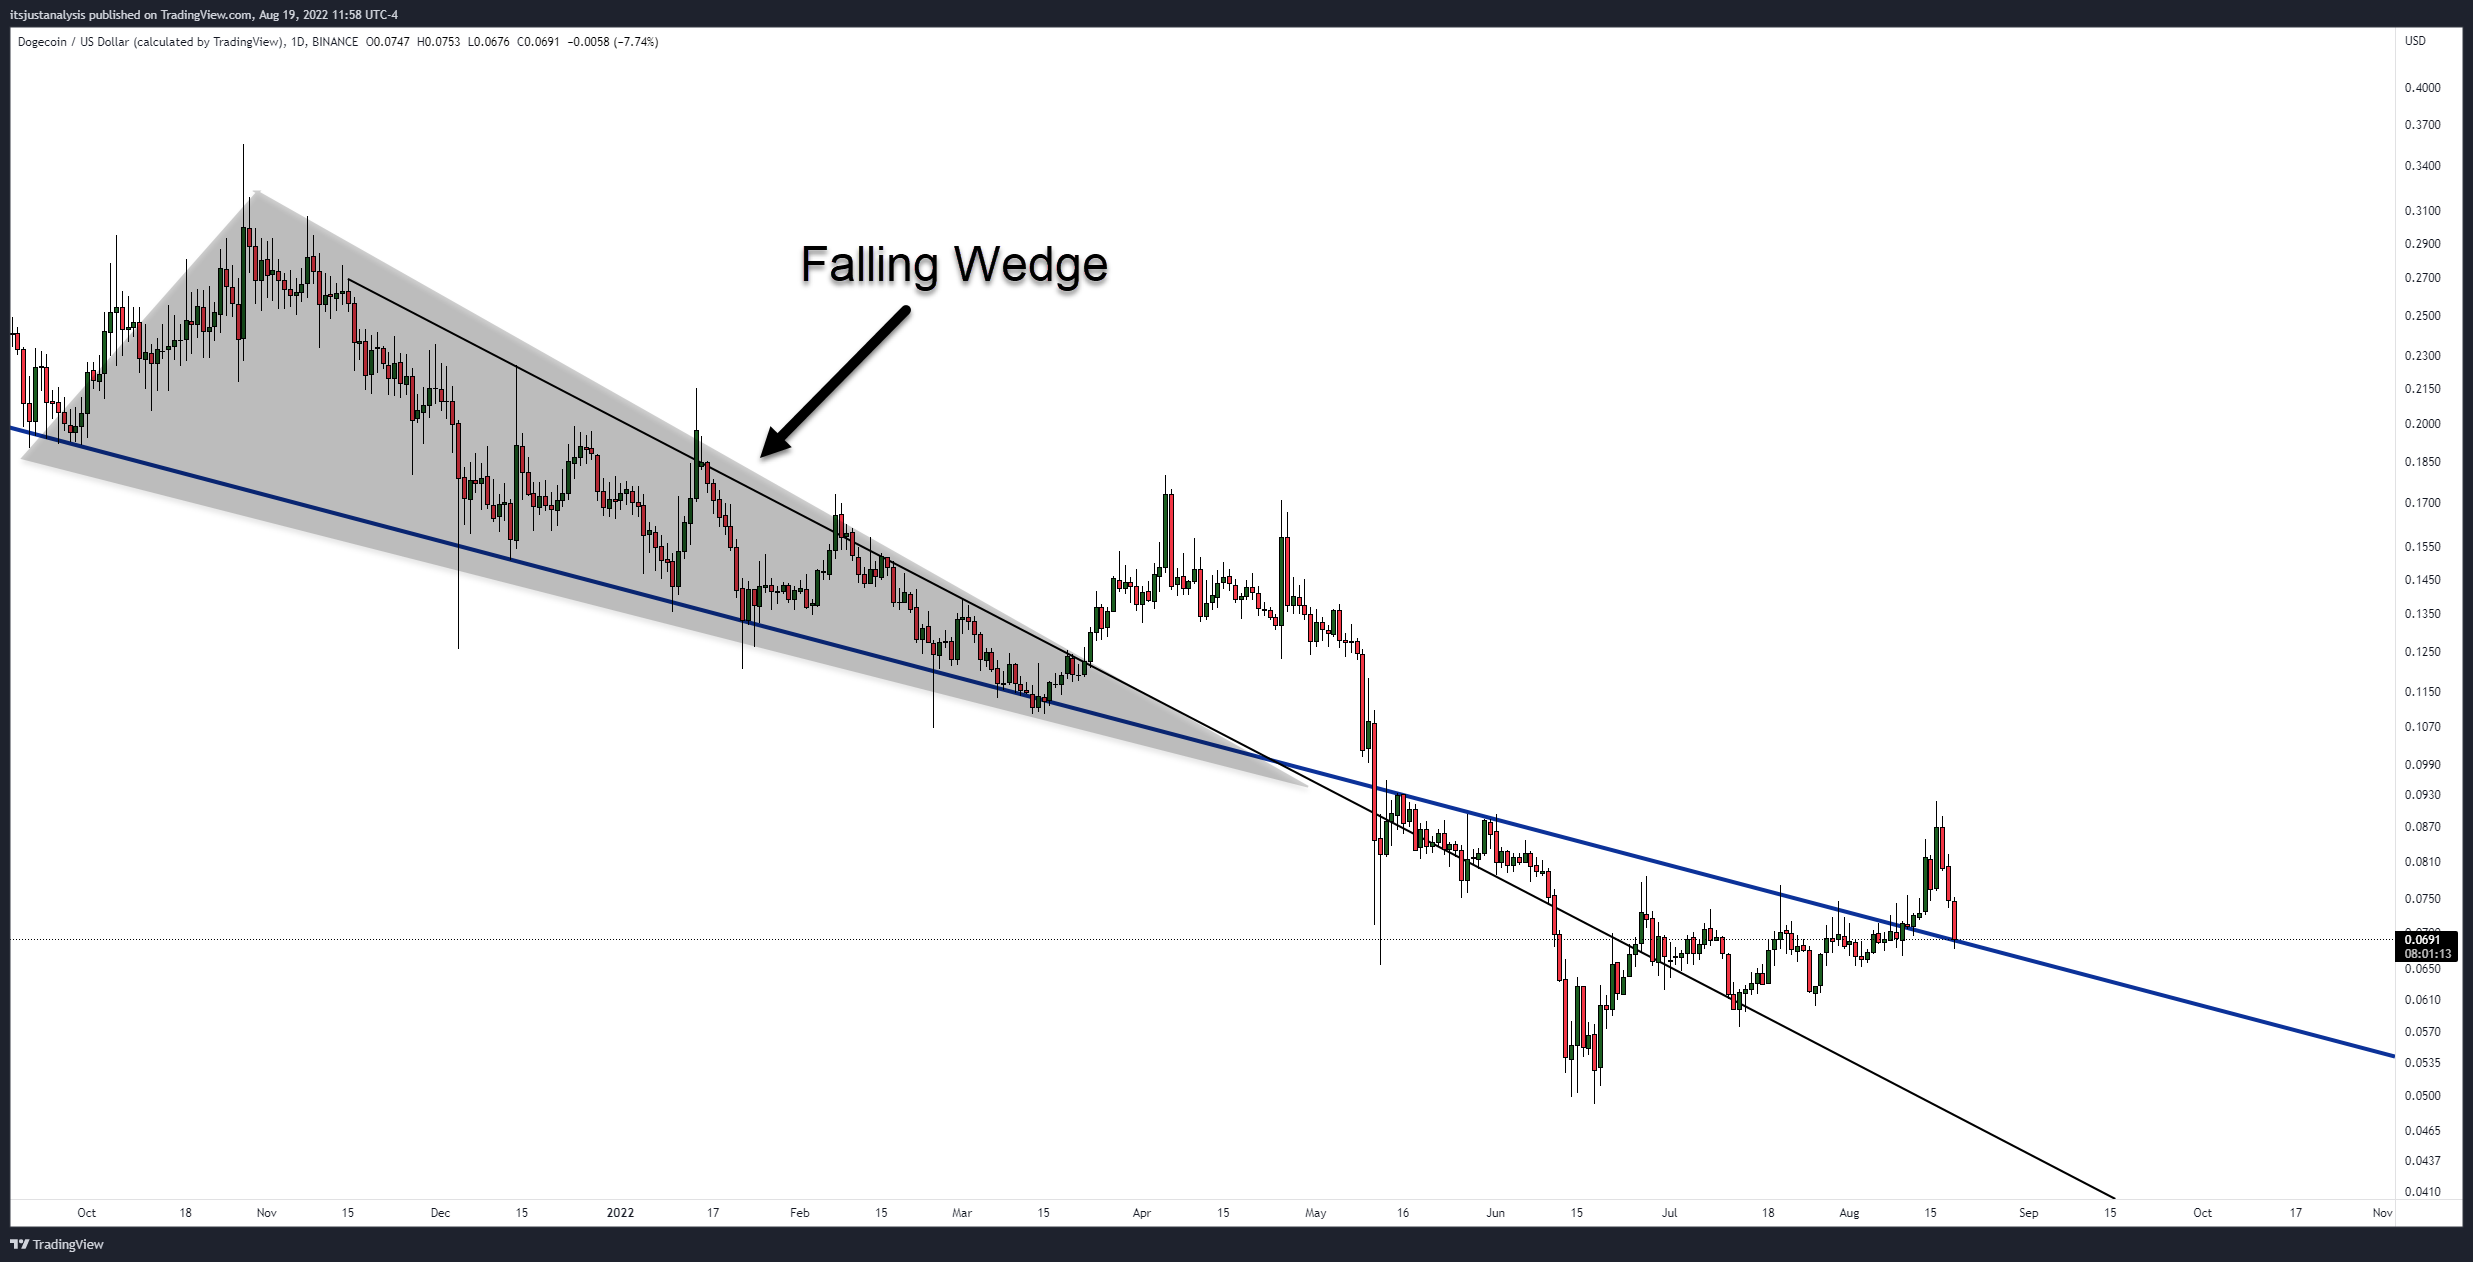
Like Shiba Inu, Dogecoin ($DOGE.X) has faced strong selling pressure over the last few days. When writing this article, Dogecoin is trading at $0.0692, or right on top of the lower trendline (blue diagonal line) of a previous falling wedge.
Pro-tip: Extend the trendlines of patterns you’ve drawn because they can often become important areas of support and resistance in the future.
Note the frequency of times the trendline had acted as resistance before bulls could breakout above it on August 12. So this begs the question: what happens now?
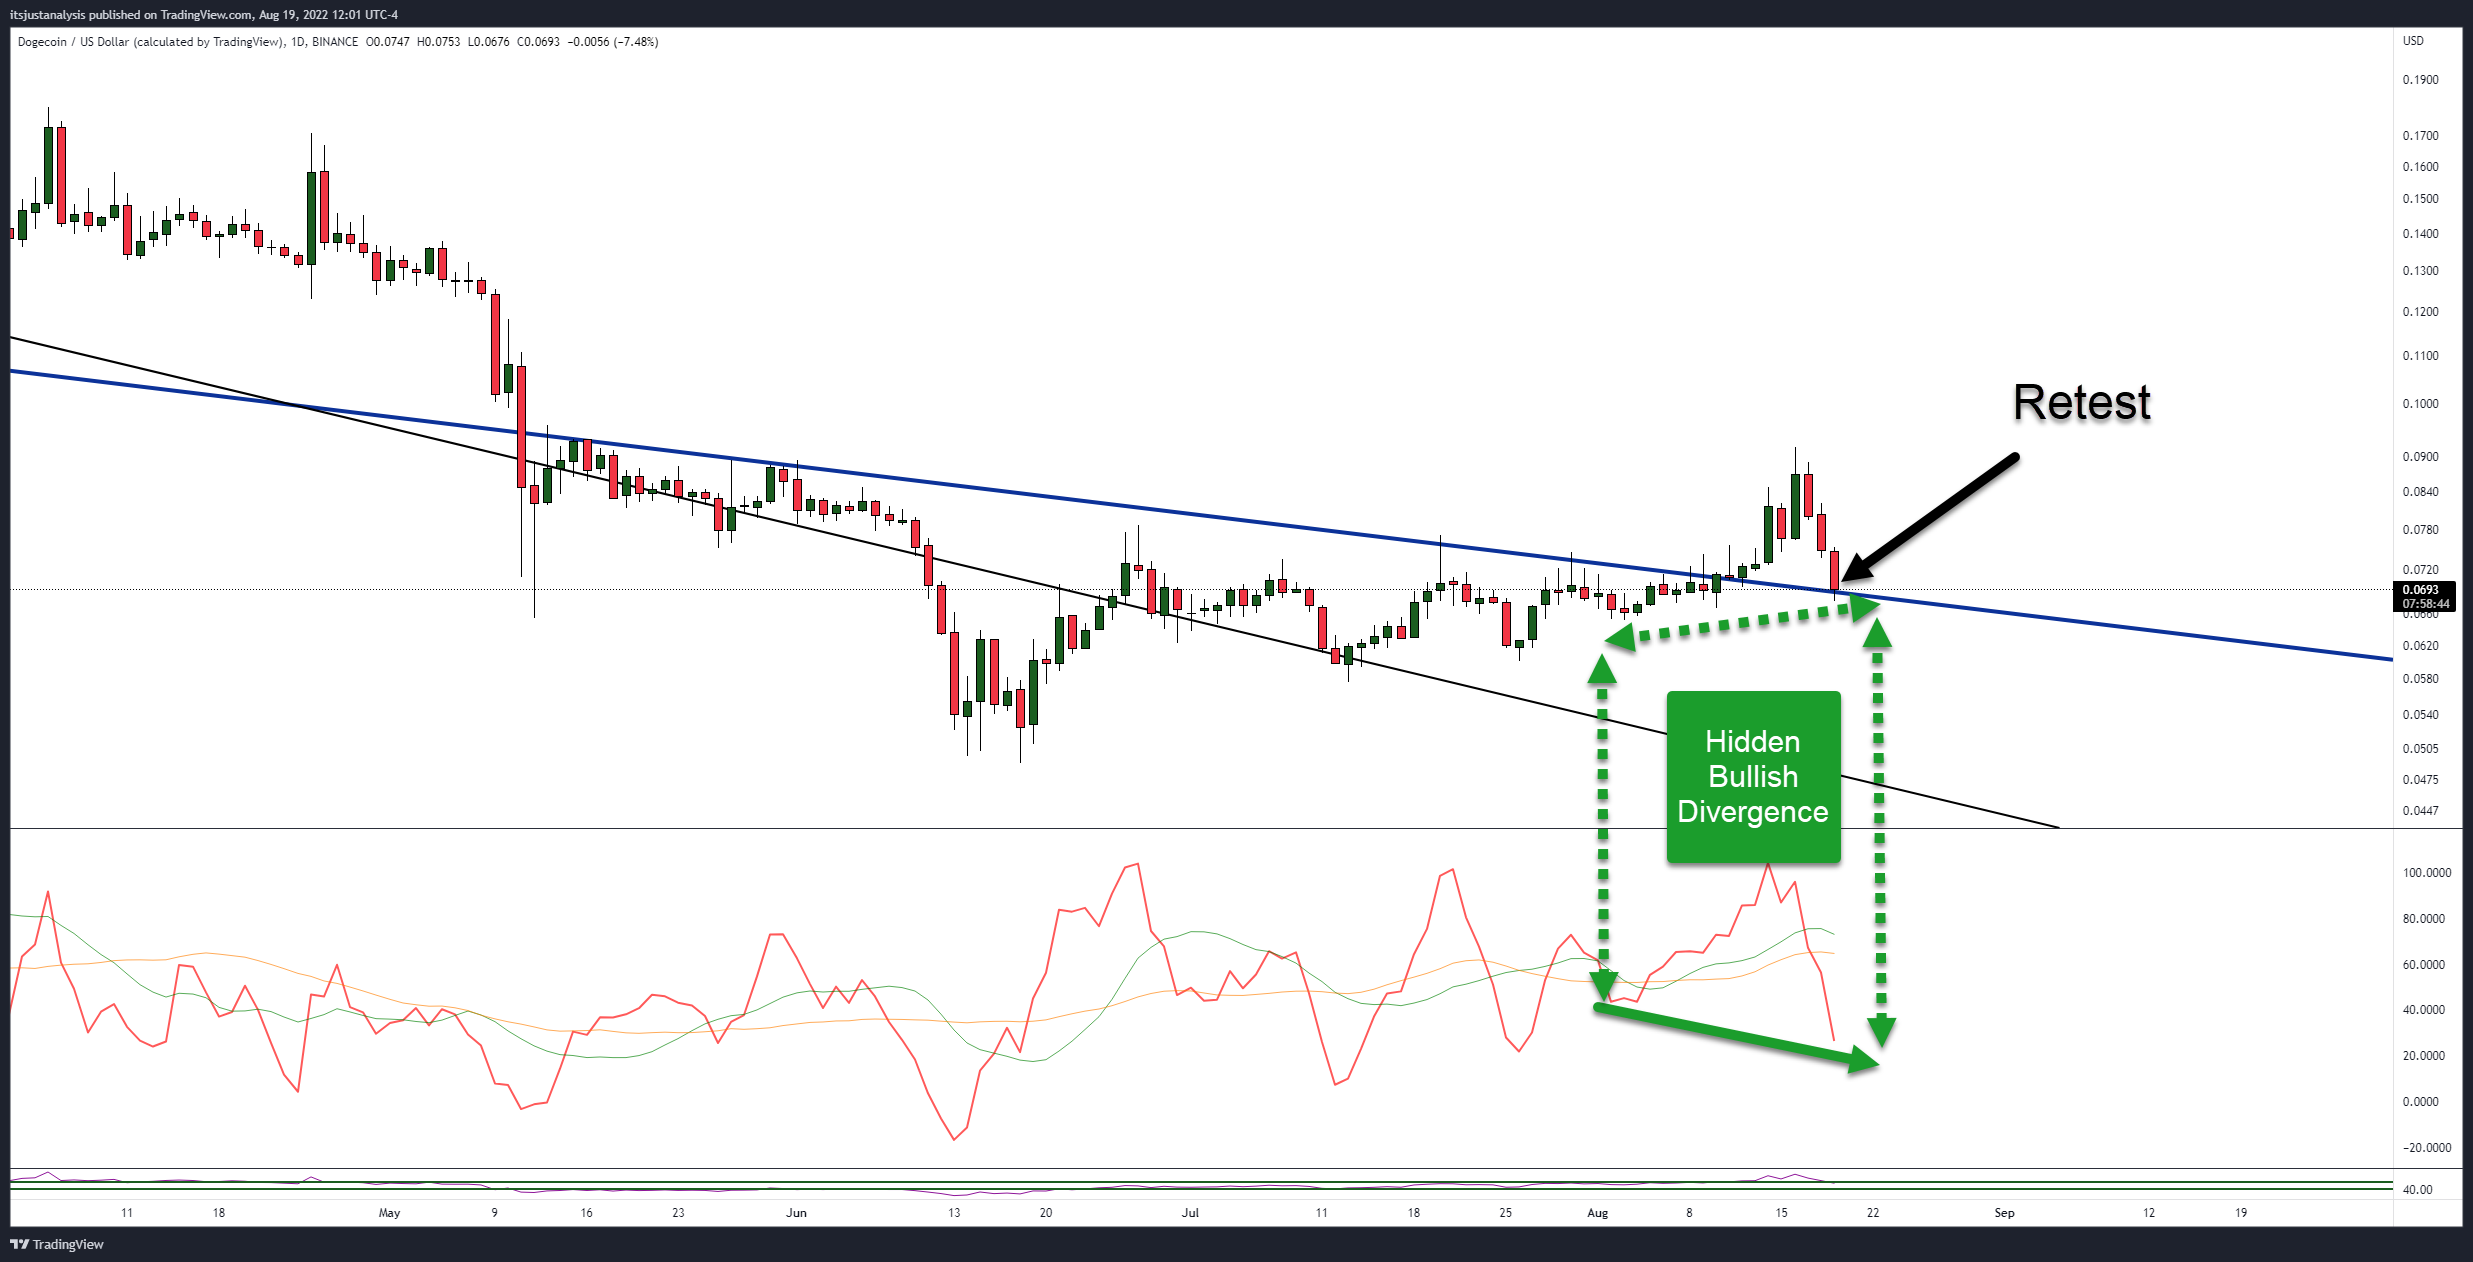
Conservative breakout traders often wait for what is known as a ‘retest.’ Retests are when price moves back to the source of resistance/support that it broke away from. Conservative breakout traders want to see the re-test hold. In Dogecoin’s case, bulls need the trendline to keep support.
Is there anything on Dogecoin’s chart that shows support will hold? The same divergence on Shiba’s chart also exists for Dogecoin’s. The combination of hidden bullish divergence and confirmed support against the trendline would give bulls hope for the end of any further downside pressure.
But not everything looks bullish – especially the candlestick pattern.
If you are a Japanese candlestick trader, then the current pattern on Dogecoin’s daily chart probably has you all sorts of giddy and excited. Why? Because one of the most powerful, bearish candlestick patterns is developing on Dogecoin’s daily chart: Three Black Crows.
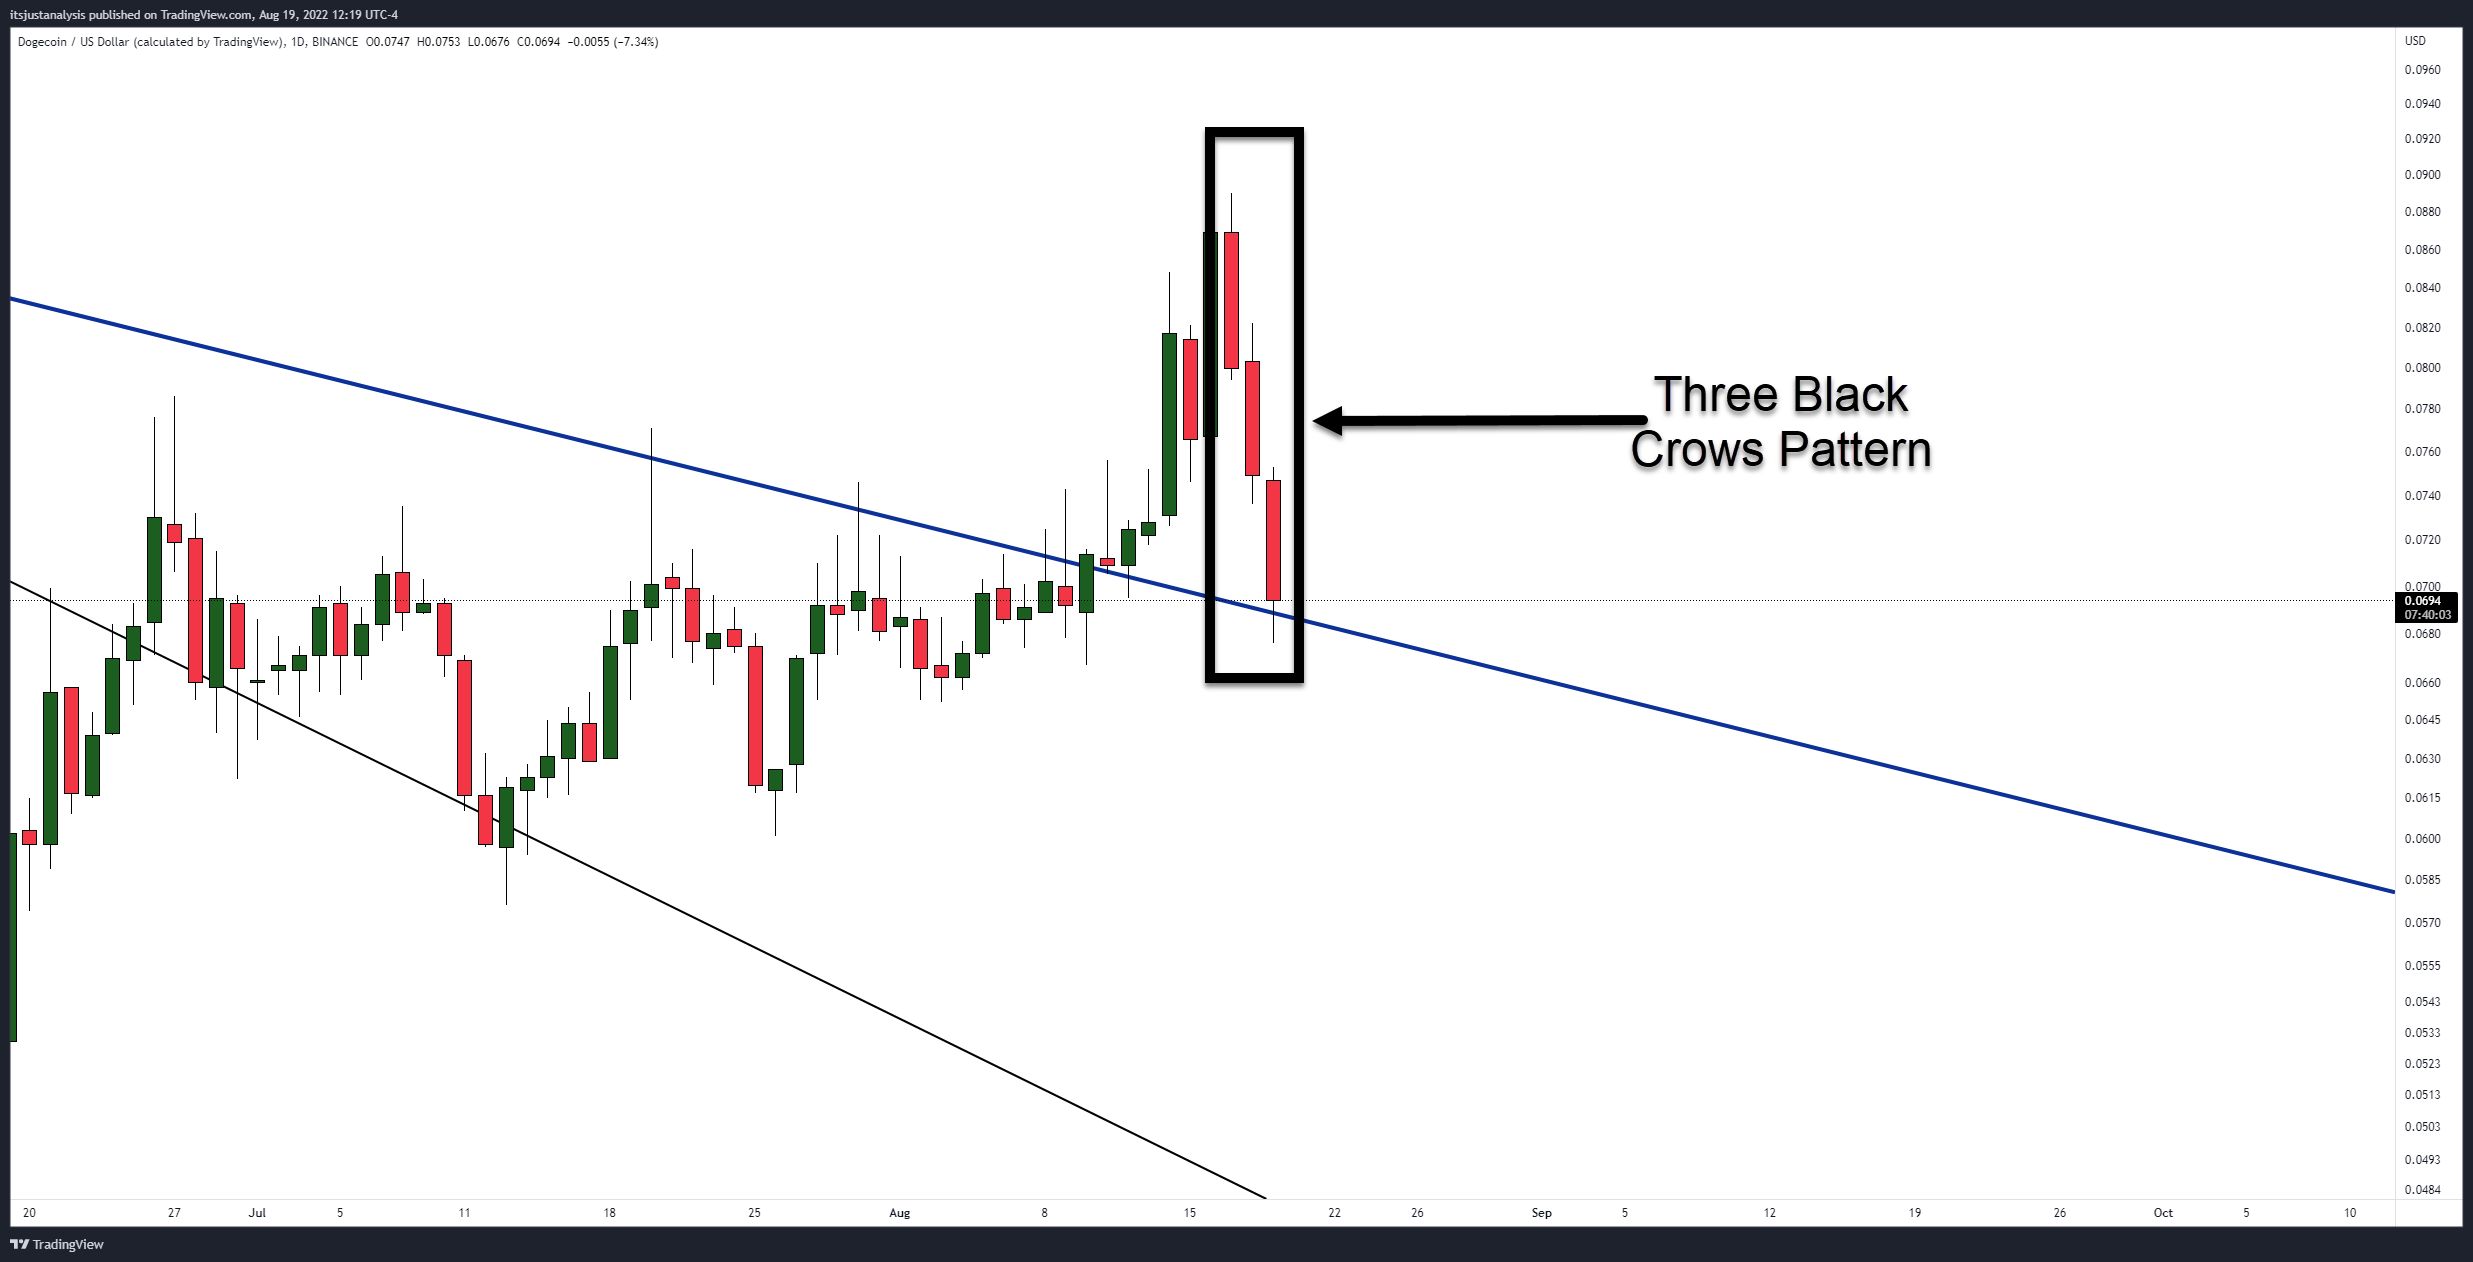
The Three Black Crows pattern is a three bar/candlestick pattern with three long-bodied candlesticks, with each candlestick close well below the prior candlestick. This pattern is interpreted as an uptrend killer – but there’s a caveat with this pattern working in the bears’ favor.
The caveat is the pattern is only statistically significant if it forms after a clear and strong uptrend. Is Dogecoin in an uptrend? From the June 18 open of $0.0527 to the most recent swing high of $0.0917 on August 16, Dogecoin rallied 74%.
Is 74% an uptrend for Dogecoin? Some would argue that it is – and some would say it’s a nothing-burger. Nevertheless, no doubt the pattern, if complete, will suck in a lot of aggressive short-traders – so conservative bears are watching where Dogecoin closes the daily.
A close above the trendline gives bulls a strong case for this move being a pullback and nothing more. But a close below the trendline could signal a failed retest and resumption of the prior bear market. 🐕