It’s been a while since we’ve done a Technically Speaking article, but Bitcoin’s ($BTC.X) Point and Figure chart warrants a peak.
The funky light-red triangles you see on the chart below are part of a type of pattern analysis known as a Harmonic Pattern. Harmonic Patterns are Fibonacci retracement and extension structures that, for whatever reason, develop in every market in every time frame.
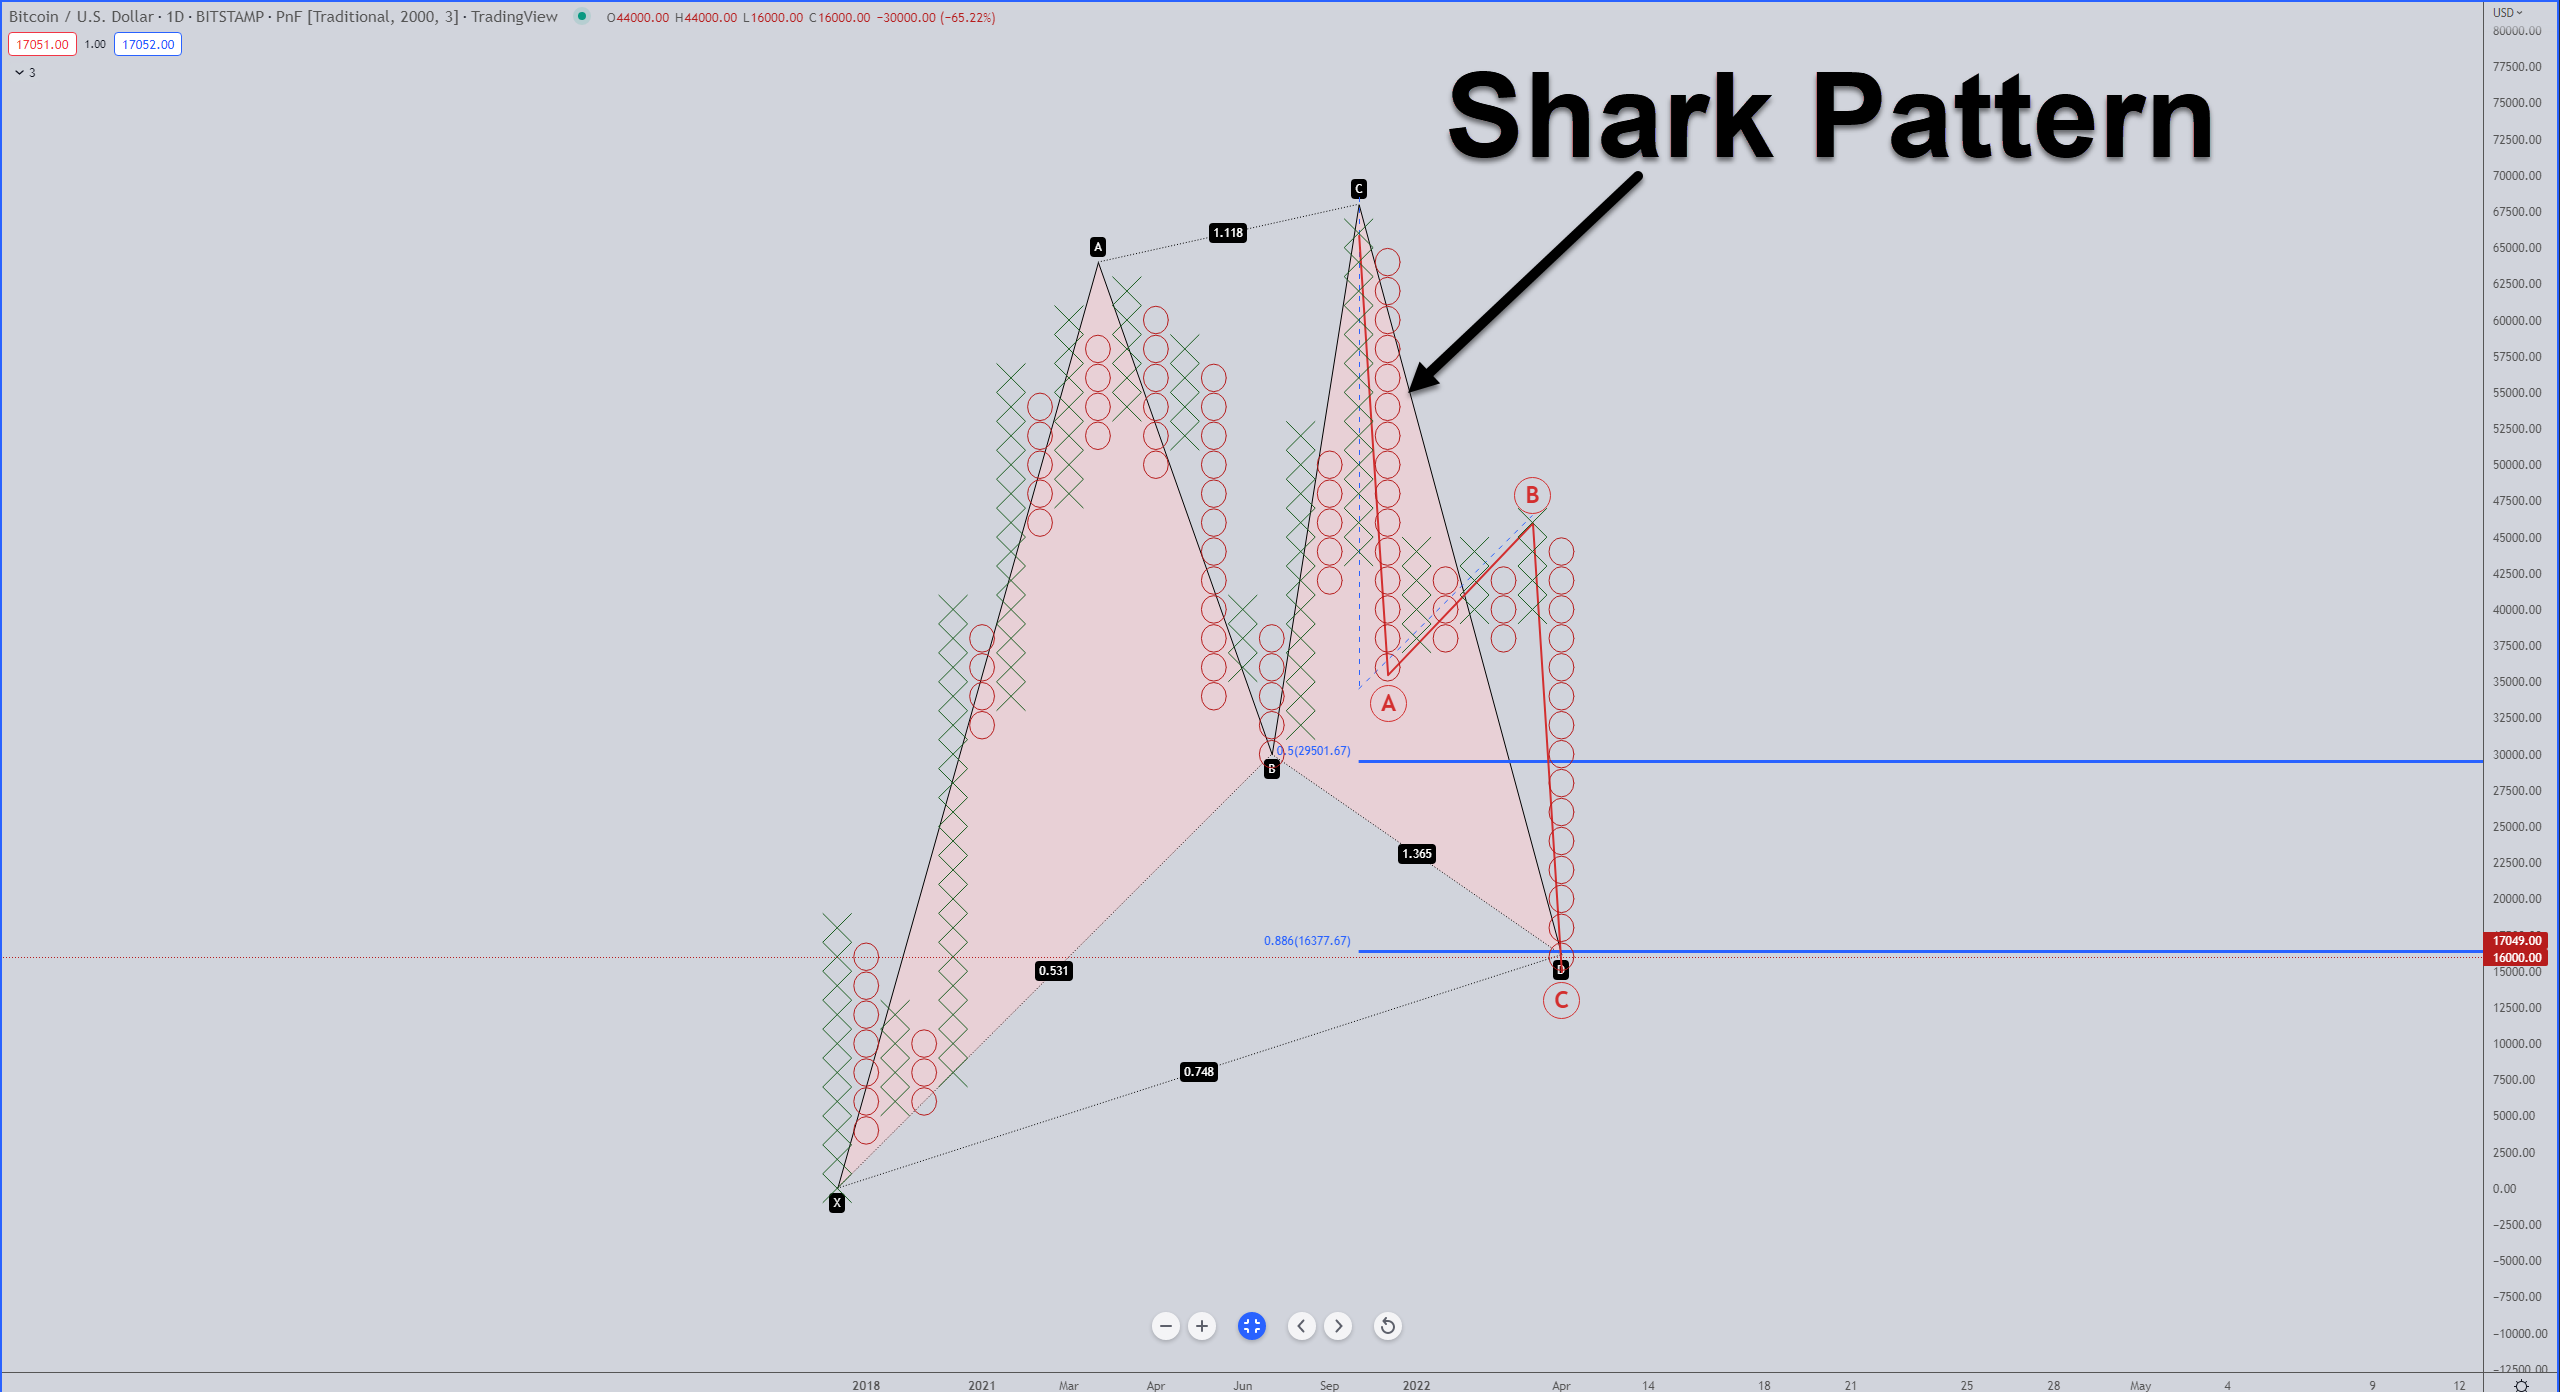
The pattern on Bitcoin’s Point and Figure chart is one of Scott Carney’s discoveries – The Shark. It’s one of his newest discoveries and, according to his work on harmonic patterns, has a very high positive expectancy rate of generating a market reversal.
The endpoint of this pattern, D, is contingent on hitting the critical 88.6% Fibonacci level that Bitcoin has hit.
Complimenting the Shark Pattern’s endpoint at $16,000 is an AB=CD Pattern.
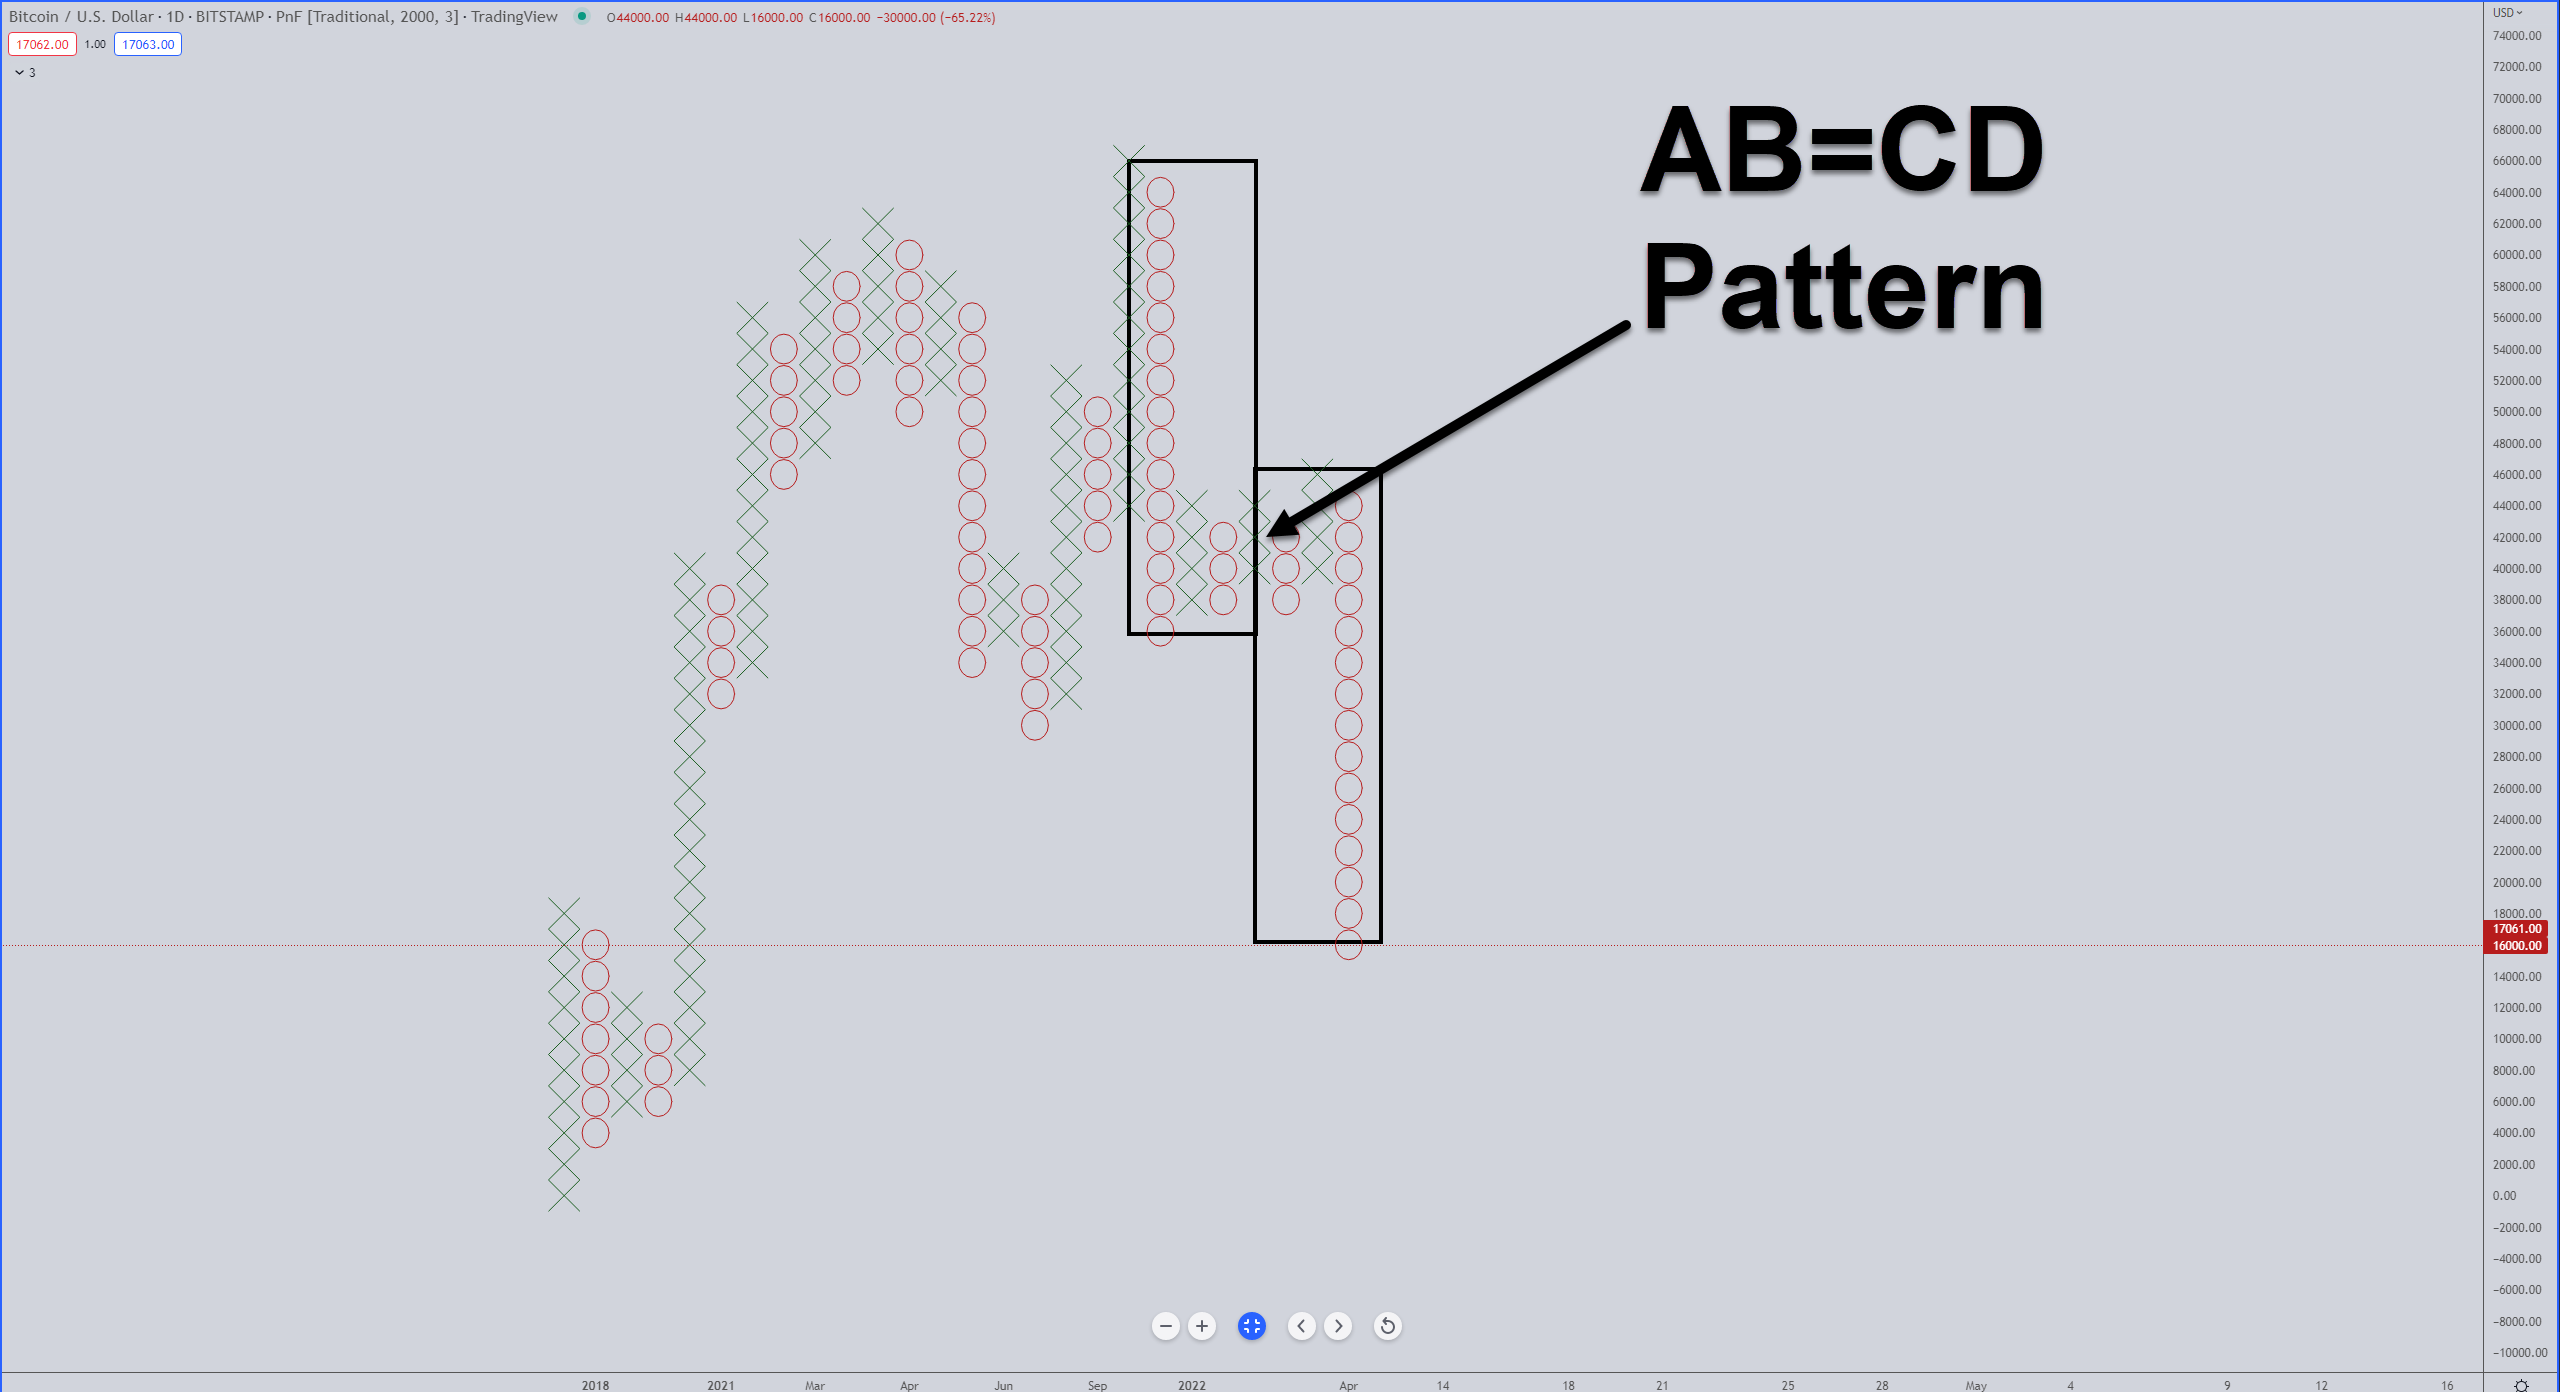
Analysts look for AB=CD patterns to help identify if a market is at or near a turning point.
Two prior Technically Speaking articles highlight the timing and price levels analysts currently look at for Bitcoin.
The first is the August 22, 2022, Technically Speaking article that identified the $13,000 to $16,000 range as a possible end point for a Wave 5 in Elliot Wave Theory.
The second is the September 2, 2022, Technically Speaking article pointing to an upcoming Kumo Twist on Bitcoin’s monthly Ichimoku chart. Ichimoku traders and analysts look for Kumo Twists because they can help identify possible market turning points, especially if that market is trending strongly into the Kumo Twist – which Bitcoin currently is.
The final consideration that some analysts see for Bitcoin finding at least a strong corrective move soon is the current O-column itself.
This current column of O’s developed on April 11, 2022, and has not had a reversal yet. Except for the beginning of Bitcoin’s life cycle, the current O-column is the longest-lasting column in Bitcoin’s history.
One more piece of analysis on the current O-column: it is called a Spike Pattern in Point and Figure analysis (any column with 15 or more X’s/O’s). Spike Patterns are the definition of excess, and when they reverse, they often reverse violently and swiftly. 👨💻