Speaking of $ADA.X.
From a technical analysis perspective, Cardano looks messier than a floor after a Roomba that’s just finished a six-hour cleaning cycle and didn’t realize it started that cycle by mowing over, repeatedly, a pile of freshly laid Tibetan Mastiff poo, spreading a trail a horribleness over those six hours that a 3-year old who just discovered poopie can be used as finger paint would struggle to compete with. 💩
If you don’t want to read all the fancy schmancy technical analysis bits, look for the TL;DR (Too Long; Didn’t Read) below.
Cardano
Cardano hit a new 21-day high today, and yesterday’s close is already the highest of the last 21 days.
On Cardano’s weekly chart below, I placed arrows pointing to things you can ignore as they’re not immediately relevant to this analysis.
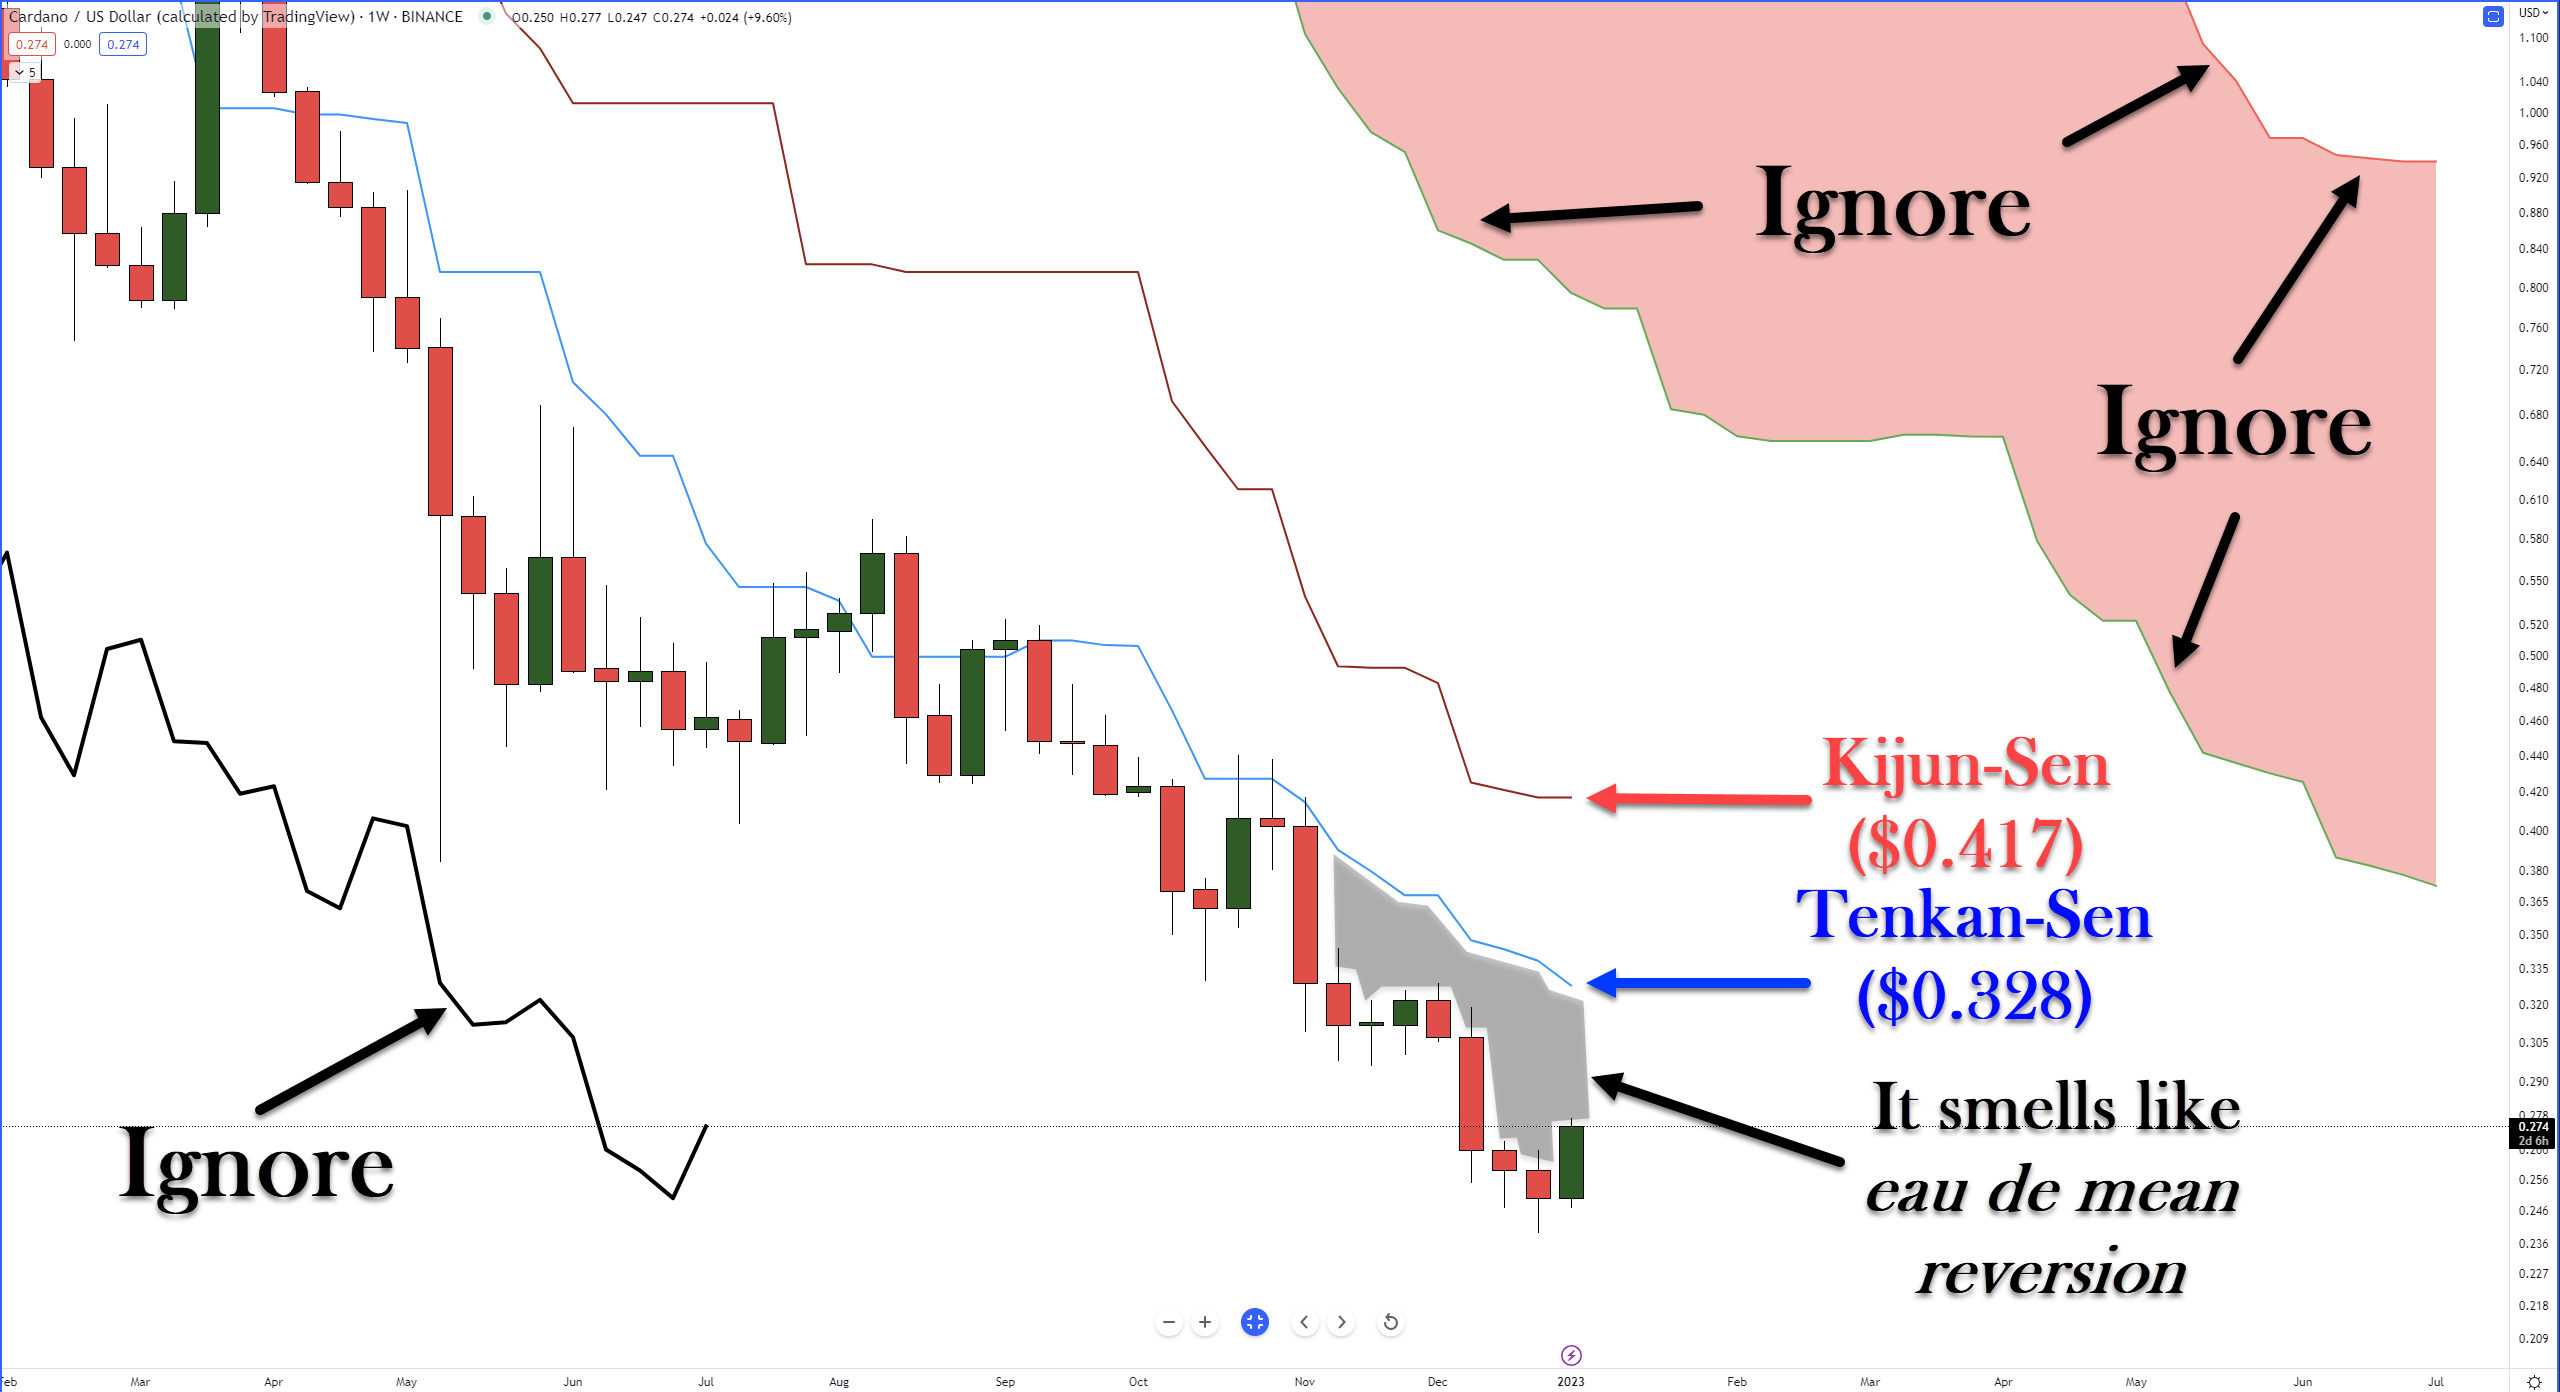
From an Ichimoku perspective, the most immediate and important factor that analysts see is the shaded black/grey zone between the candlesticks and the Tenkan-Sen. ⚠️
Why?
Because large gaps between the Tenkan-Sen and the bodies of candlesticks often ‘fill’ within four to five periods, the end of this week brings it to seven without a return to the Tenkan-Sen.
How probable is it that Cardano will return to the Tenkan-Sen? Let’s take a peek at the weekly oscillators, too.
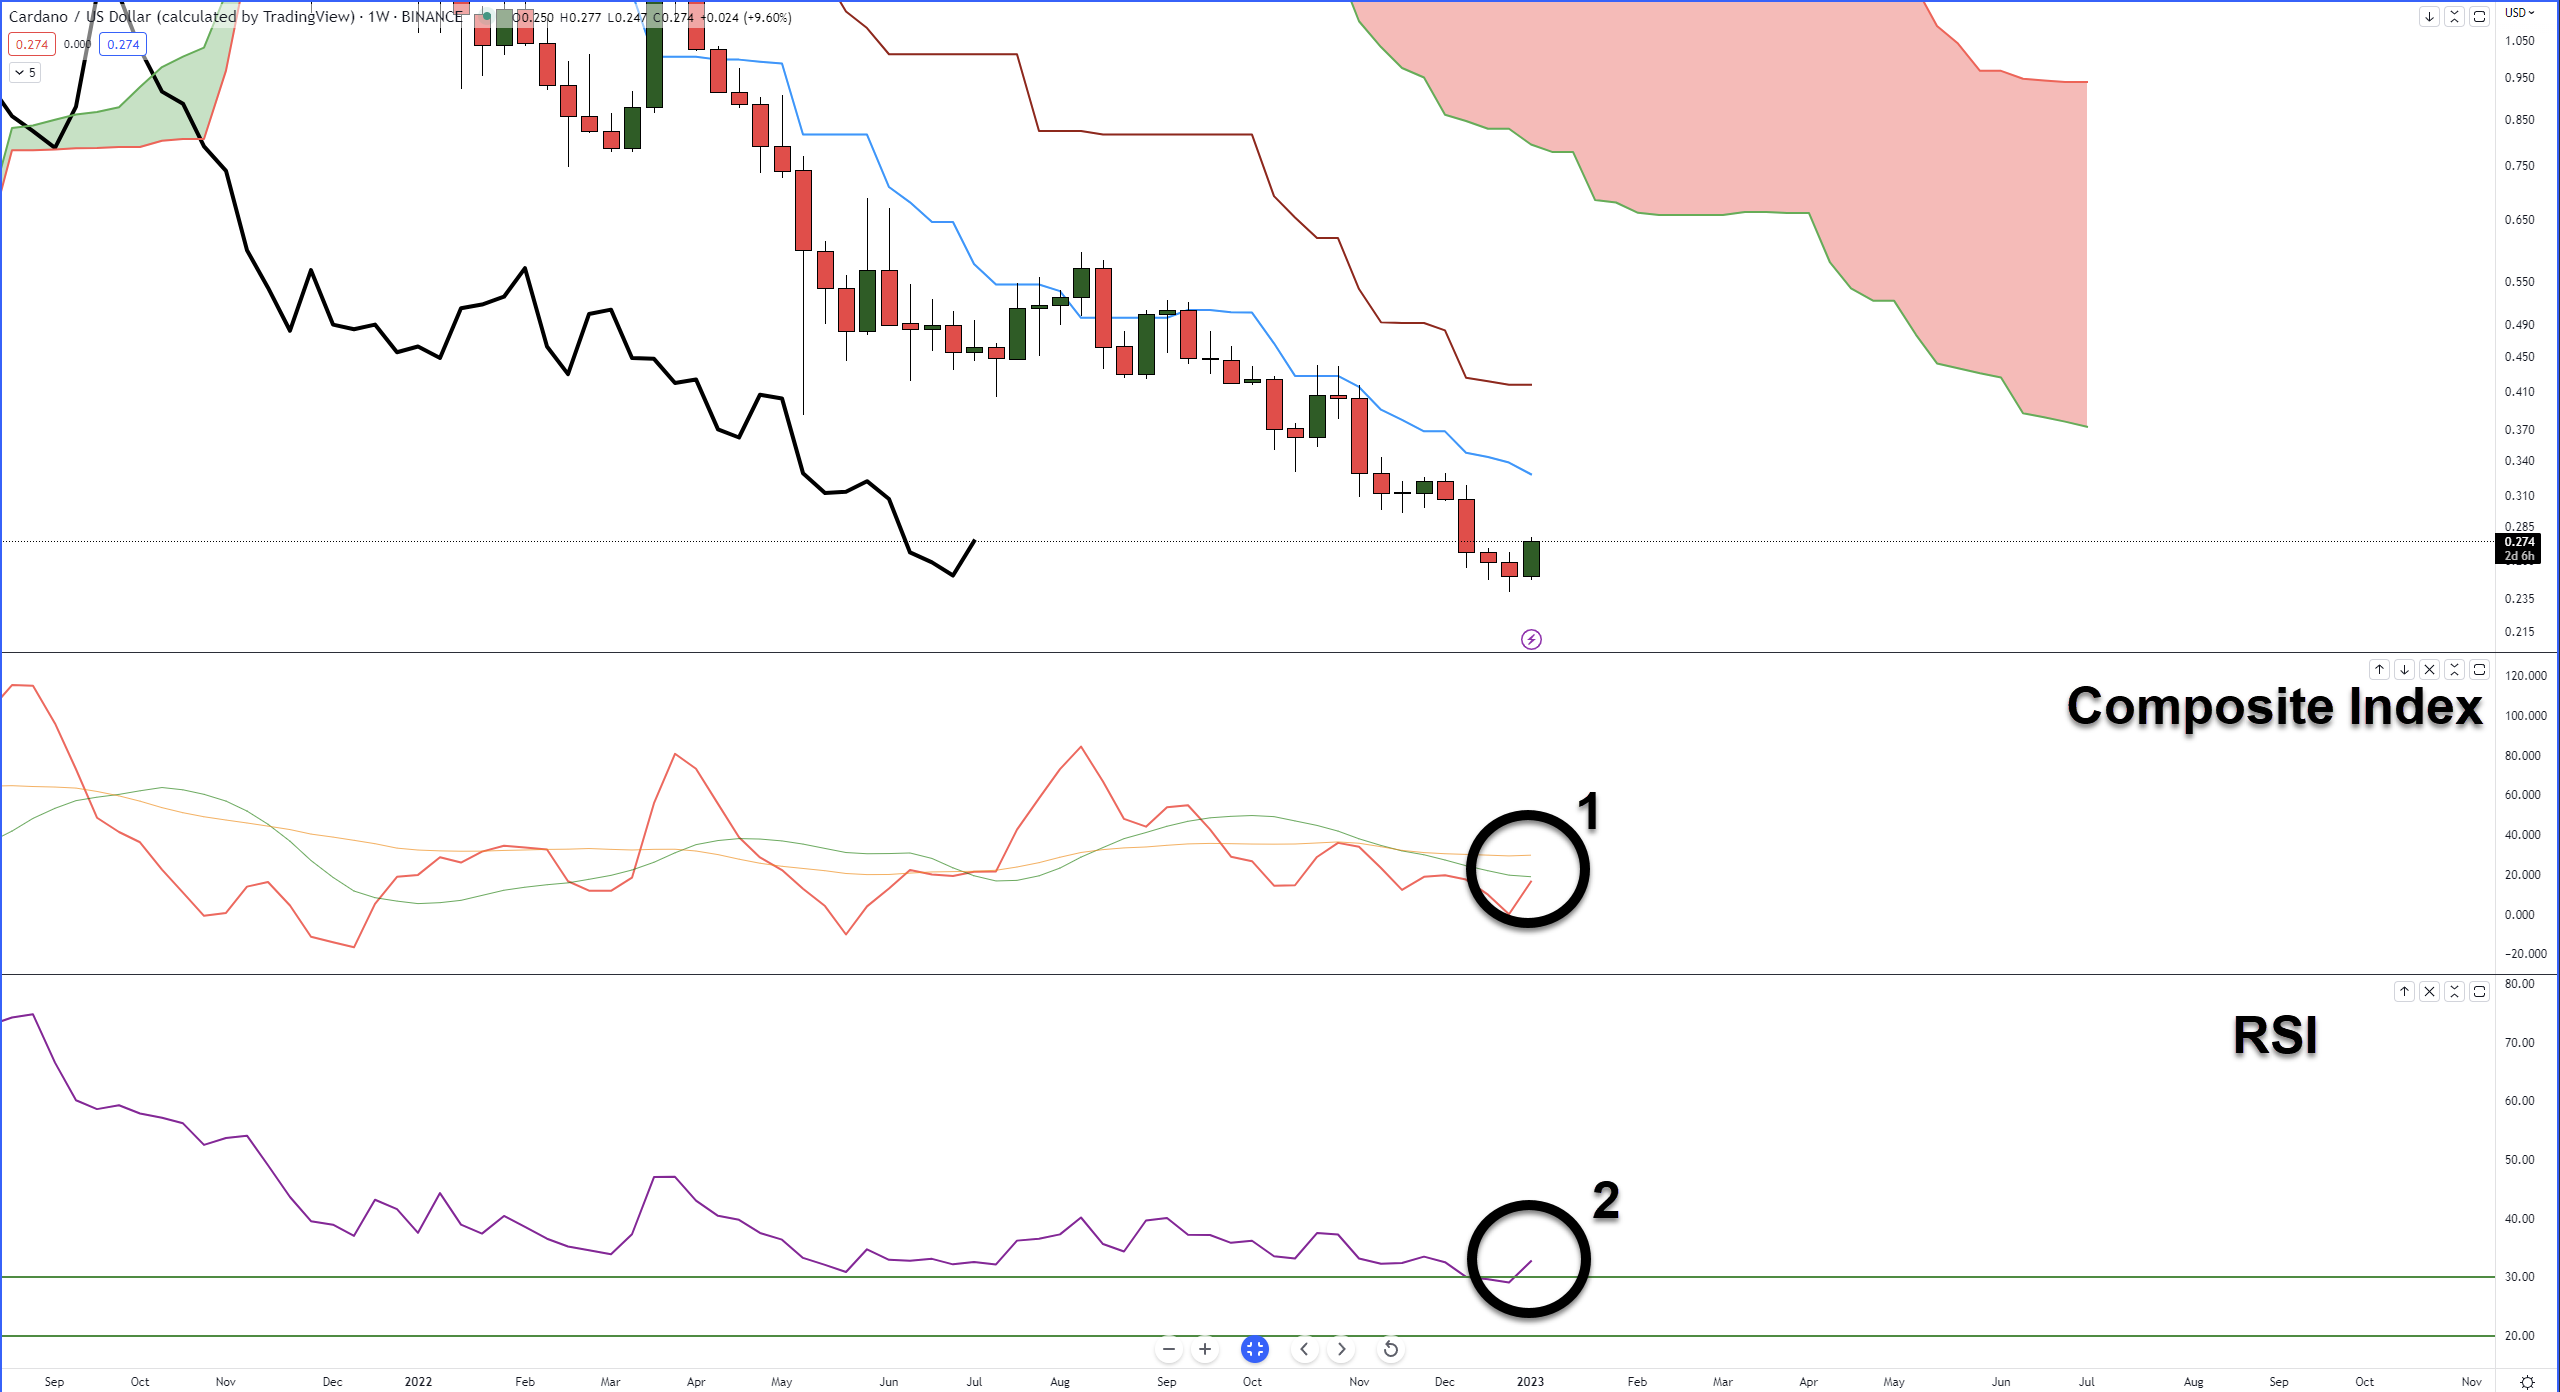
The Composite Index and the RSI have sharp moves higher, with the RSI showing a return above the first oversold level (#2) in a bear market, 30.
However, the weekly RSI has been stuck between the 35 and 30 levels since October 2022, and there’s no reason it couldn’t remain that way.
For the Composite Index, the CI line’s (red) angle suggests (#1) that if momentum remains strong going into next week, it will likely cross above its fast average (green) and, possibly, its slow average (yellow). 👀
Analysts see the primary and strongest resistance for Cardano at the weekly Kijun-Sen, which is also the 50% Fibonacci retracement (not shown) of last week’s swing-low at $0.239 and the high of the weekly May 9, 2022, strong bar.
The daily chart for Cardano (not shown) faces resistance against the daily Kijun-Sen at $0.279, while the daily RSI is up against the first overbought level in a bear market, 55.
TL;DR
Near-term resistance: $0.279
Intermediate resistance: $0.328
Primary resistance: $0.417
Analysts anticipate some resistance in the $0.279 value area, but any sustained breakout above that level is likely to continue toward the Intermediate and/or Primary resistance level(s). 🔭
The trend remains extremely bearish, and the path of least resistance remains lower despite recent bullish signs.
Bitcoin
We won’t tackle a ton on Bitcoin’s chart – we hit it pretty hard in Wednesday’s Litepaper. 🪙
Not trying to throw any shade here on the bulls, but while the mood of crypto enthusiasts is somewhat upbeat, analysts warn that caution should still be the name of the game. And this is especially true if we take another look at Bitcoin’s monthly chart.
Wednesday’s Technically Speaking article highlighted several bullish considerations for Bitcoin, but there are some major red flags, too.
The Ichimoku Cloud (Kumo) is an important barometer of how analysts, traders, and investors interpret an instrument’s sentiment. Above the Cloud is interpreted as bullish, and below is bearish.
Thick Clouds represent strength, indecision, and volatility. Thin Clouds, however, represent weakness. It’s as if the closer Senkou Span A and Senkou Span B are to each other, the weaker they become. So, theoretically, the behavior that analysts expect to see when price approaches a thin Cloud is an easy time moving past/through it.
This is where things get very, very iffy. 🤔
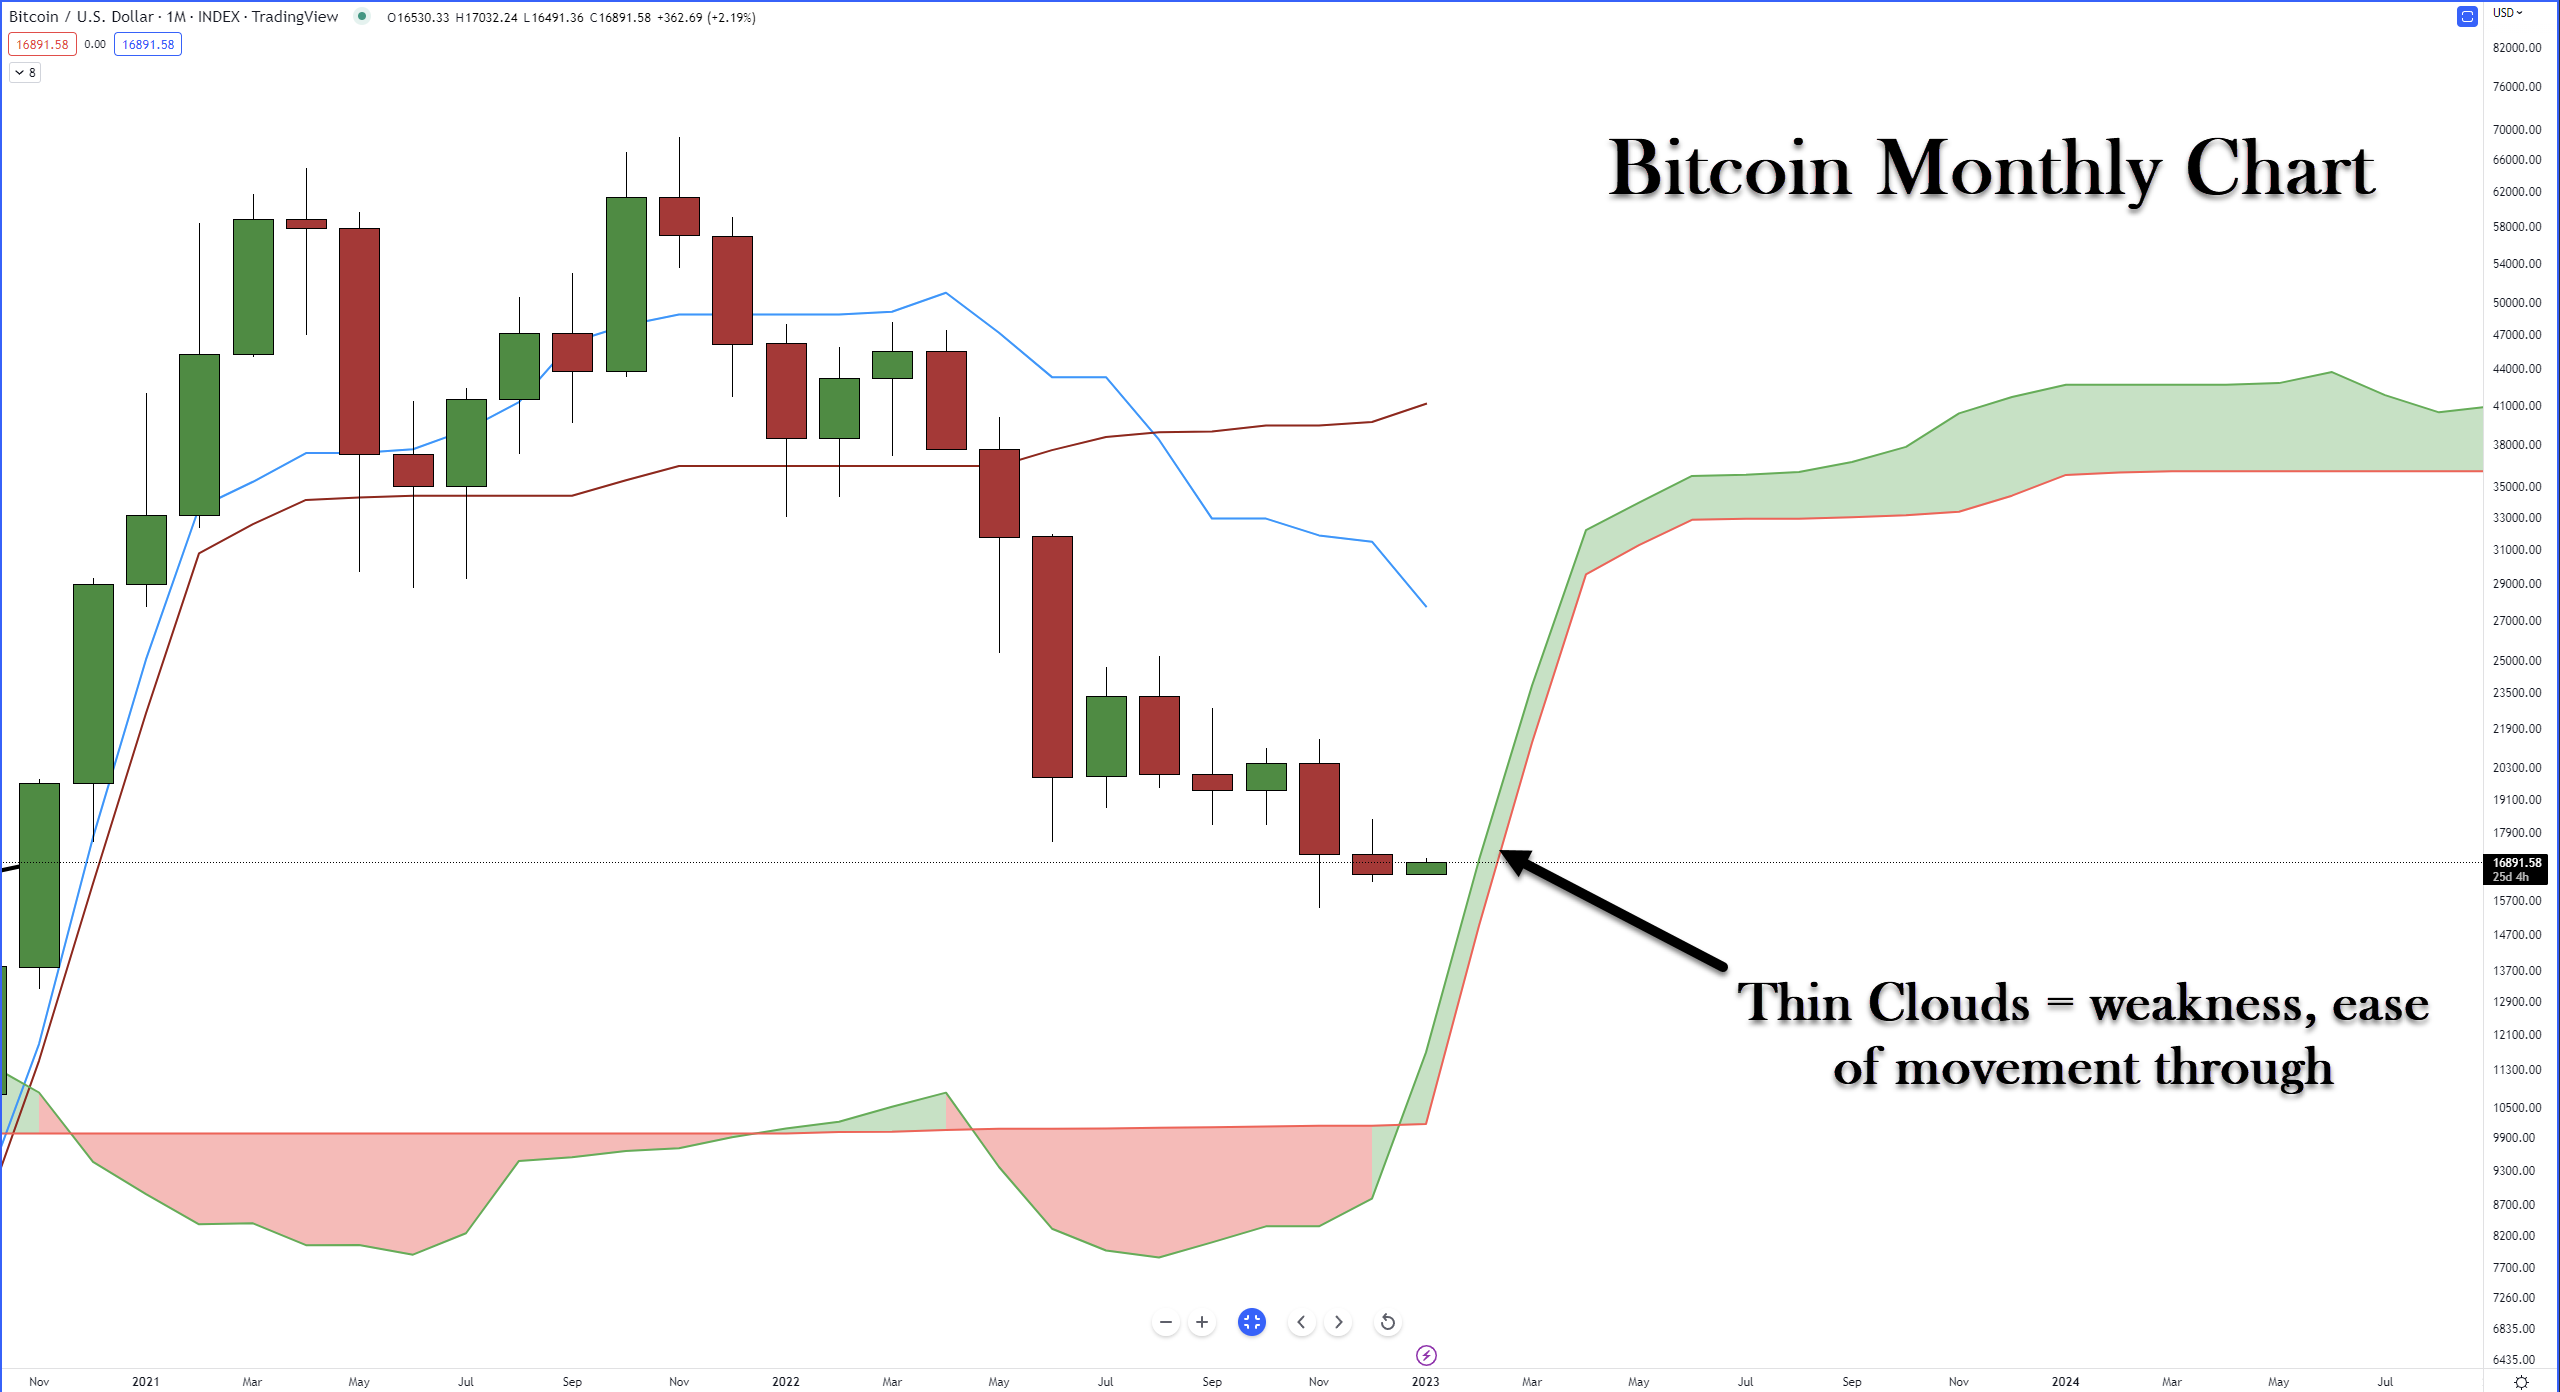
Except for the quick crash and rally from the Covid crash in 2020, Bitcoin has never fallen below the Ichimoku Cloud. In fact, Bitcoin is still so young that the first time its monthly chart had a complete Ichimoku chart was in December 2016!
What analysts, investors, and traders do know is this: risk-on appetite is low across the board in all asset classes, and crypto represents the riskiest of the risky assets out there. And the Cloud for Bitcoin is very, very thin.
If you’re interested in learning more about the Ichimoku Kinko Hyo system, read our introduction to Ichimoku here. 🤔