Bitcoin
Bitcoin has been on an absolute tear this week – but some conservative, bullish analysts warn that a temporary top might be coming in soon.
Ichimoku traders are likely giddy. Yesterday’s close confirmed an Ideal Bullish Ichimoku Breakout – one of the most sought-after and conservative bullish confirmation patterns within the Ichimoku Kinko Hyo System.
However, there are some warning signs.
The first major gap between the Tenkan-Sen and the body of a candlestick occurred today. That doesn’t mean imminent profit-taking or selling pressure, but it is a warning that if BTC continues to scream higher and more gaps develop, a correction will likely occur within four to five periods.
Bitcoin’s daily RSI and Composite Index levels are also at extremes.
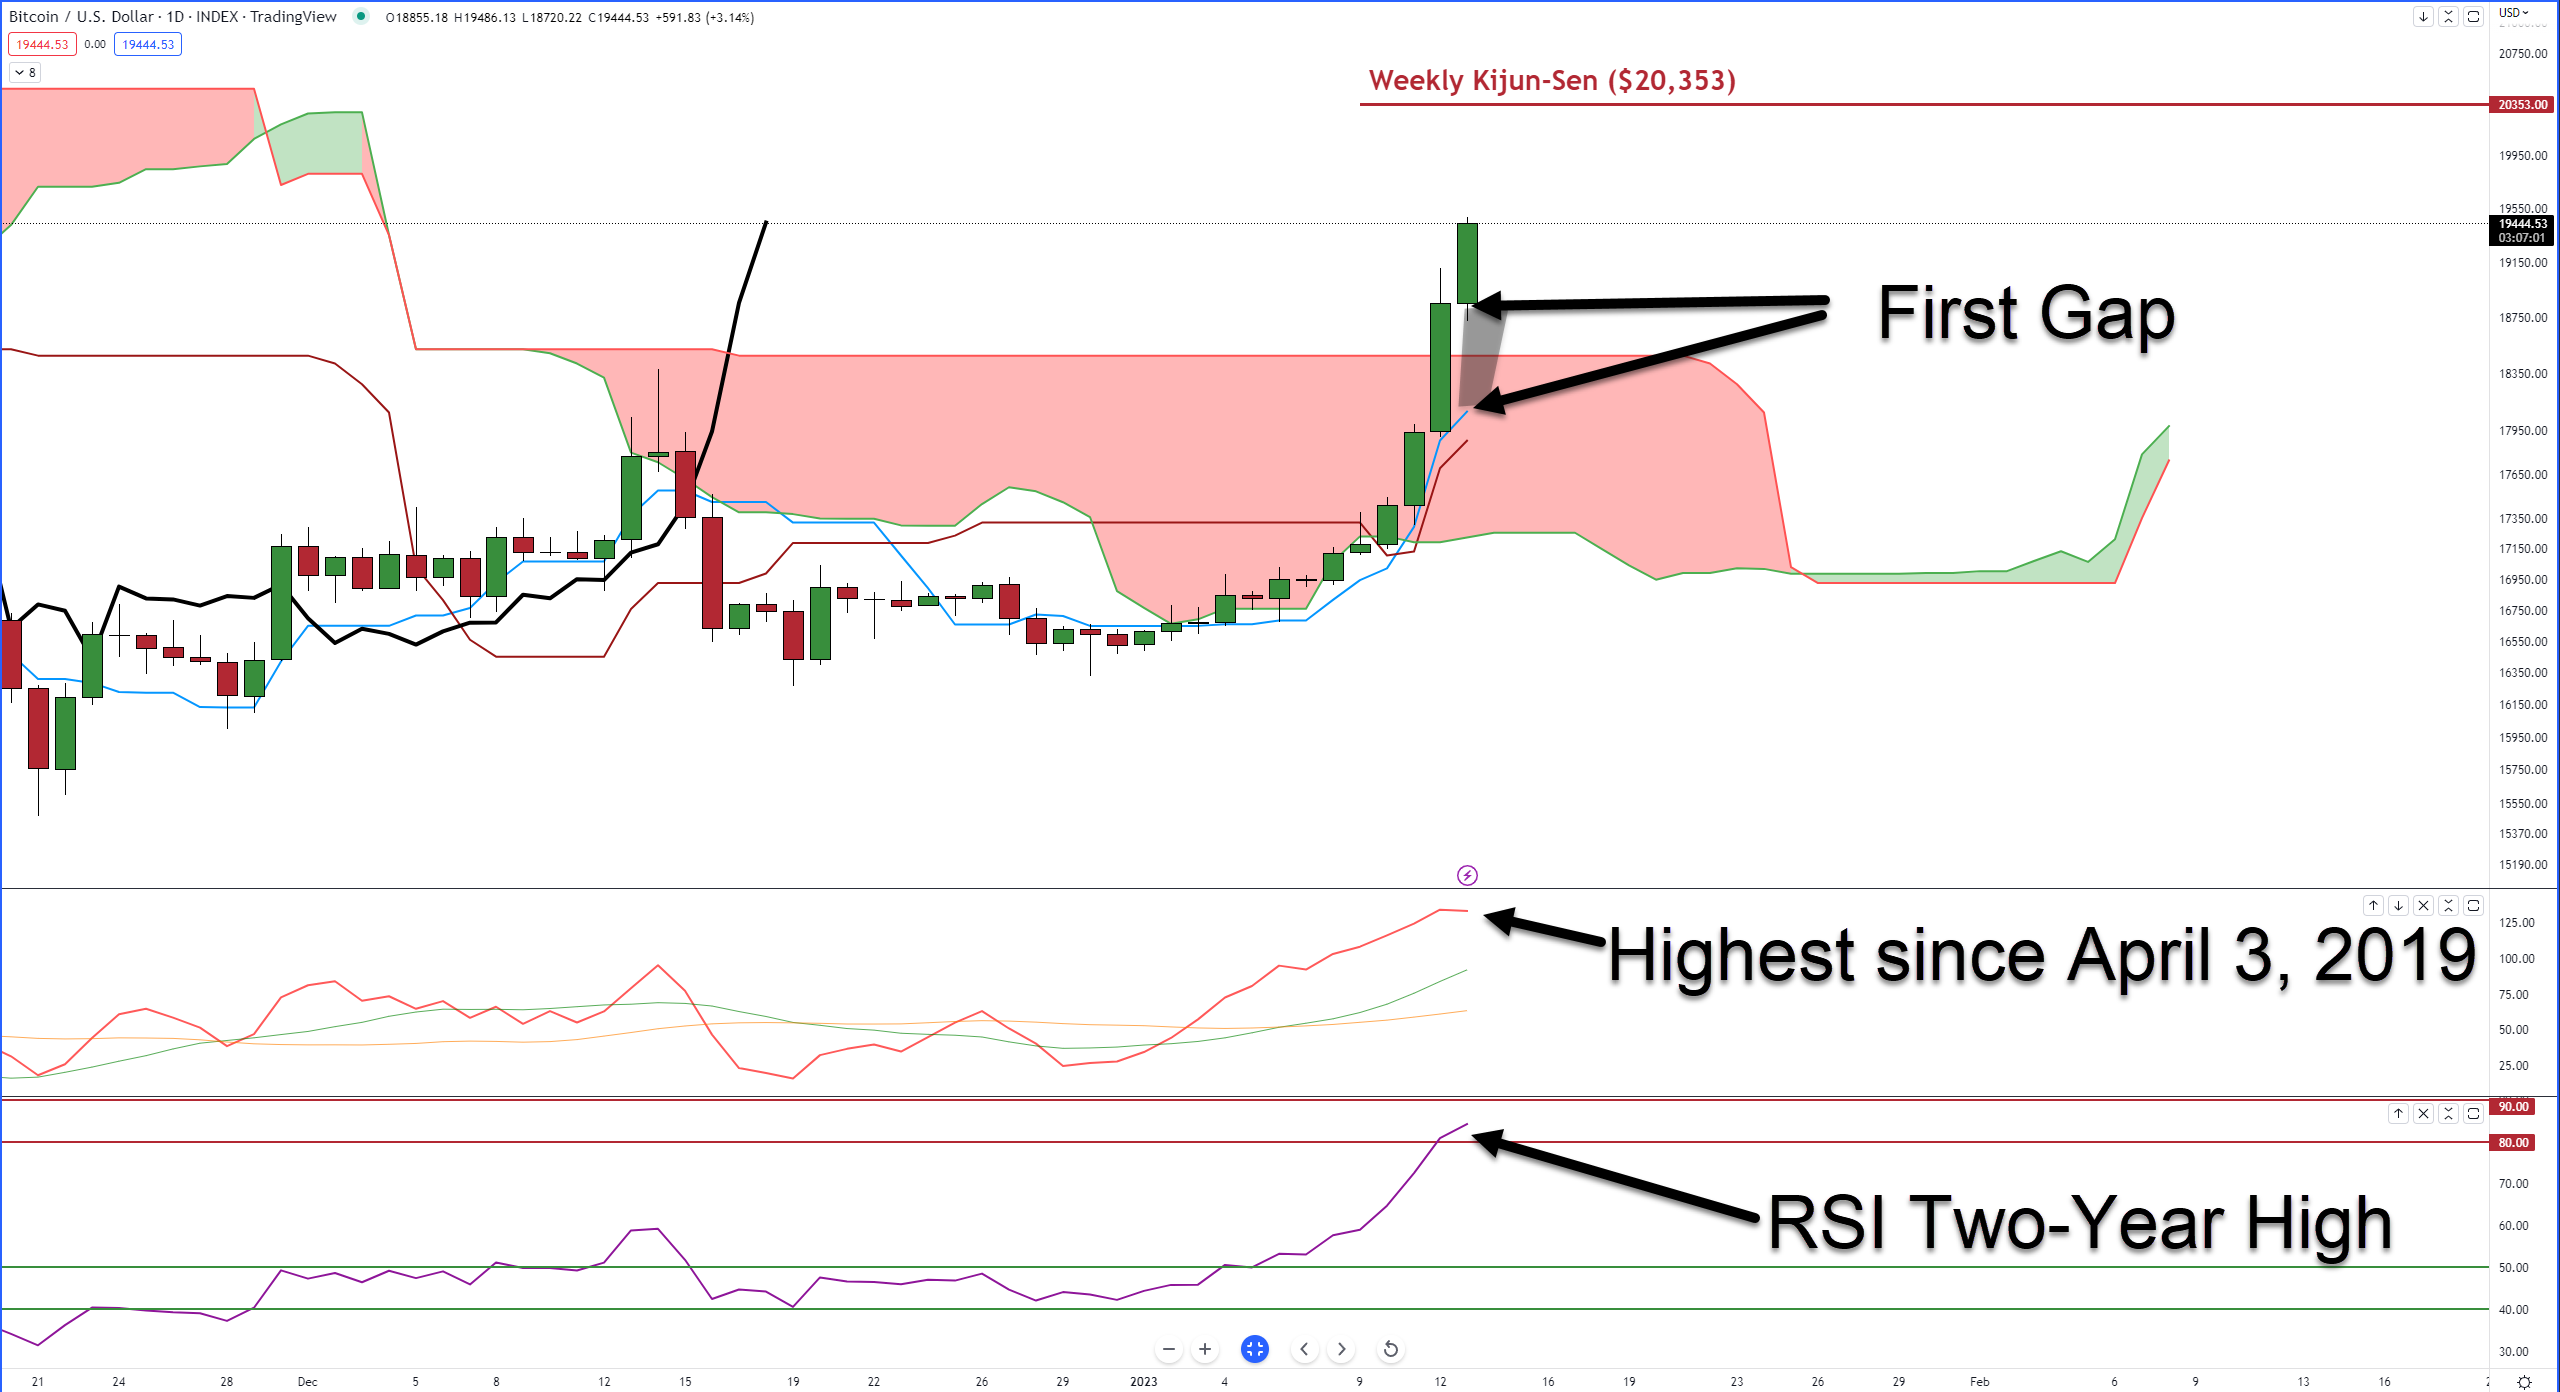
The last time Bitcoin’s daily RSI was this high was two years ago (almost exactly), on January 11, 2021. Similarly, the Composite Index is at its highest since April 3, 2019.
From an oscillator perspective, on the daily chart at least, Bitcoin’s RSI converted into bull market conditions (Oversold 40 and 50, Overbought 80 and 90).
Analysts believe that, given the bullish momentum behind an Ideal Bullish Ichimoku Breakout, a return to the weekly Kijun-Sen at $20,353 is a very probable scenario, and it is there, Bitcoin may face some very real selling pressure.
Update
Here is a quick update on the Ethereum and XRP analysis from Monday:
In Monday’s Technically Speaking (read it here), we looked at several critical price levels analysts saw for $ETH.X and $XRP.X.
XRP
For XRP, the resistance zone identified on Monday is presently playing out.
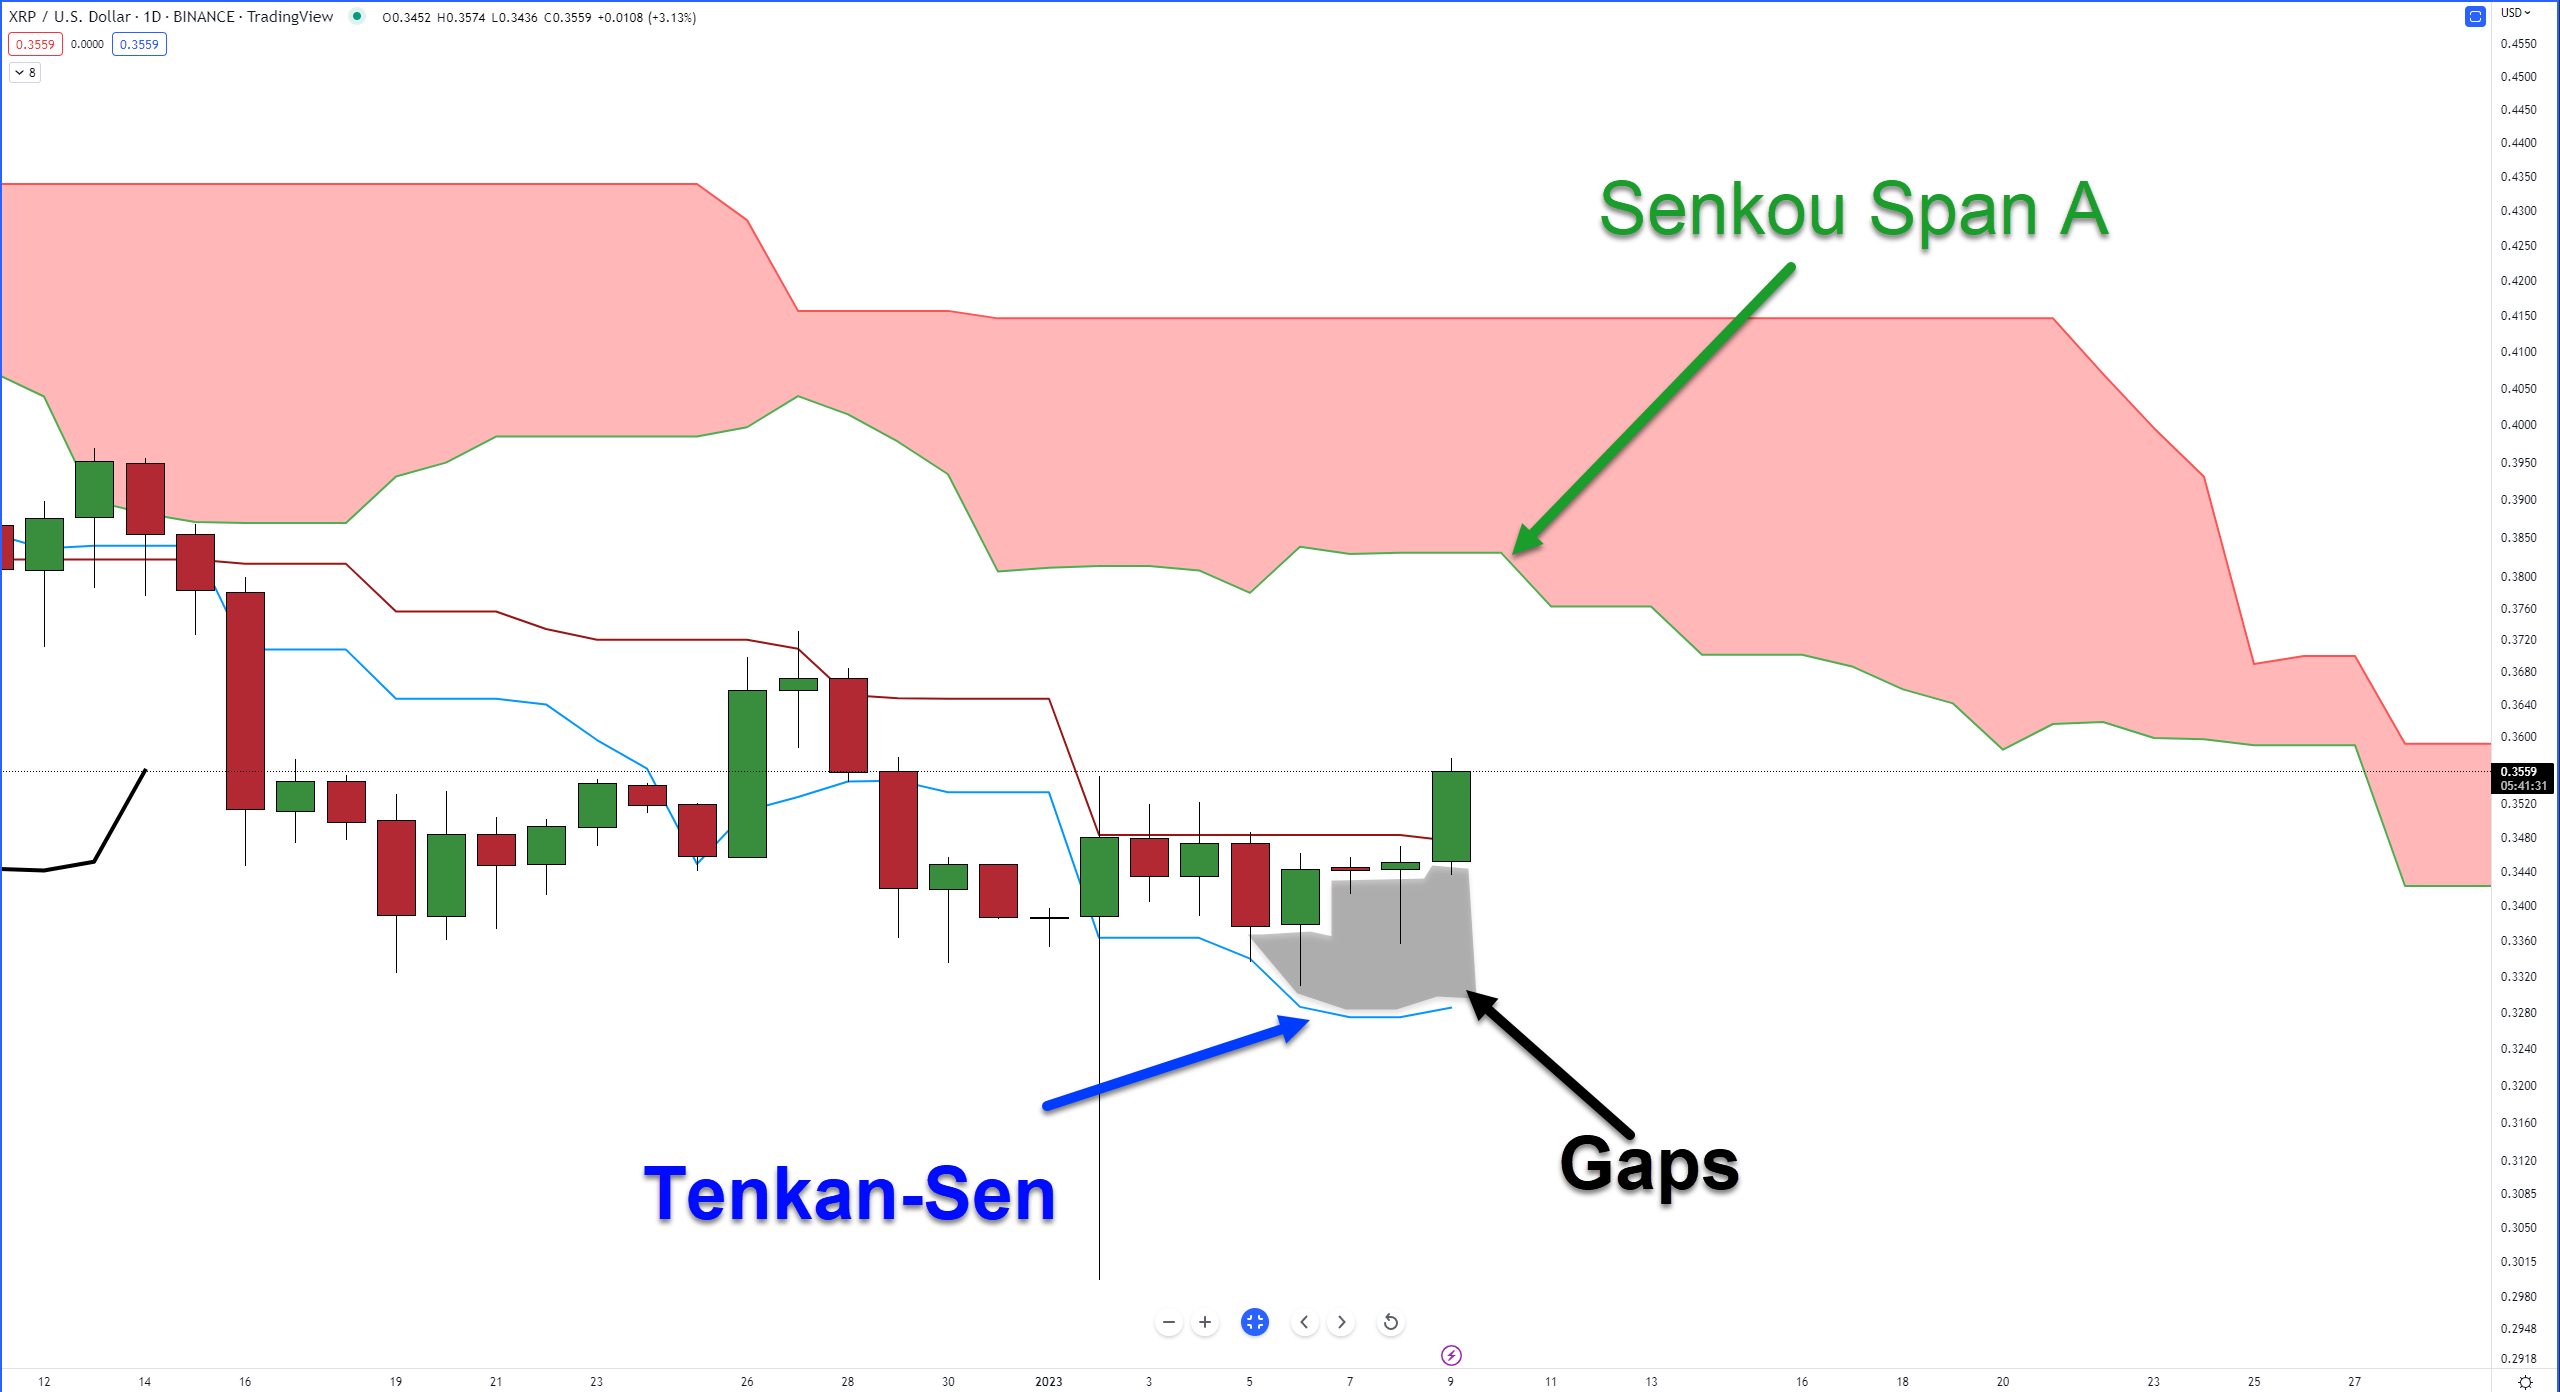
Analysts’ fears that a violent pullback could occur may still play out as the gaps between the Tenkan-Sen and the candlestick bodies are, again, present. But given the continued oversold nature of XRP and some recent bullish sentiment in crypto, it may not occur.

Ethereum
Monday’s analysis looked at Senkou Span B ($1,375) as a probable resistance zone that analysts carefully watched.
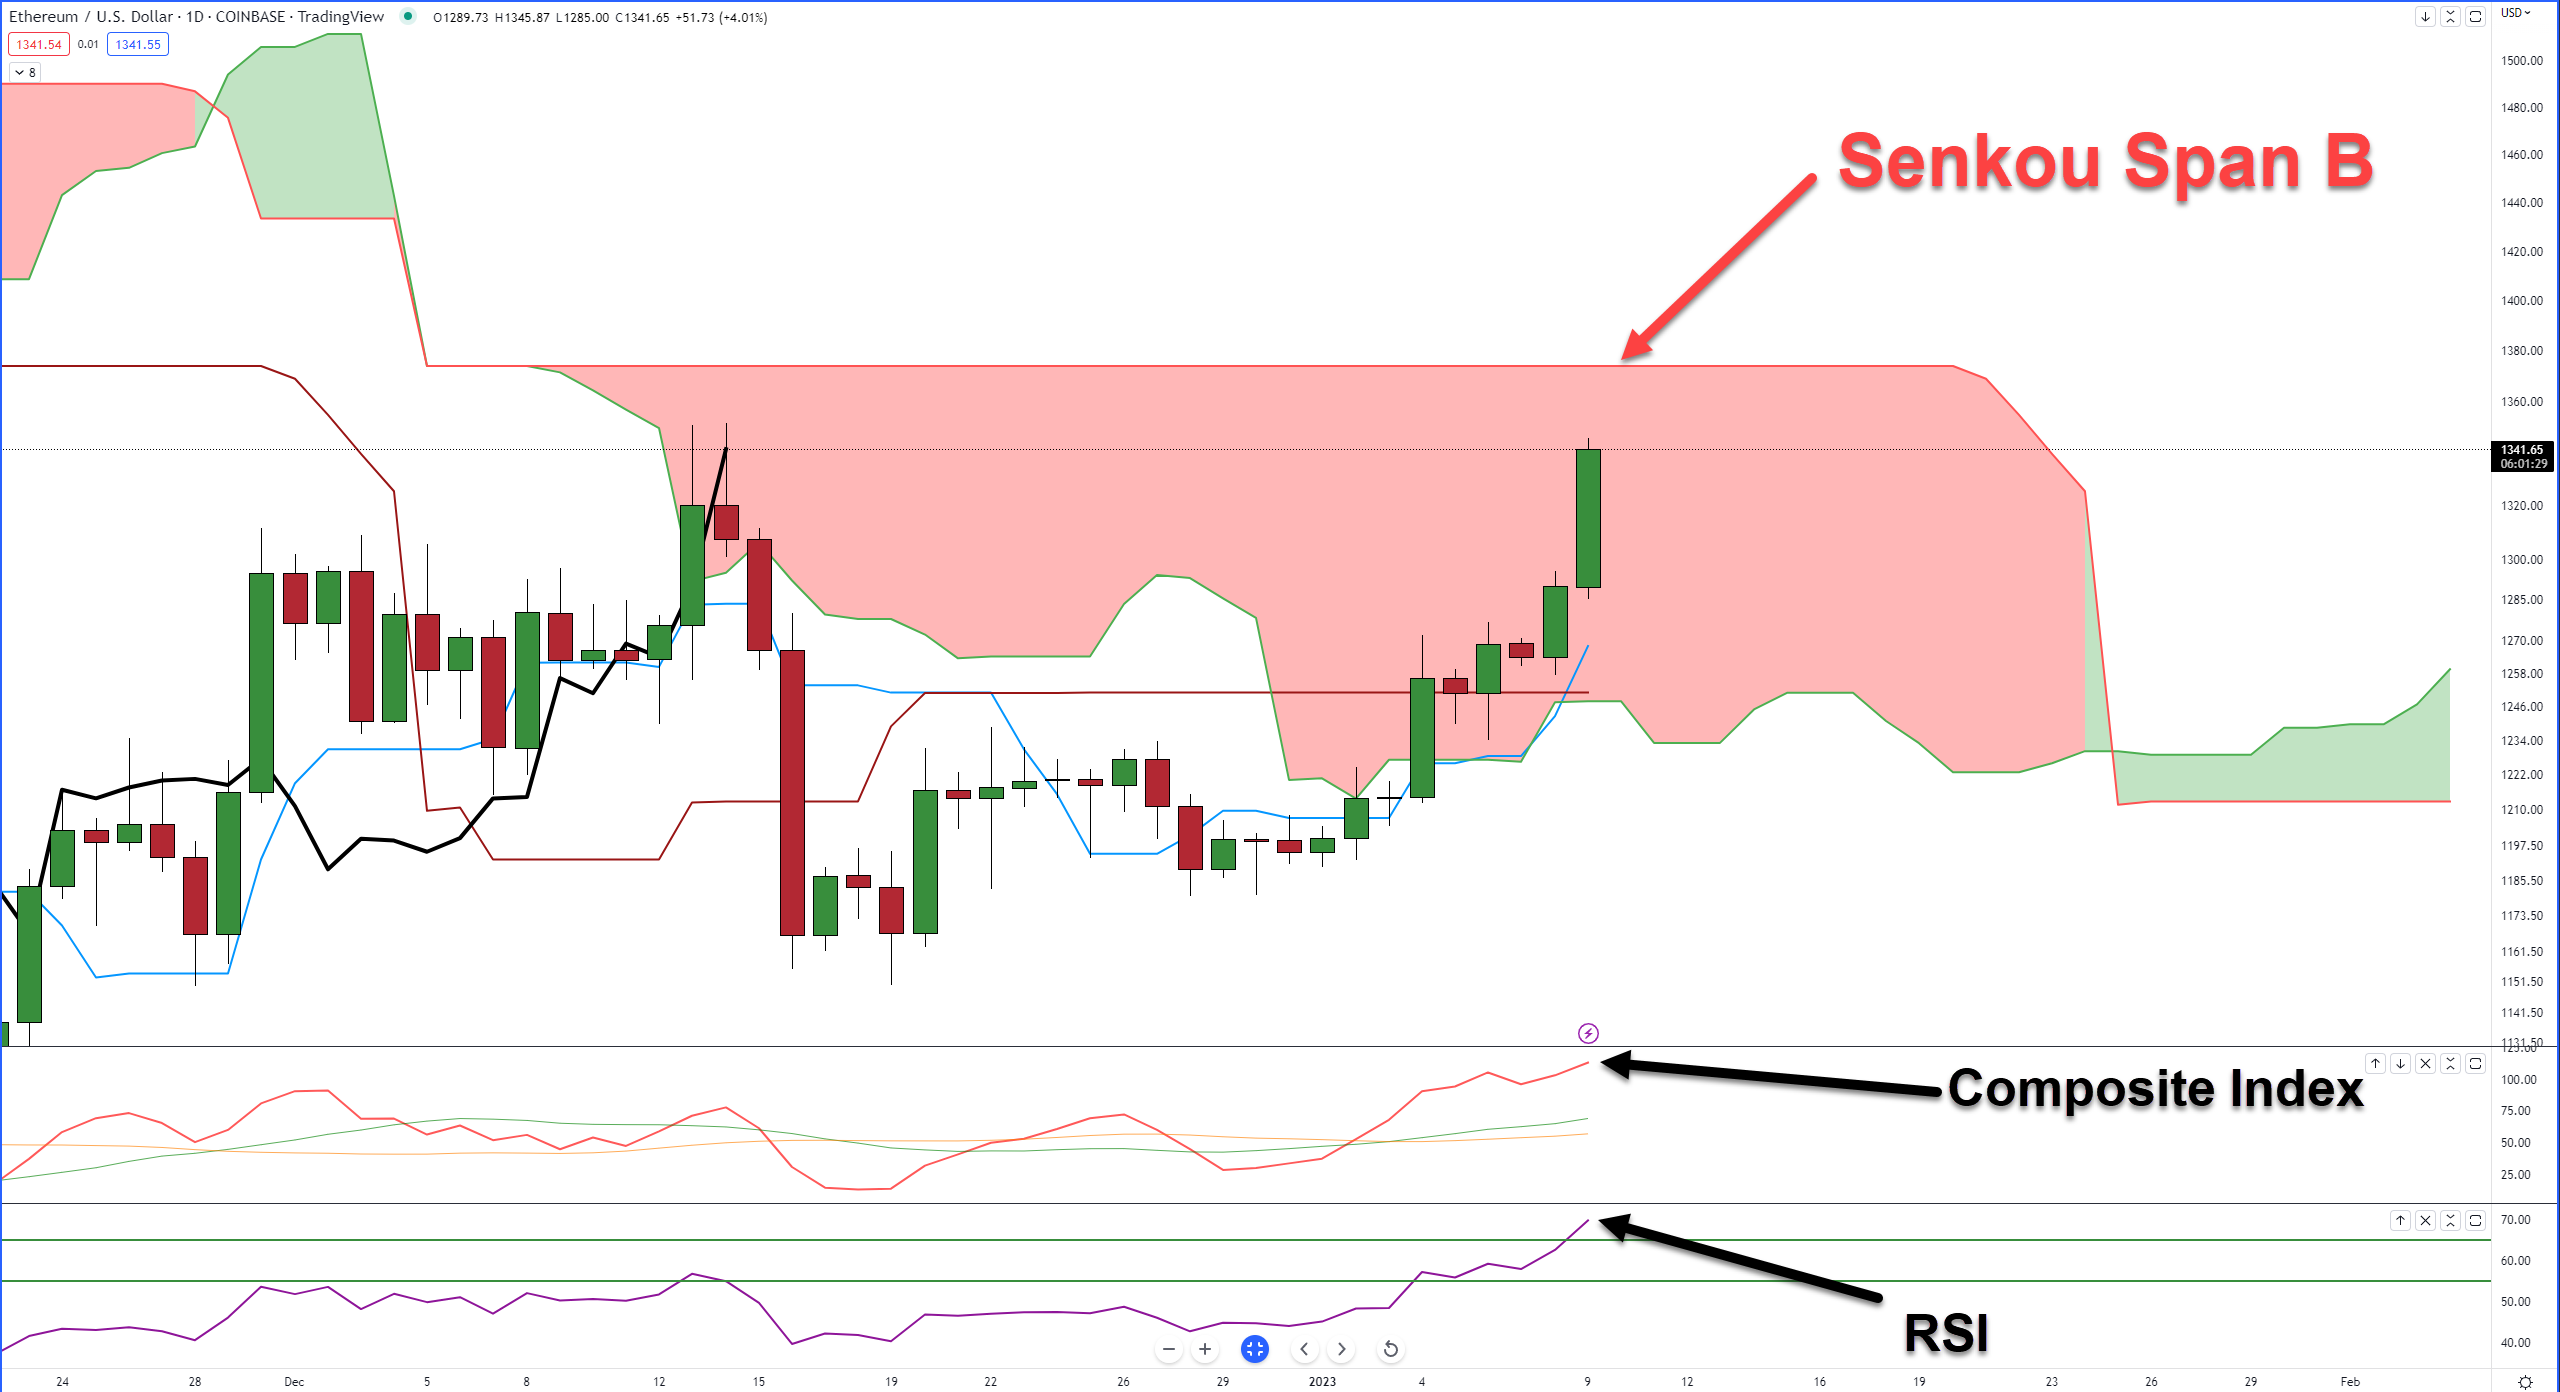
The resistance zone at Senkou Span B ($1,375) certainly looked like it was going to hold as resistance based on Tuesday’s and Wednesday’s close, but bears were unable or unwilling to stop the bulls.
Ethereum has just completed an Ideal Bullish Ichimoku Breakout – the same as on Bitcoin’s chart.
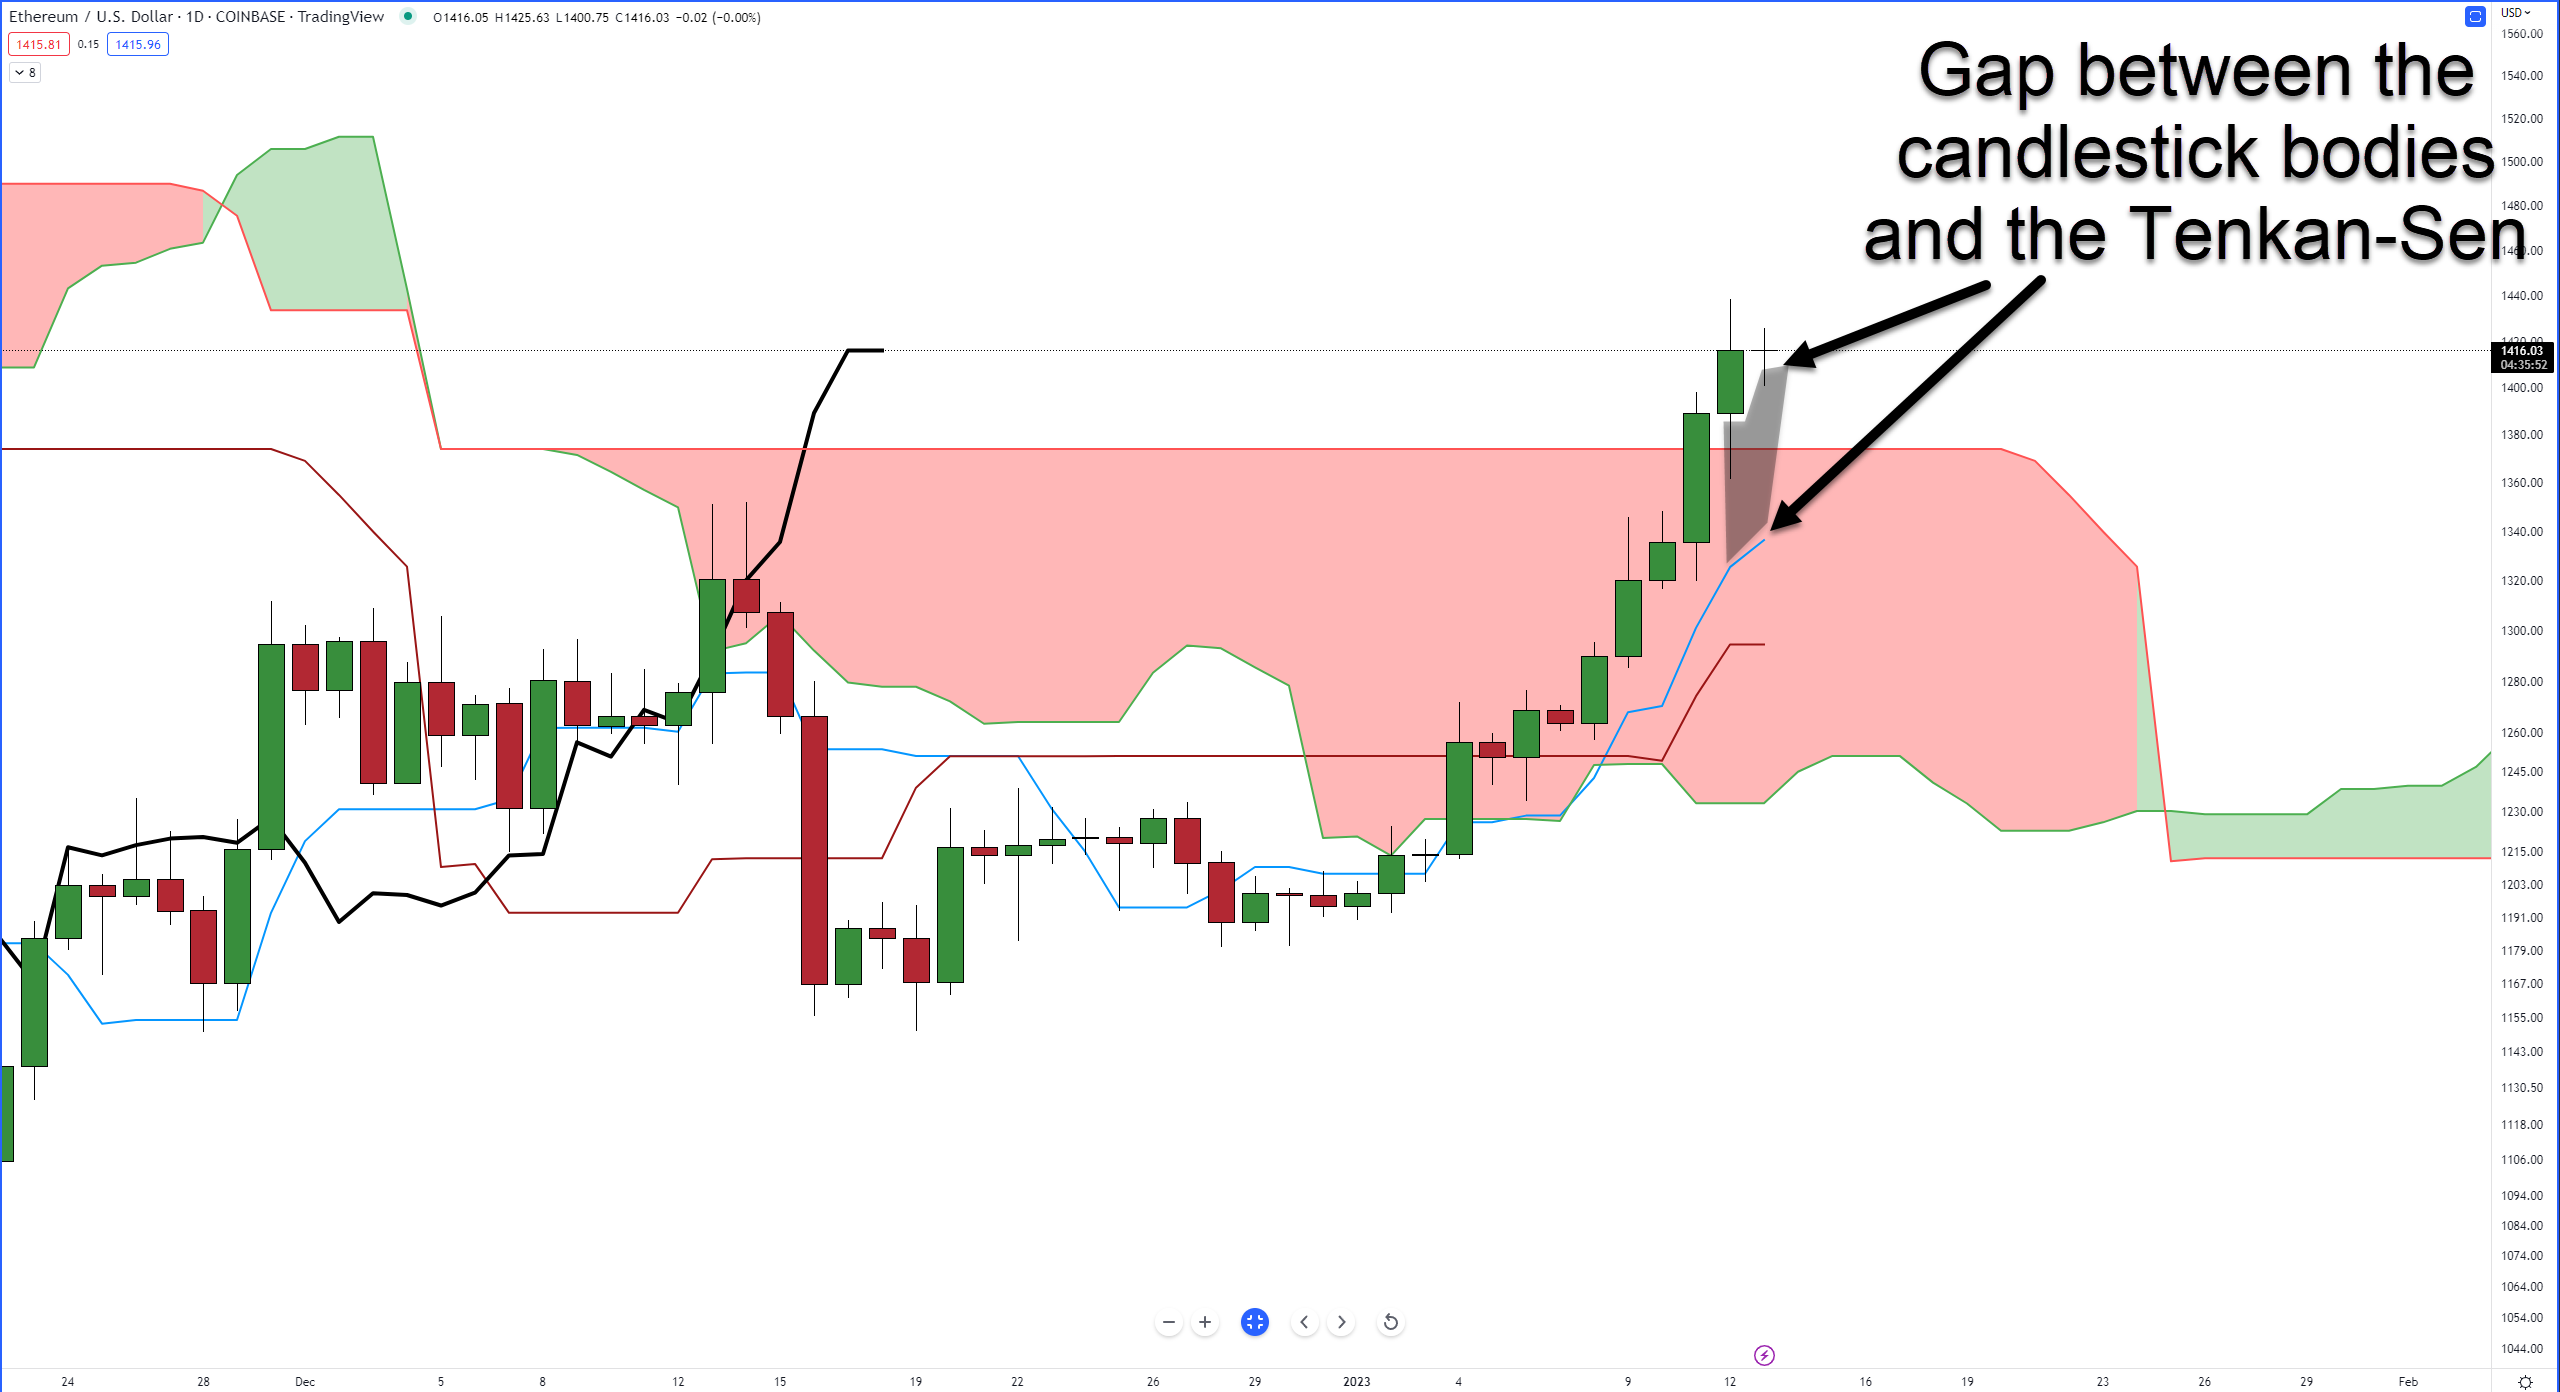
However, there are currently some sizable gaps between the Tenkan-Sen and the candlestick bodies, so a return to test Senkou Span B as support becomes increasingly likely.