There are several important conditions for $BTC.X within the Ichimoku Kinko Hyo system that Bitcoin has present. 📢
First, let’s look at where Bitcoin started in January.
Also, if you want to skip all fancy schmancy Technical Analysis, scroll down to the Putting It All Together summary.
In the January 4, 2023, Litepaper, we looked at a rare condition on Bitcoin’s monthly chart I call Patel’s Two Clouds Theory. I wrote:
In Manesh Patel’s book, Trading with Ichimoku Cloud: The Essential Guide to Ichimoku Kinko Hyo Technical Analysis, Patel calls attention to an Ichimoku phenomenon that no other modern Ichimoku analyst has called attention to in book form. This is what he observed:
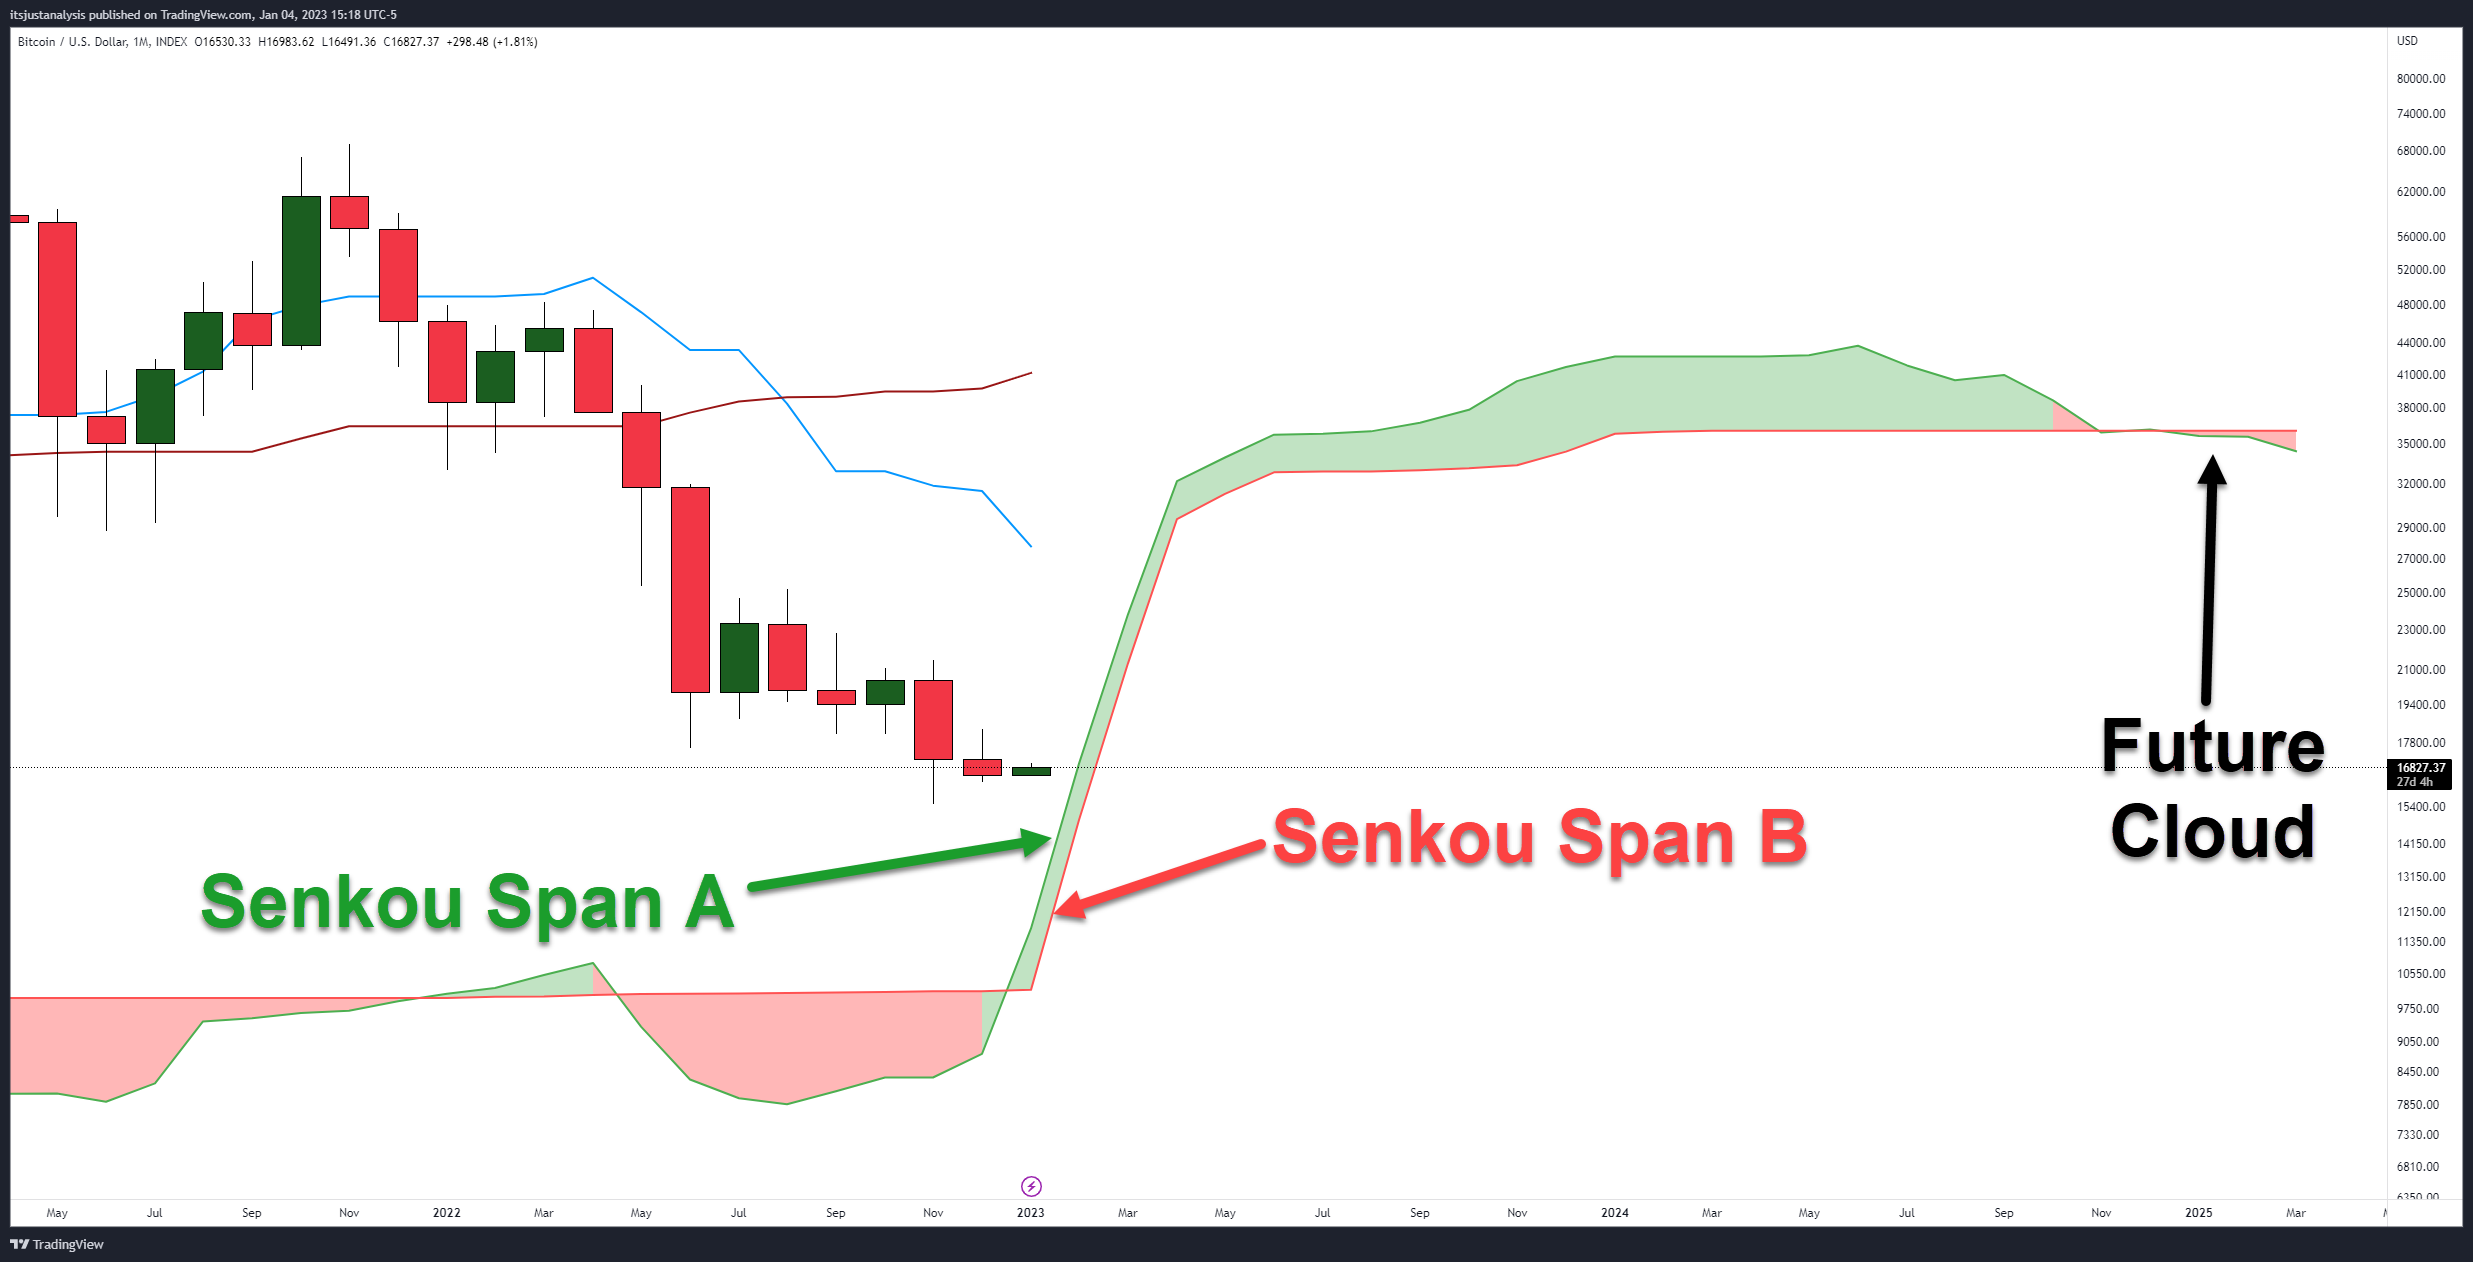
When a major trend change occurs, the Future Cloud is thin, with both the current Senkou Span A and Senou Span B pointing in the direction of the Cloud.
It’s a rare condition that is currently present on Bitcoin’s monthly chart:
The image below from January 4, 2023, shows where Bitcoin was trading and that the monthly chart was positioned for Patel’s Two Clouds Theory.
Fast forward to the end of January 2023, and this is what Bitcoin’s monthly chart looks like now:

There are several important price levels that Bitcoin will need to respect to maintain a bullish outlook. 👁️🗨️
The Cloud
Primary support is at the Cloud itself. Senkou Span A ($16,973) and Senkou Span B ($14,937) represent both the near-term monthly support (Senkou Span A) and strongest level of support (Senkou Span B).
Failure to close February above Senkou Span B ($14,937) could trigger a resumption of the bear market.
Word of warning for the bulls: thin Clouds represent weakness. It is very easy for price to move through a thin Cloud.
The Chikou Span
Out of all the conditions on the monthly chart for Bitcoin, the Chikou Span’s position is probably the most important for February. 📣
For bulls, one of the most sought-after conditions is for the Chikou Span to remain above the bodies of the candlesticks and in open space (a condition where it wouldn’t intercept any candles horizontally over the next five to ten periods).
When the Chikou Span drops below or ‘inside’ the bodies of the candlesticks and price is above the Cloud, it is a warning sign that consolidation or a test lower may happen soon.
If bulls want to see Bitcoin continue moving higher without a lot of headaches, they’ll need to push for a February close that puts the Chikou Span above $28,980.
The Tenkan-Sen
Near-term resistance for Bitcoin on the monthly chart in January was $27,753 – but now it has slid lower to $23,713, almost right on top of where February opened.
The massive gap between the candlesticks’ bodies and the Tenkan-Sen is now resolved. In other words, in the short term, Bitcoin has returned to equilibrium.
If bulls close Bitcoin above the Tenkan-Sen, it will be the first monthly close above that level in over 15 months – since November 2021.
Kumo Twist
Not much to write about here, but important to keep an eye on. Depending on how Bitcoin trends over the next 22 months, November 2024 may be an important inflection point. ⏱️
Composite Index And RSI

Regular bearish divergence is present between the candlestick chart and the Composite Index. It’s a warning that the current upswing could be overdone.
However, the RSI – which remains in bull market conditions – remains between the 50 and 40 oversold levels. Bitcoin’s monthly RSI made a new all-time low on December 2022.
Putting It All Together
To prevent further losses, Bitcoin must pull off some consistent bullish pressure throughout the year.
If Bitcoin closes below the Cloud, that will put the Chikou Span below the bodies of the candlesticks, putting Bitcoin into a condition where it would experience a very high probability of testing the $10,100 value area. 😶