I’ll keep this one short and sweet.
In Monday’s Litepaper, we looked at what analysts see as major bullish and bearish warning signs on the Total Crypto Market Cap chart.
This is an update to Monday’s Technically Speaking article.
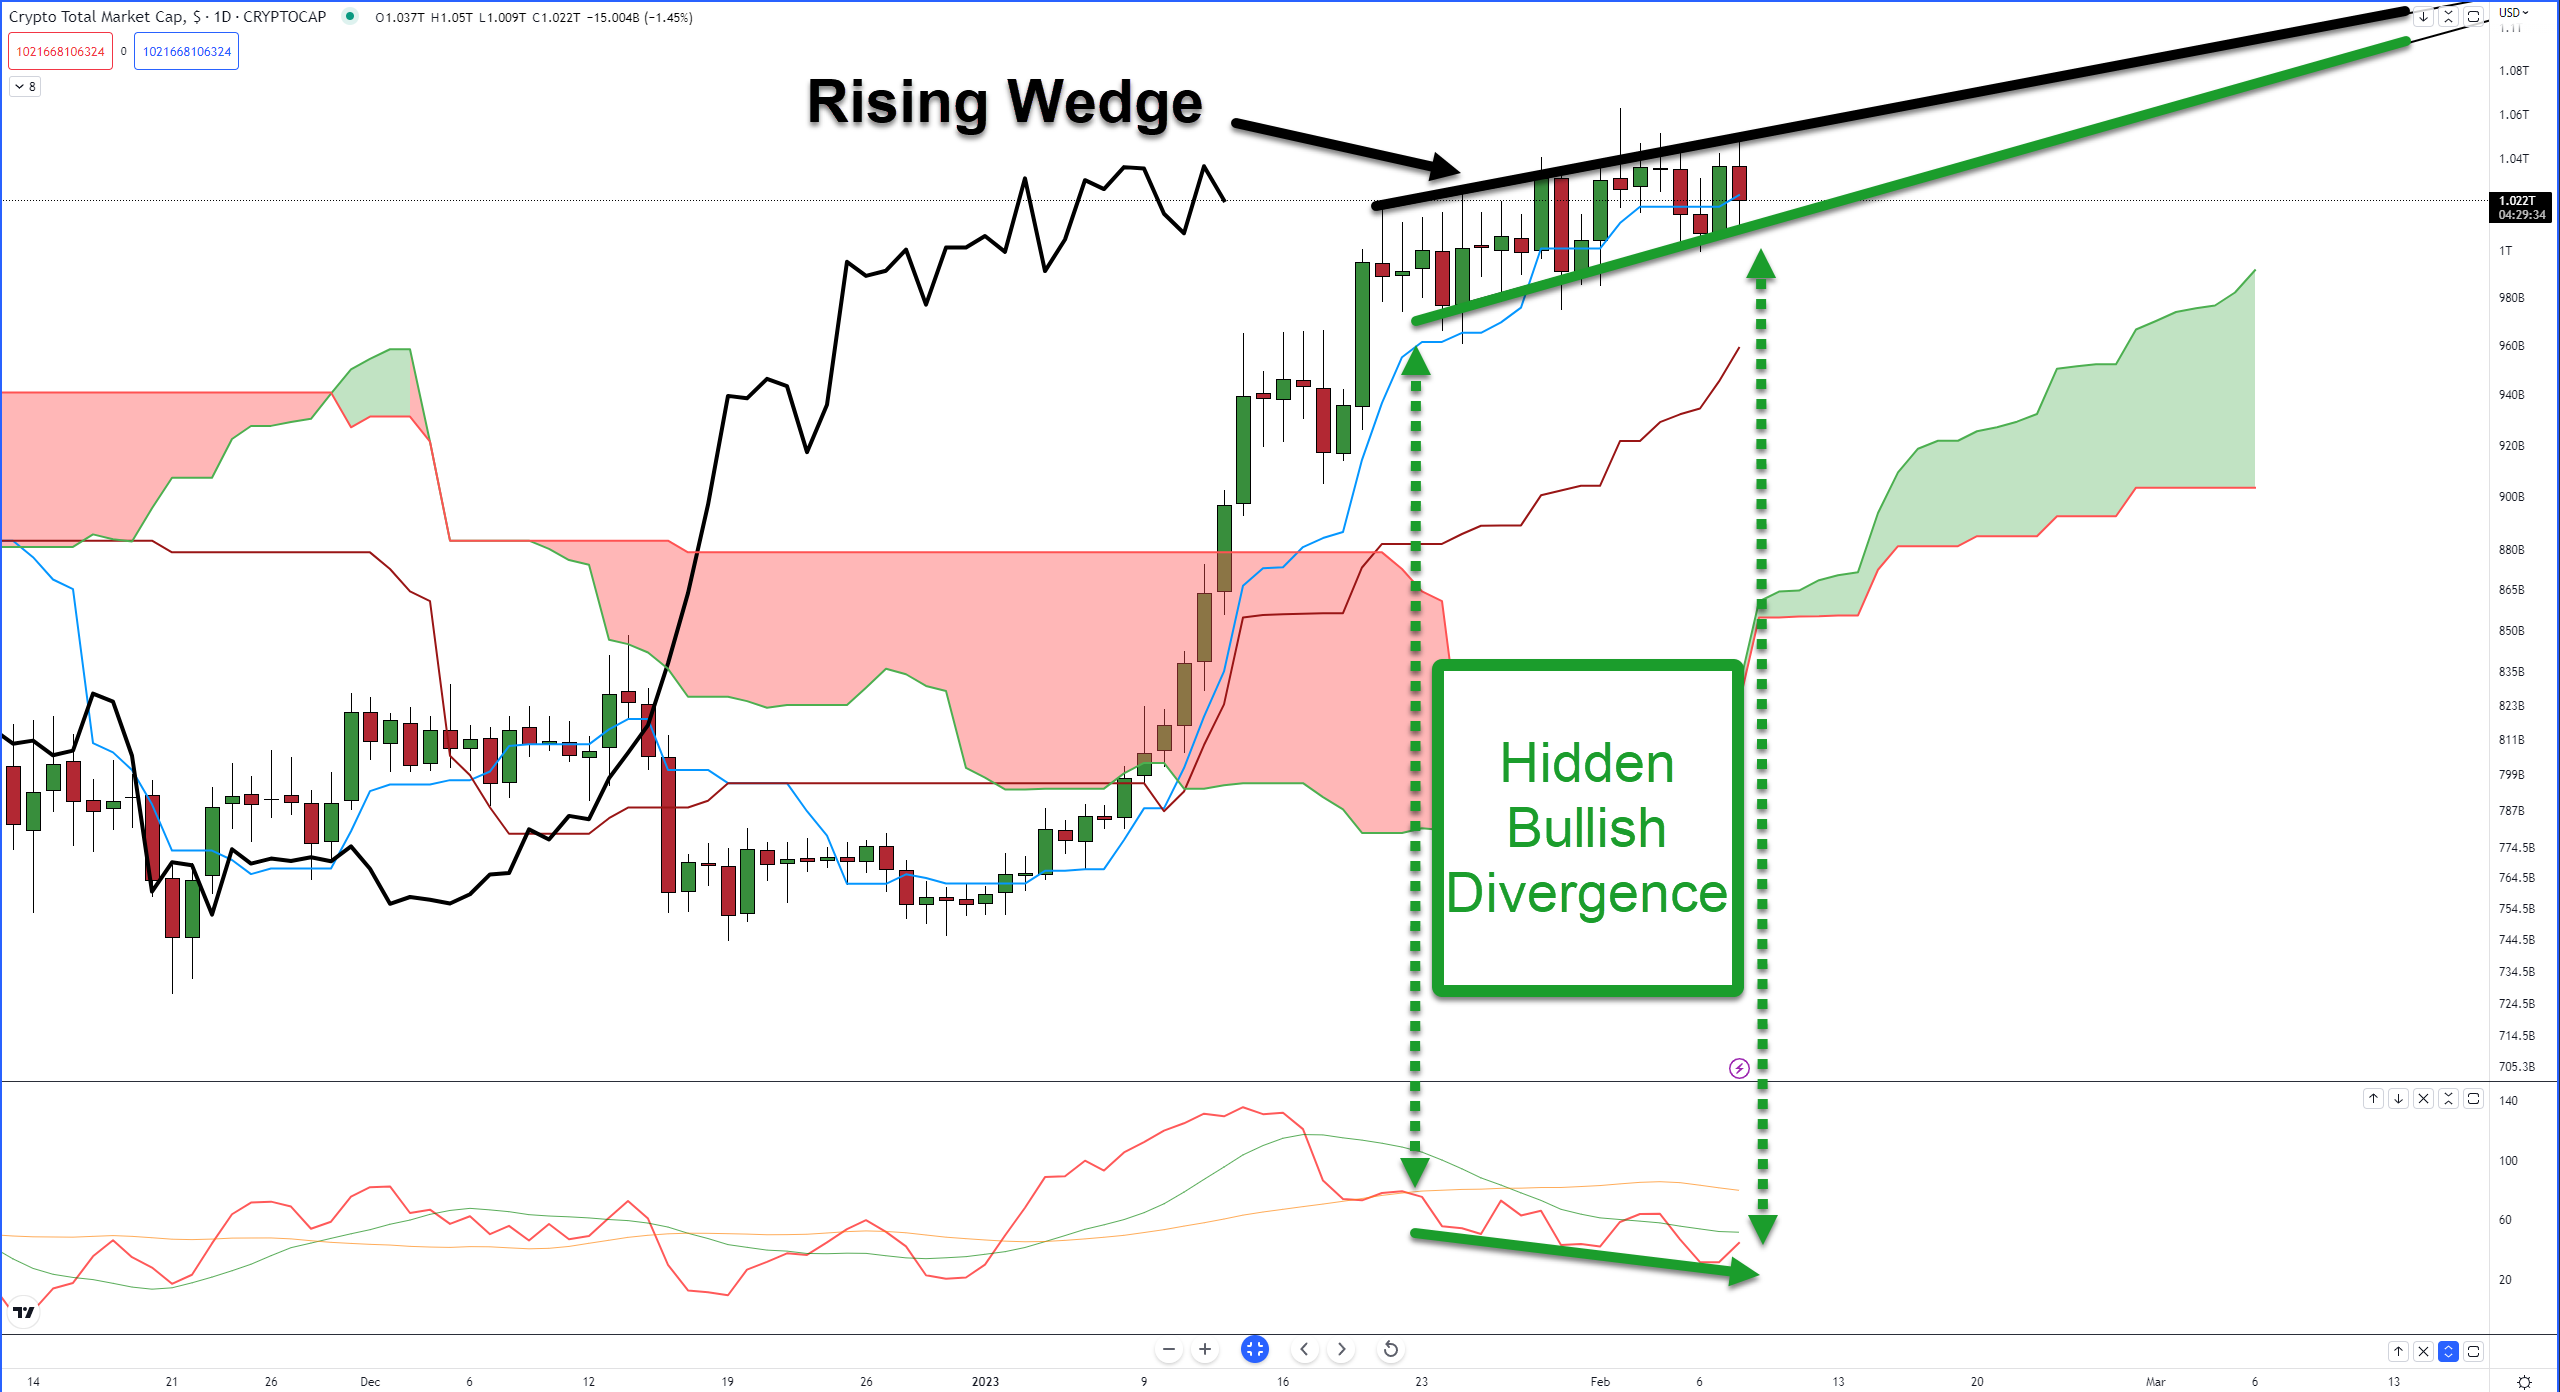
Analysts continue to see rejection against the upper trendline of the Rising Wedge and a struggle to stay above the Tenkan-Sen (blue moving average). That’s something the bears are ready to pounce on if bulls fail at moving higher.
That is especially true given the high percentage of time that price drops below a rising wedge pattern, but as we looked at on Monday with Bulkowski’s research, the moves are often underwhelming.
From a bullish perspective, there’s hidden bullish divergence between the Composite Index and the candlestick chart.
Monday’s analysis looked at the hidden bullish divergence with the RSI, but the Composite Index shows something slightly more interesting for bulls.
A quick recap of the Composite Index: Created by Connie Brown, it’s essentially the RSI with a momentum calculation and two moving averages. It’s able to catch divergences that the RSI is unable to. The red line is the Composite Index line; the slow average is yellow, and the green average is the fast average.
Hidden bullish divergence is only valid if the last move was up – which it was. But the condition analysts are watching for is something Connie Brown points out in her books regarding the Composite Index:
Divergences that occur not at extremes and/or when the Composite Index crosses one of its averages are often the most powerful signals that a major move could be coming.
Suppose the Total Crypto Market Cap chart pushes above the upper trendline around $1.05 Trillion (black), and the Composite Index crosses above the green average. In that case, analysts expect some fireworks to begin.