This Technically Speaking article is long as we review some of the various charts we’ve looked at over the past four to six weeks.
Included in today’s Technically Speaking are: Chainlink, Uniswap, Monero, and Ethereum.
New to the Ichimoku Kinko Hyo system? You can read our 101 on it here.
Chainlink
Let’s take a peek at $LINK first. The image below is from the October 27 Technically Speaking article, which highlighted a strong resistance cluster made up of two Fibonacci levels and the Chikou Spans resistance level.

Over the last few weeks, Chainlink has made some major moves but got halted right up against that resistance zone in the $15.50 – $17.30 value area.
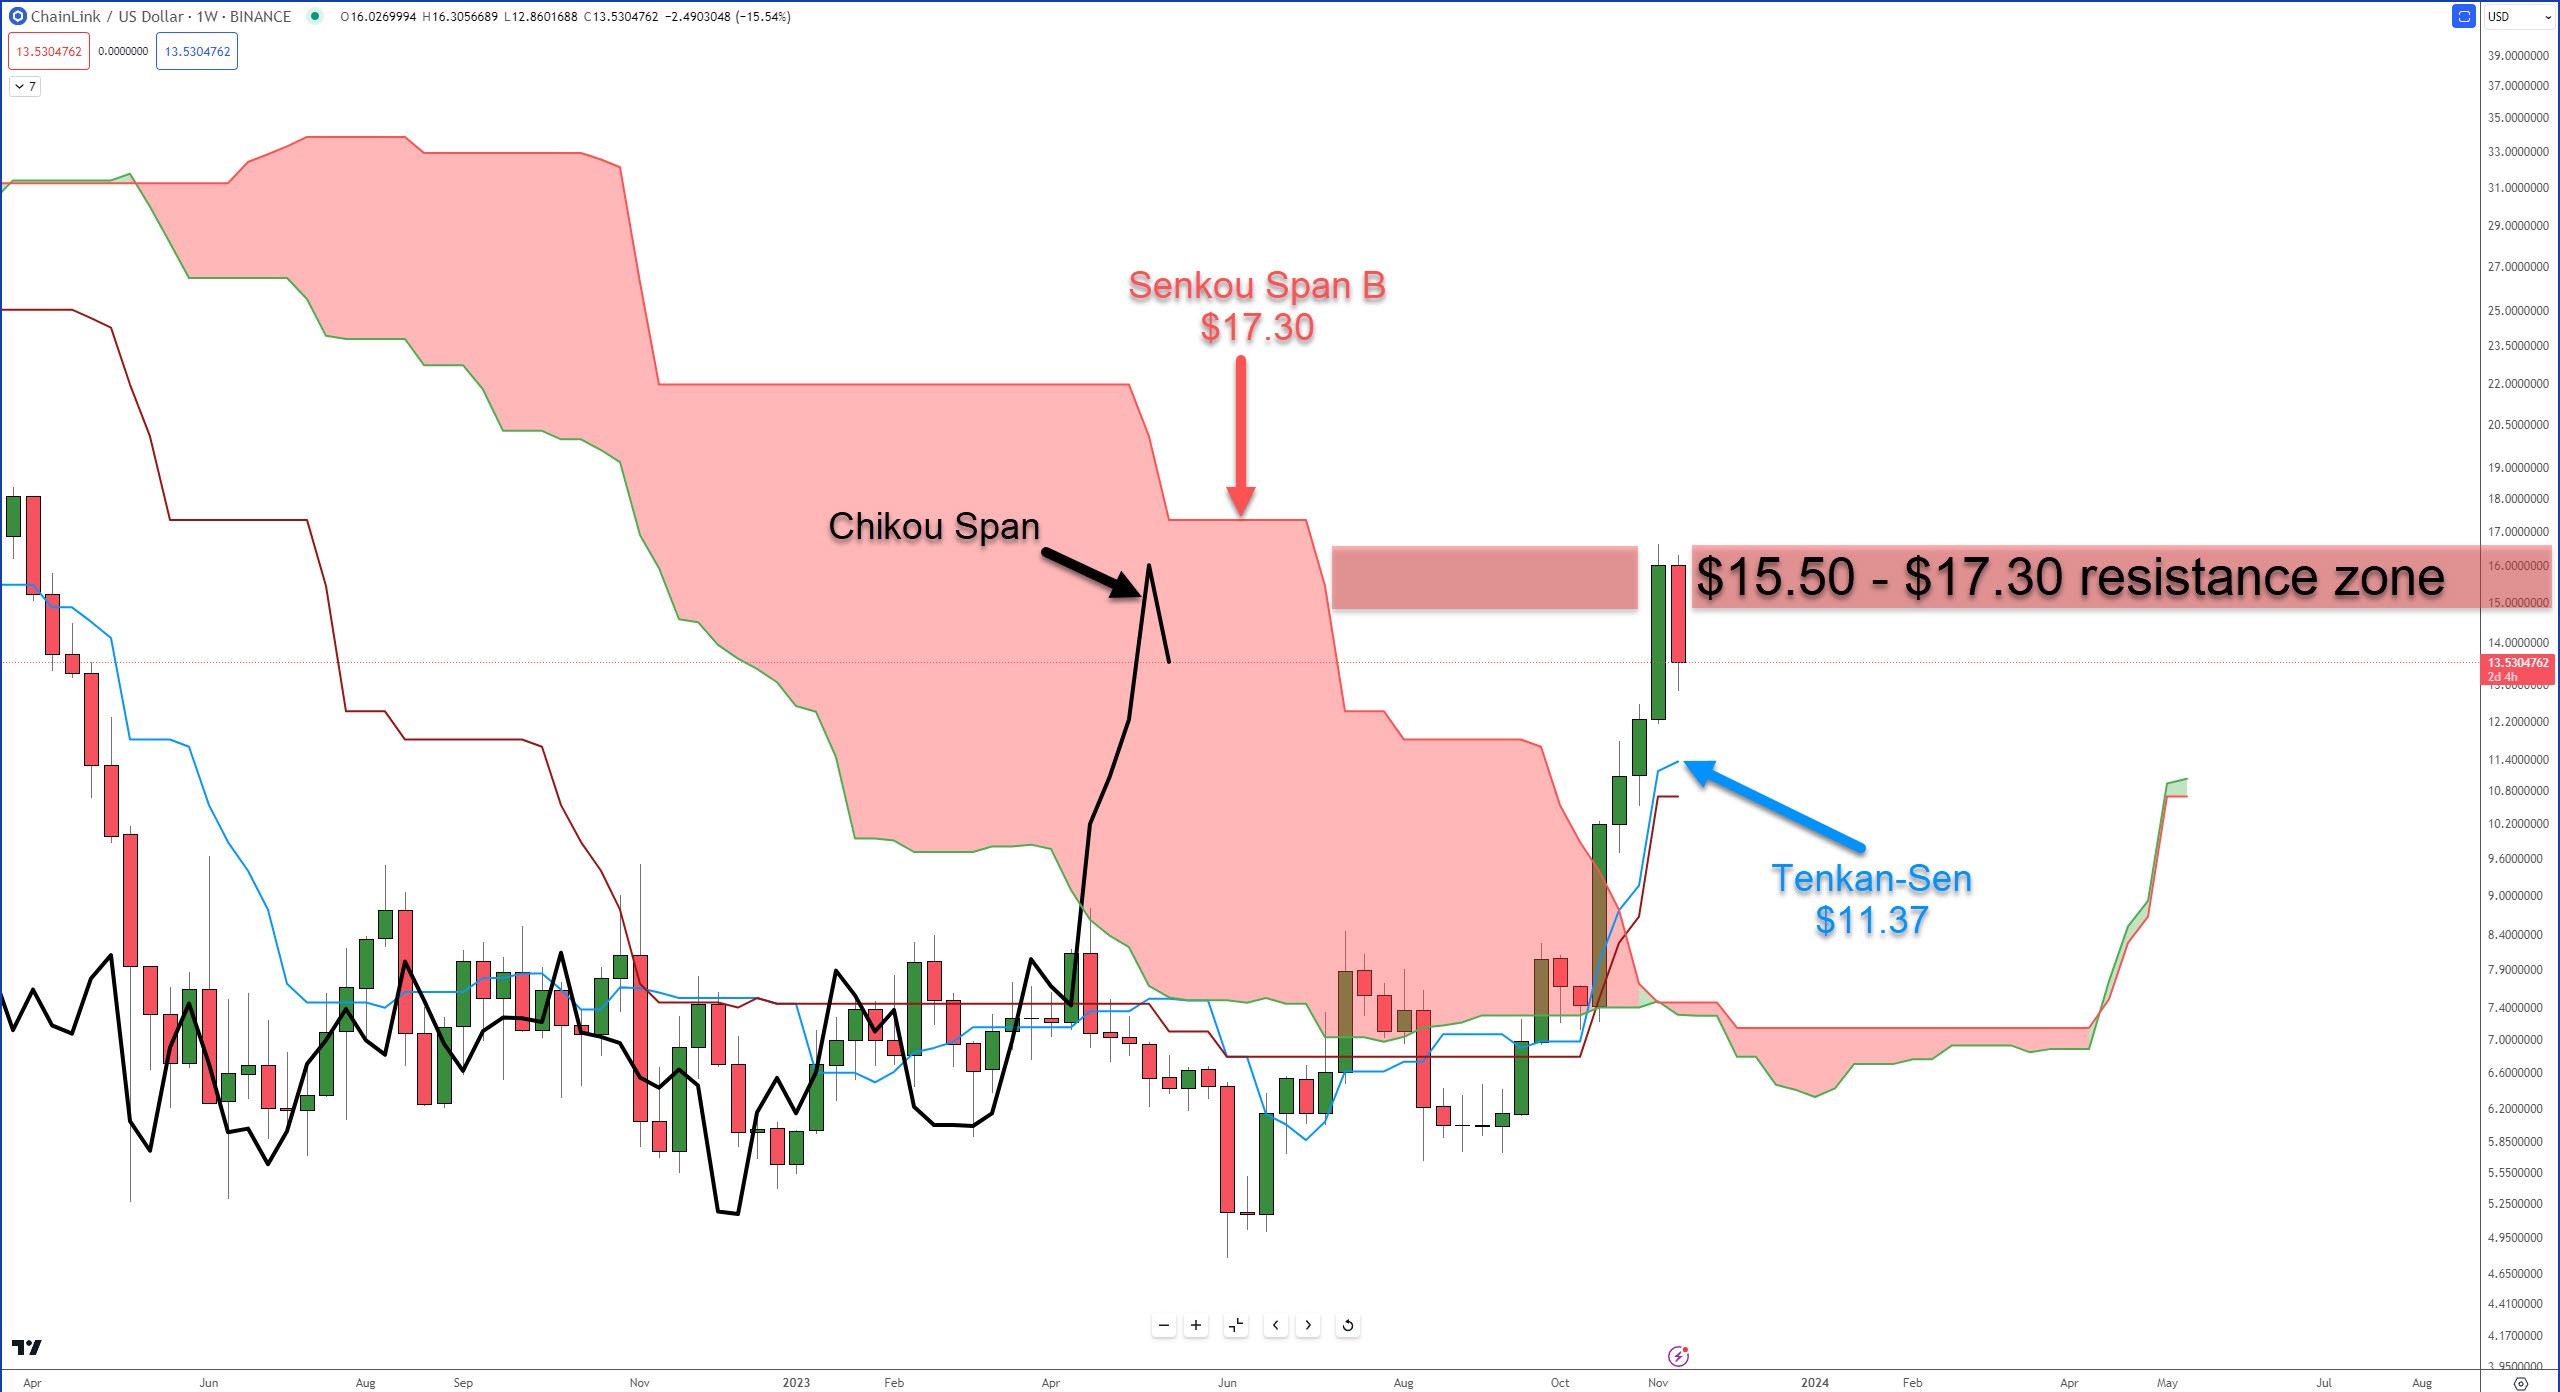
A big gap now exists between the bodies of the weekly candlesticks and the Tenkan-Sen, indicating LINK is out of equilibrium. From an Ichimoku perspective, a return to equilibrium is increasingly likely.
Near-term support: The weekly Tenkan-Sen at $11.37.
Near-term resistance: Top of the Cloud (Senkou Span B), where the Chikou Span would hit at $17.30.
Uniswap
We last looked at $UNI‘s weekly chart in the November 3 Technically Speaking article. Below is that chart:

Uniswap was able to close above the Tenkan-Sen, and last week, it closed above the Kijun-Sen for the first time since late July 2023.
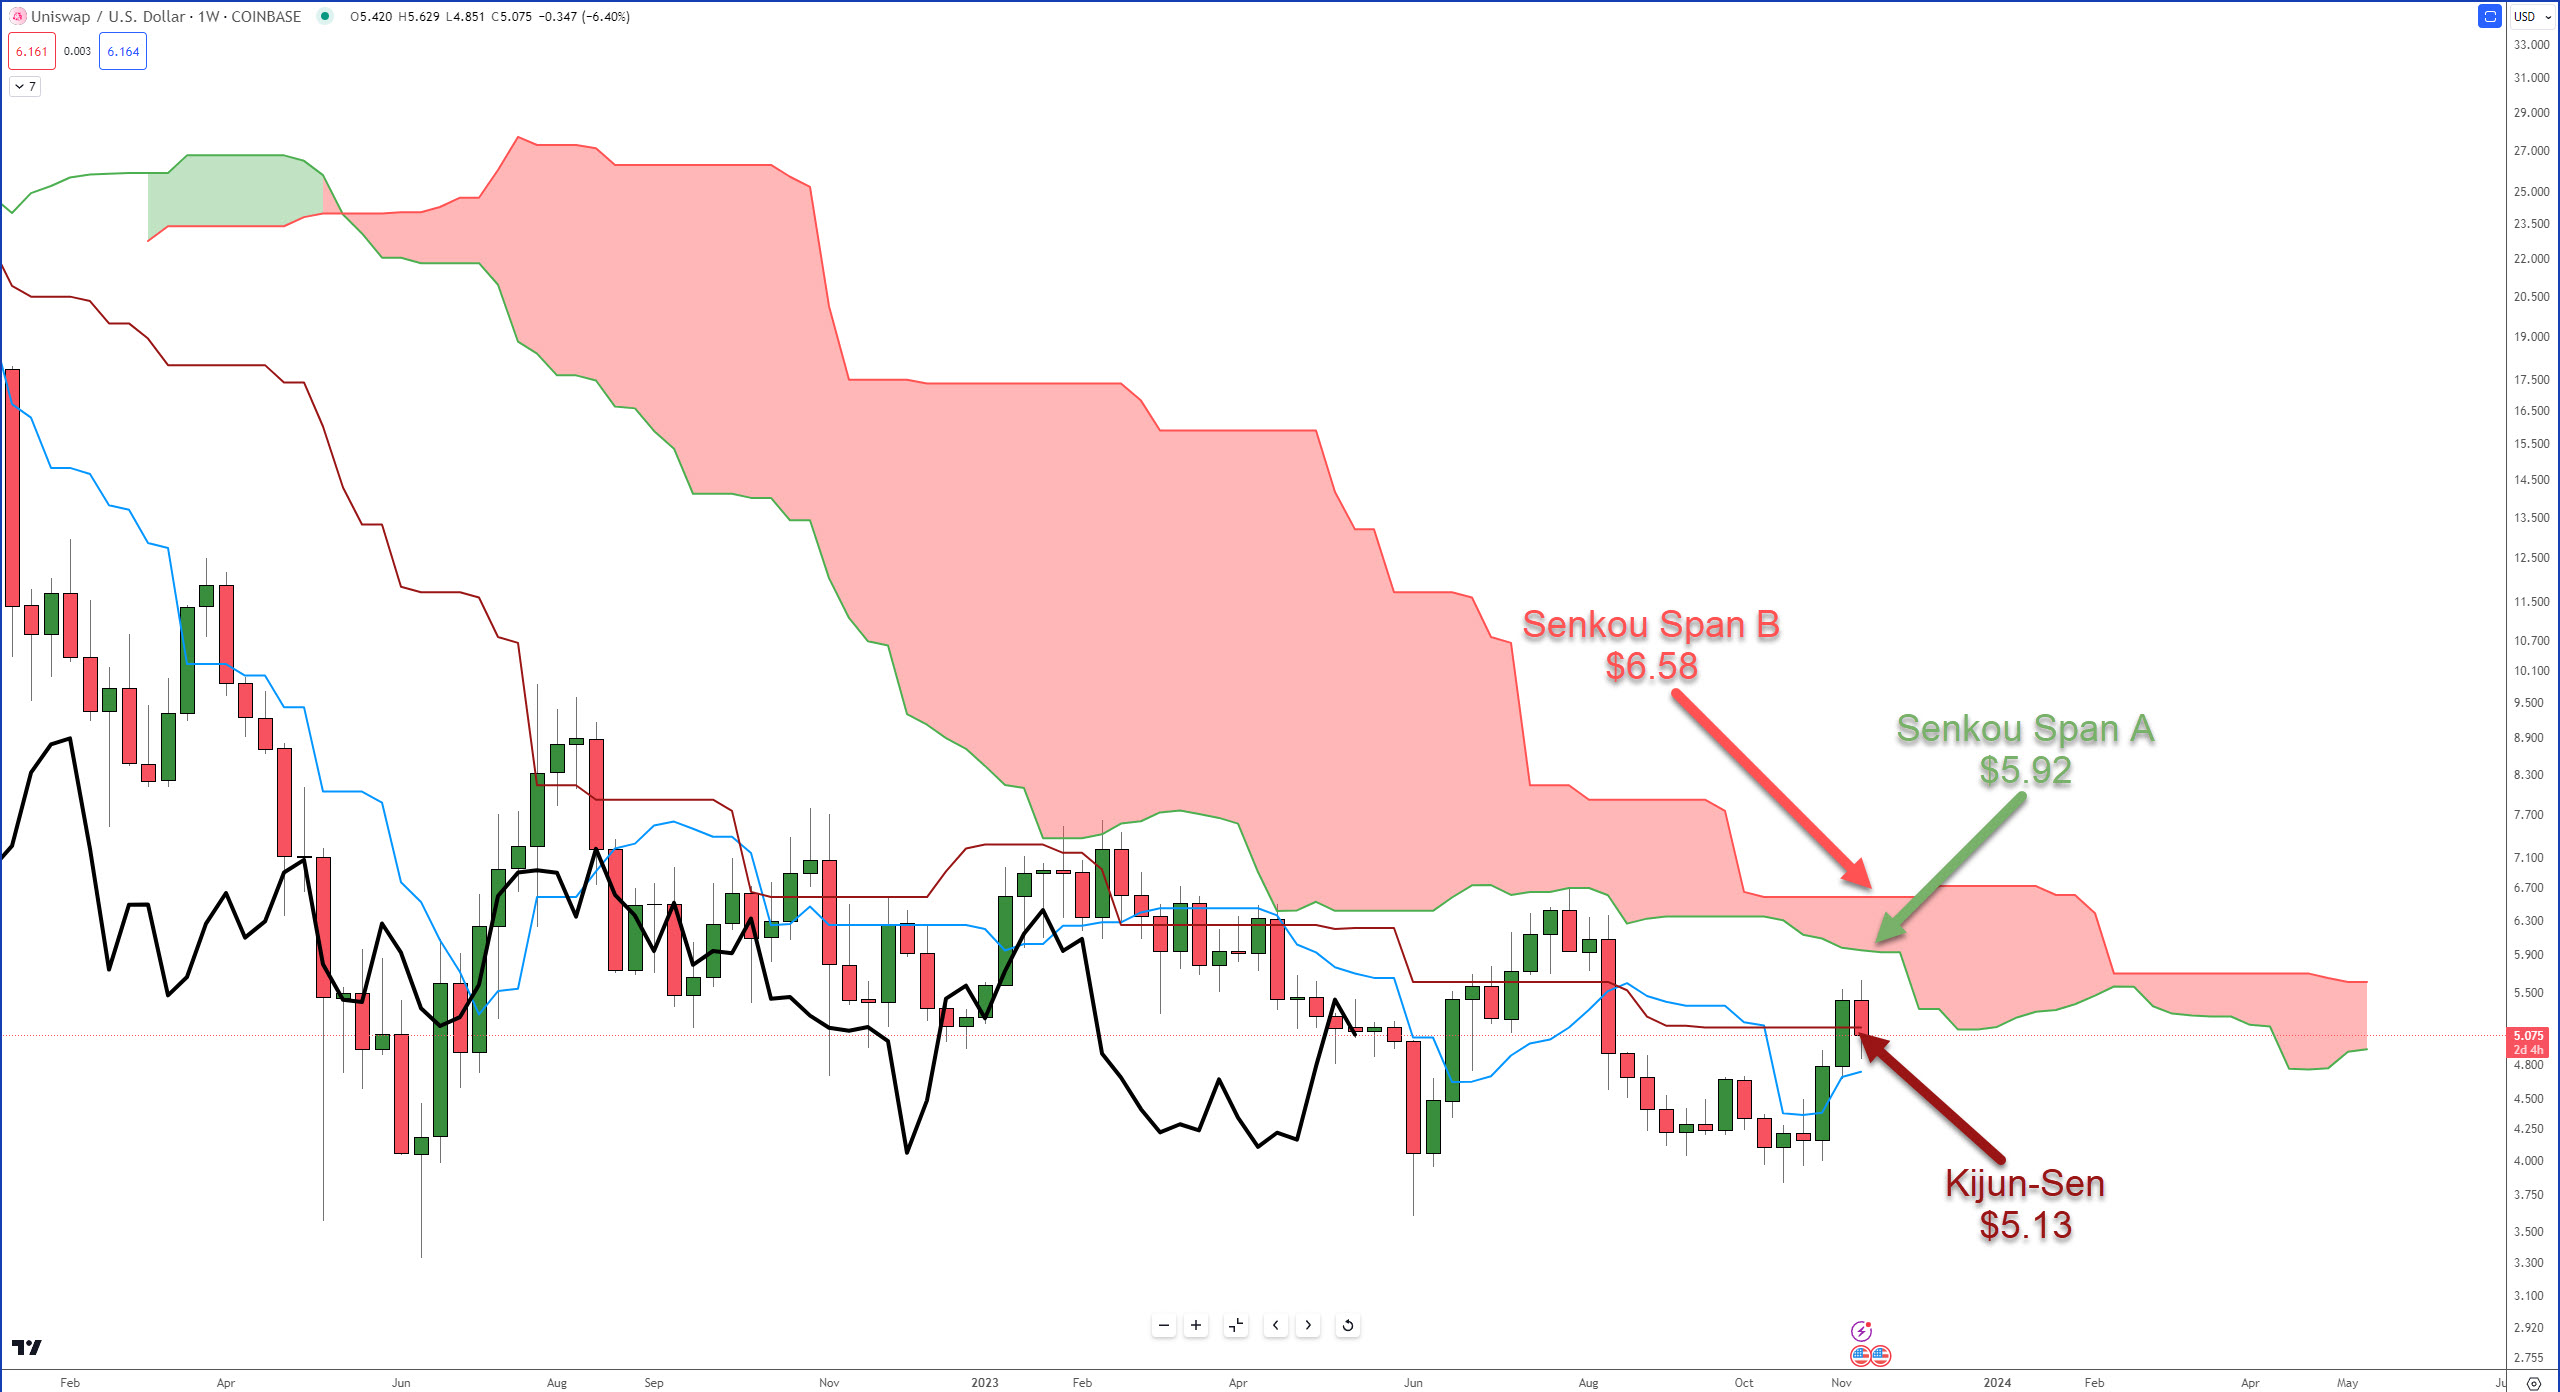
Since then, UNI’s pulled back this week and is struggling to hold onto the prior resistance-turned-support at $5.13. Price action could be fairly choppy given the Cloud is just above and the Tenkan-Sen and Kijun-Sen just below.
Near-term support: Kijun-Sen at $5.13.
Near-term resistance: Senkous Span A at $5.92 and Senkou Span B at $6.58.
Monero
The October 20 Technically Speaking looked at $XMR‘s weekly chart and how close it was to a breakout above the Cloud, something that hasn’t happened in over two years.

It’s been almost a month and Monero did close above the Cloud on its weekly chart – but not without some strong attempts by bears to push XMR down.
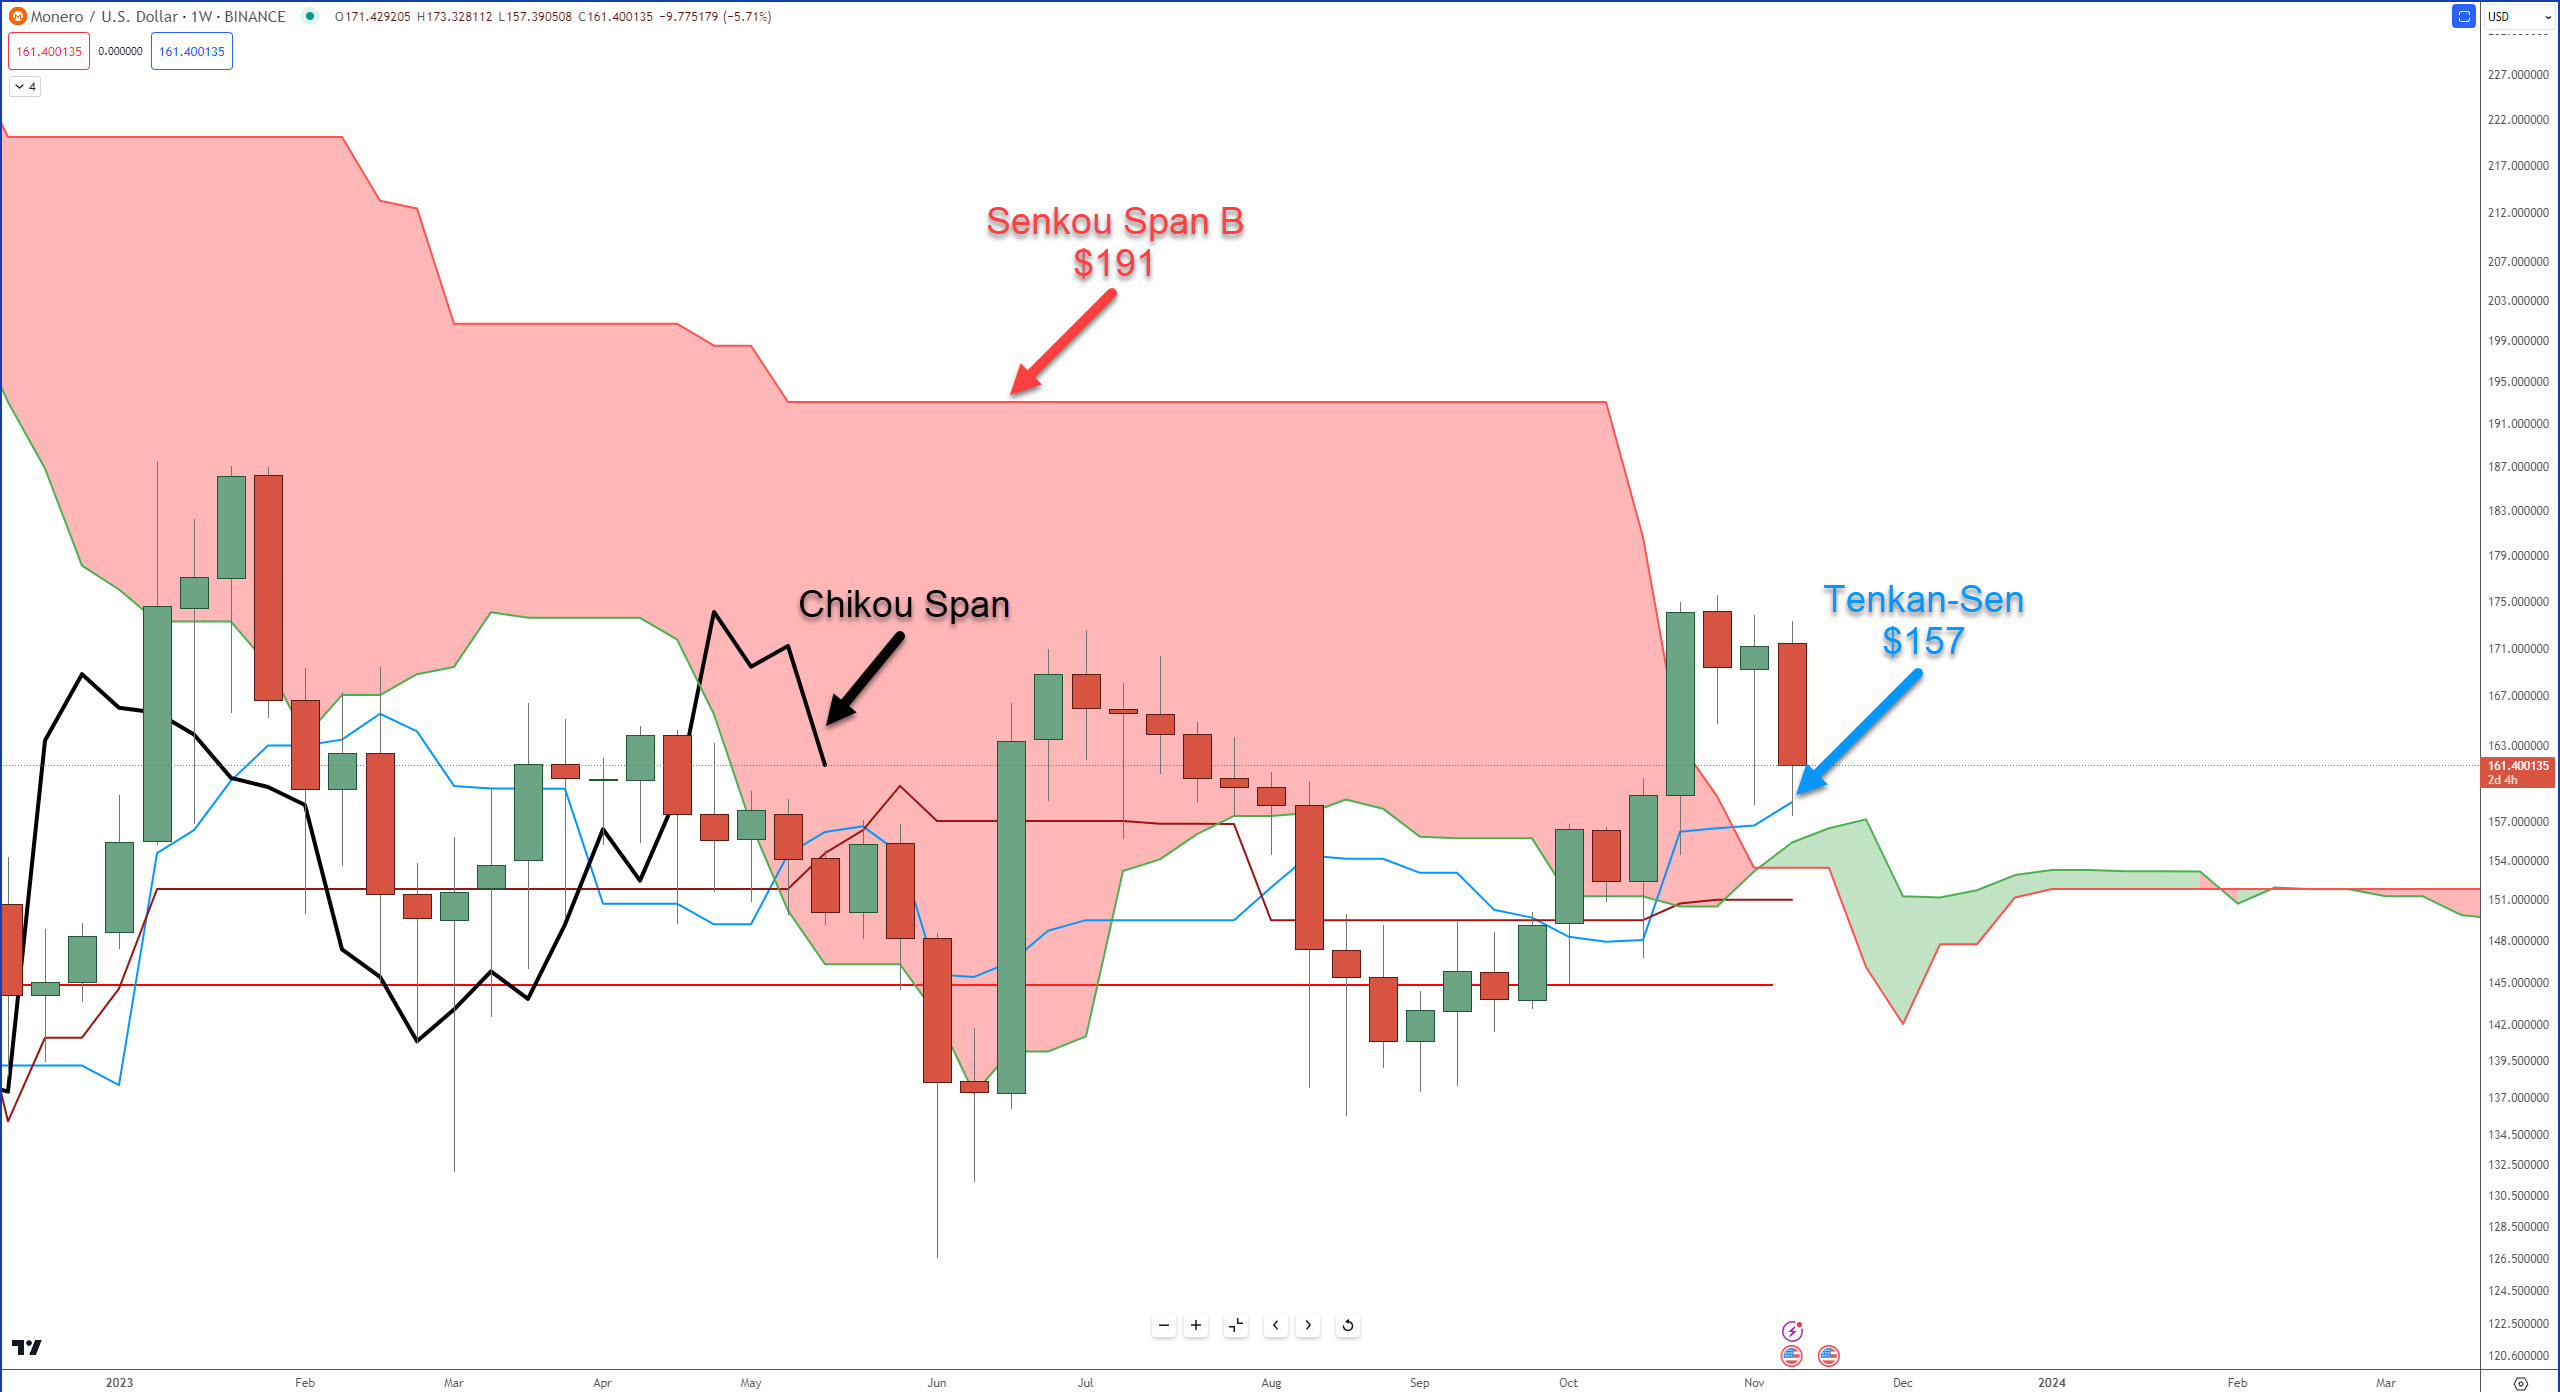
Since closing above the Cloud in the week of October 23, prices have dropped, and the Tenkan-Sen has been tested as support for the past two weeks.
The only major resistance level remaining for Monero is the top of the Cloud (Senkou Span B), where the Chikou Span would hit at $191.
For support, there’s a boatload of it. Between $145 and $157, the VPOC and all of the Ichimoku levels sit – that’s some heavy support structure.
Near-term support: Tenkan-Sen at $157.
Near-term resistance: Senkou Span B at $191.
Ethereum
$ETH fulfilled all the requirements for an Ideal Bullish Ichimoku Breakout two weeks ago but is finding some difficulty this week moving higher.
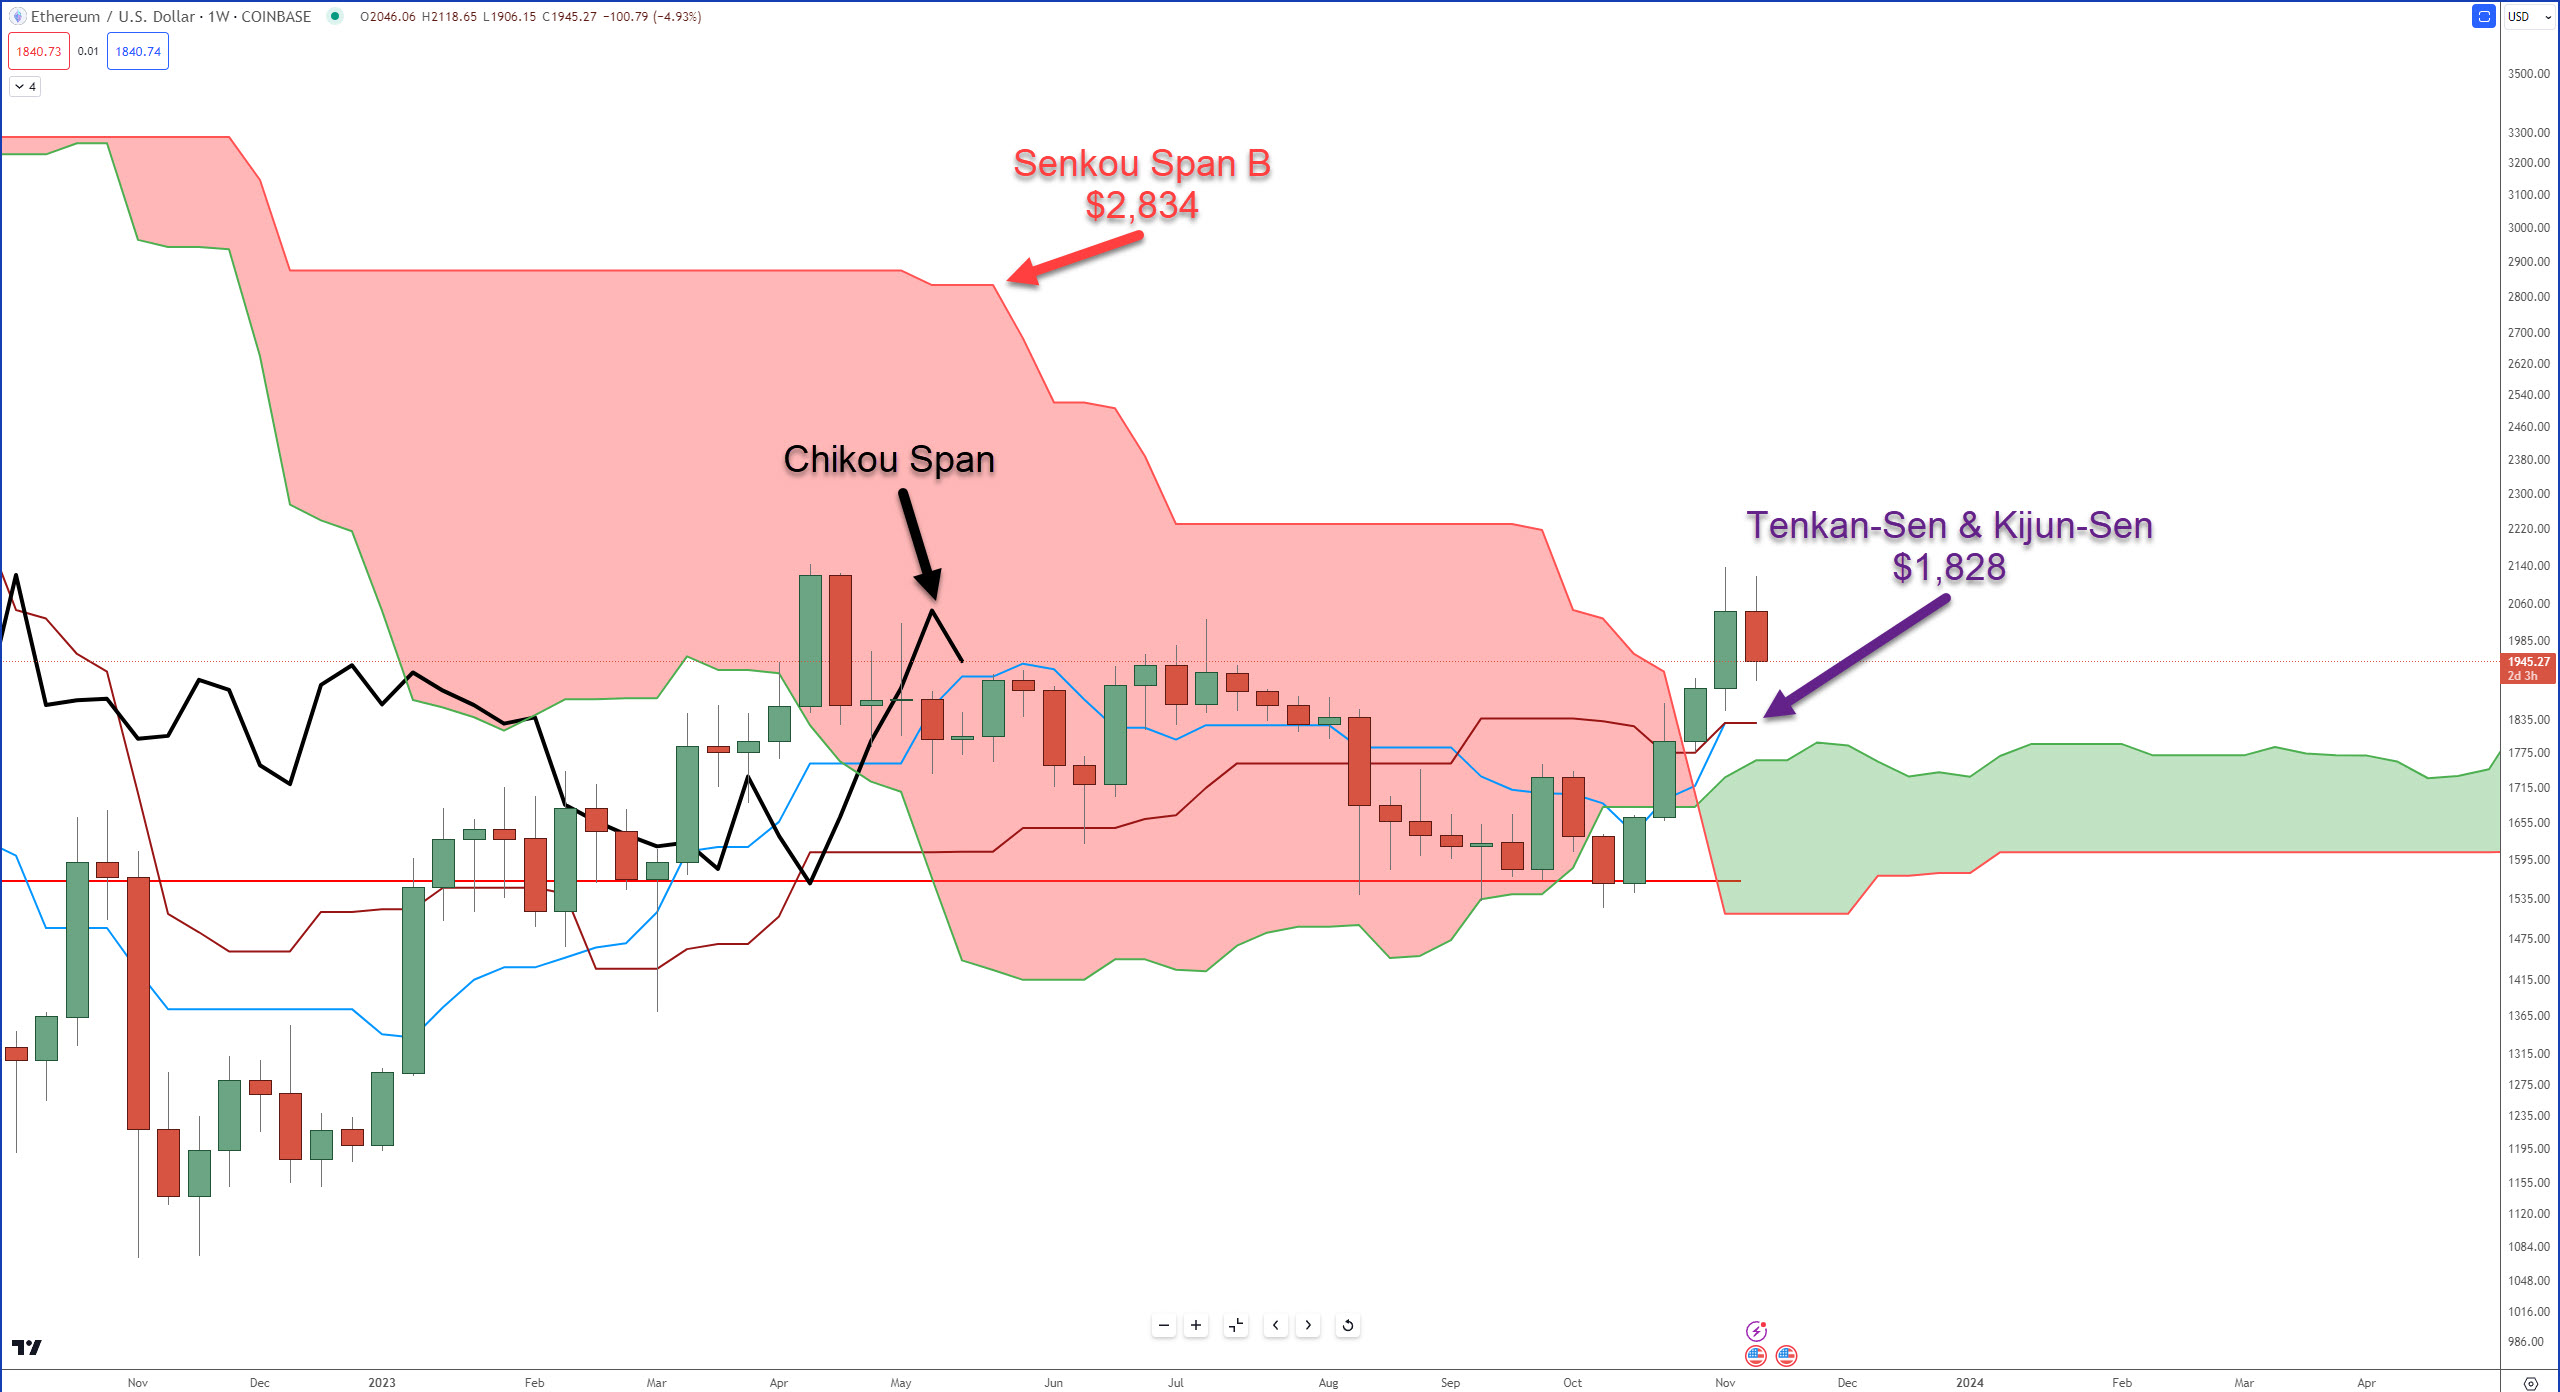
From an Ichimoku perspective, the position of the Chikou Span is one reason for the choppy price action this week. Why? Because the Chikou Span responds to the same behavior as price.
It’s (Chikou Span) is stuck inside the Cloud, so the irritating ups and downs and whipsaw all around are expected. Only when the Chikou Span leaves the Cloud will there be some semblance of ‘normal’ movement.
But that’s a tall order for the rest of this week and next. In order for the Chikou Span to break above the Cloud, it will need to close at or above $2,834.
The lowest the top of the Cloud gets for the rest of 2023 is at $2,235, not until the very last week of December 2023.
Near-term support: Kijun-Sen and Tenkan-Sen at $1,828.
Near-term resistance: Senkou Span B at $2,834.