While expectations were for a 0.1% decline, August’s Consumer Price Index actually rose 0.1% MoM and 8.3% YoY. The surprise sent markets into a tailspin, but before we get into that, let’s break down the report. 📝
On the positive side, energy prices were down roughly 5% in August, adding to July’s 4.6% decline. Driving that was a decline in energy commodities, while energy services like electricity and utility gas services rose in August. Used car and truck prices also fell by 0.1%, but that’s where the good news ends. ☹️
As for the negatives, food inflation dropped MoM marginally but is still up 11.4% YoY. Additionally, new vehicle prices are still up 10.1% YoY and reaccelerated after two months of declines.
The real culprit in this report is services inflation, which accelerated in August. Shelter rose 0.7%, transportation services rose 0.5%, and medical care services rose 0.8% MoM. Although this shouldn’t be that big of a surprise because the labor market remains extremely tight, keeping upward pressure on wages. And to perform services…you need labor. 🧑💼
The increase in these areas drove Core CPI, which excludes food and energy) up 0.6% MoM, back to 6.3% YoY. It’s now back to its highest level since March, breaking its four-month deceleration trend and any hope of a Fed pivot with it.
Today’s selloff hit everything from stocks to bitcoin to gold, with the only safe haven being the U.S. Dollar. Despite the Fed’s tough language, it appears some market participants were still betting on a dovish Fed pivot. Well, any possibility of that is most certainly out the window now.
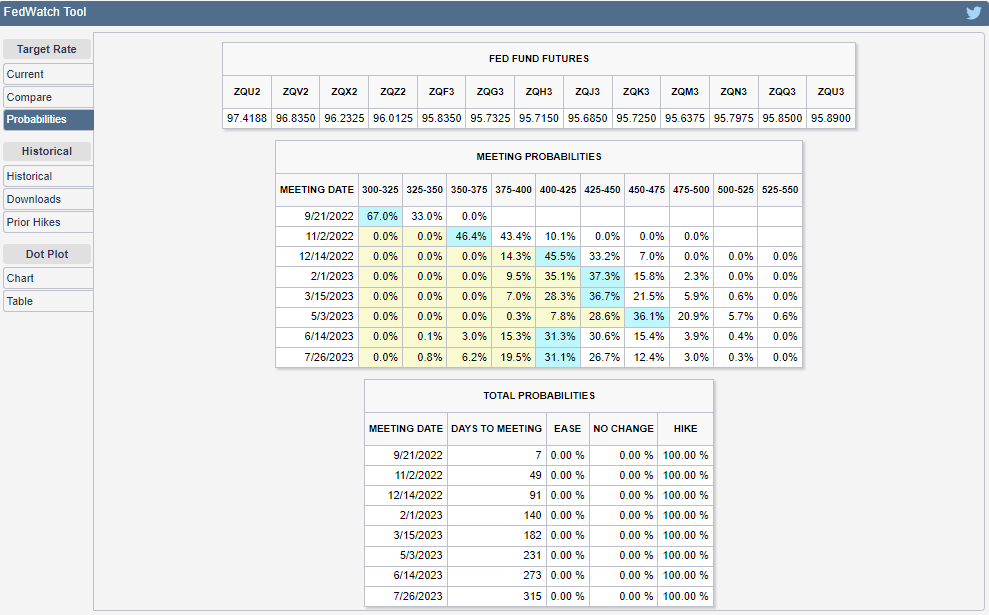
As a matter of fact, the market has fully priced in a 75 bp hike, with a 33% shot at a 100 bp hike at the Fed’s meeting next week. 😮
Below is a snapshot from the CME Group’s FedWatch Tool outlining the market’s current expectations for where rates will be in the future. As we’ve seen, the market’s expectations can get ahead of themselves, but here’s what they’re pricing in anyway. 🤷
With inflation entrenching itself deep within the economy, the Federal Reserve has no choice but to continue hiking. 🔺
How that decision will affect the economy, and the prices of assets, remains to be seen. But if the future is anything like today’s action, we all best buckle up for a bumpy ride into year-end.
For now, we’ll just have to wait and see if tomorrow’s Producer Prices Index confirms the same. 😨