Welcome to the Stocktwits Crypto Data Dive for Week 4 of 2023!
If you want a detailed look at crypto’s performance in 2022, you can read it here.
This data-centric issue aims to keep track of the overall crypto market’s progress and highlight new and old trends. 🤩
The Stocktwits Crypto Data Dive serves three main purposes:
- Tracks the crypto total market cap every week.
- Tracks the 25 best-performing cryptocurrencies of the week.
- Tracks the top 10 cryptocurrencies in each of the three best-performing indices of the week. Our custom indices include “Proof of Work,” “Web 3,” “Smart Contracts,” and more!
So without further adieu, let’s get into the data from week 4:
Total Market Cap
Total Market Cap Update
What is the broader trend within the crypto market? The simplest way to track that is using a total market capitalization chart. So let’s see what we’ve got. 🔭
We’ll keep using the beginning of 2022 as a starting point, even though the chart says it’s YTD – it would look silly to show only 2023.
From the all-time market cap high of $2.834 Trillion, crypto is down -64.04%, versus -68.24% from last week.
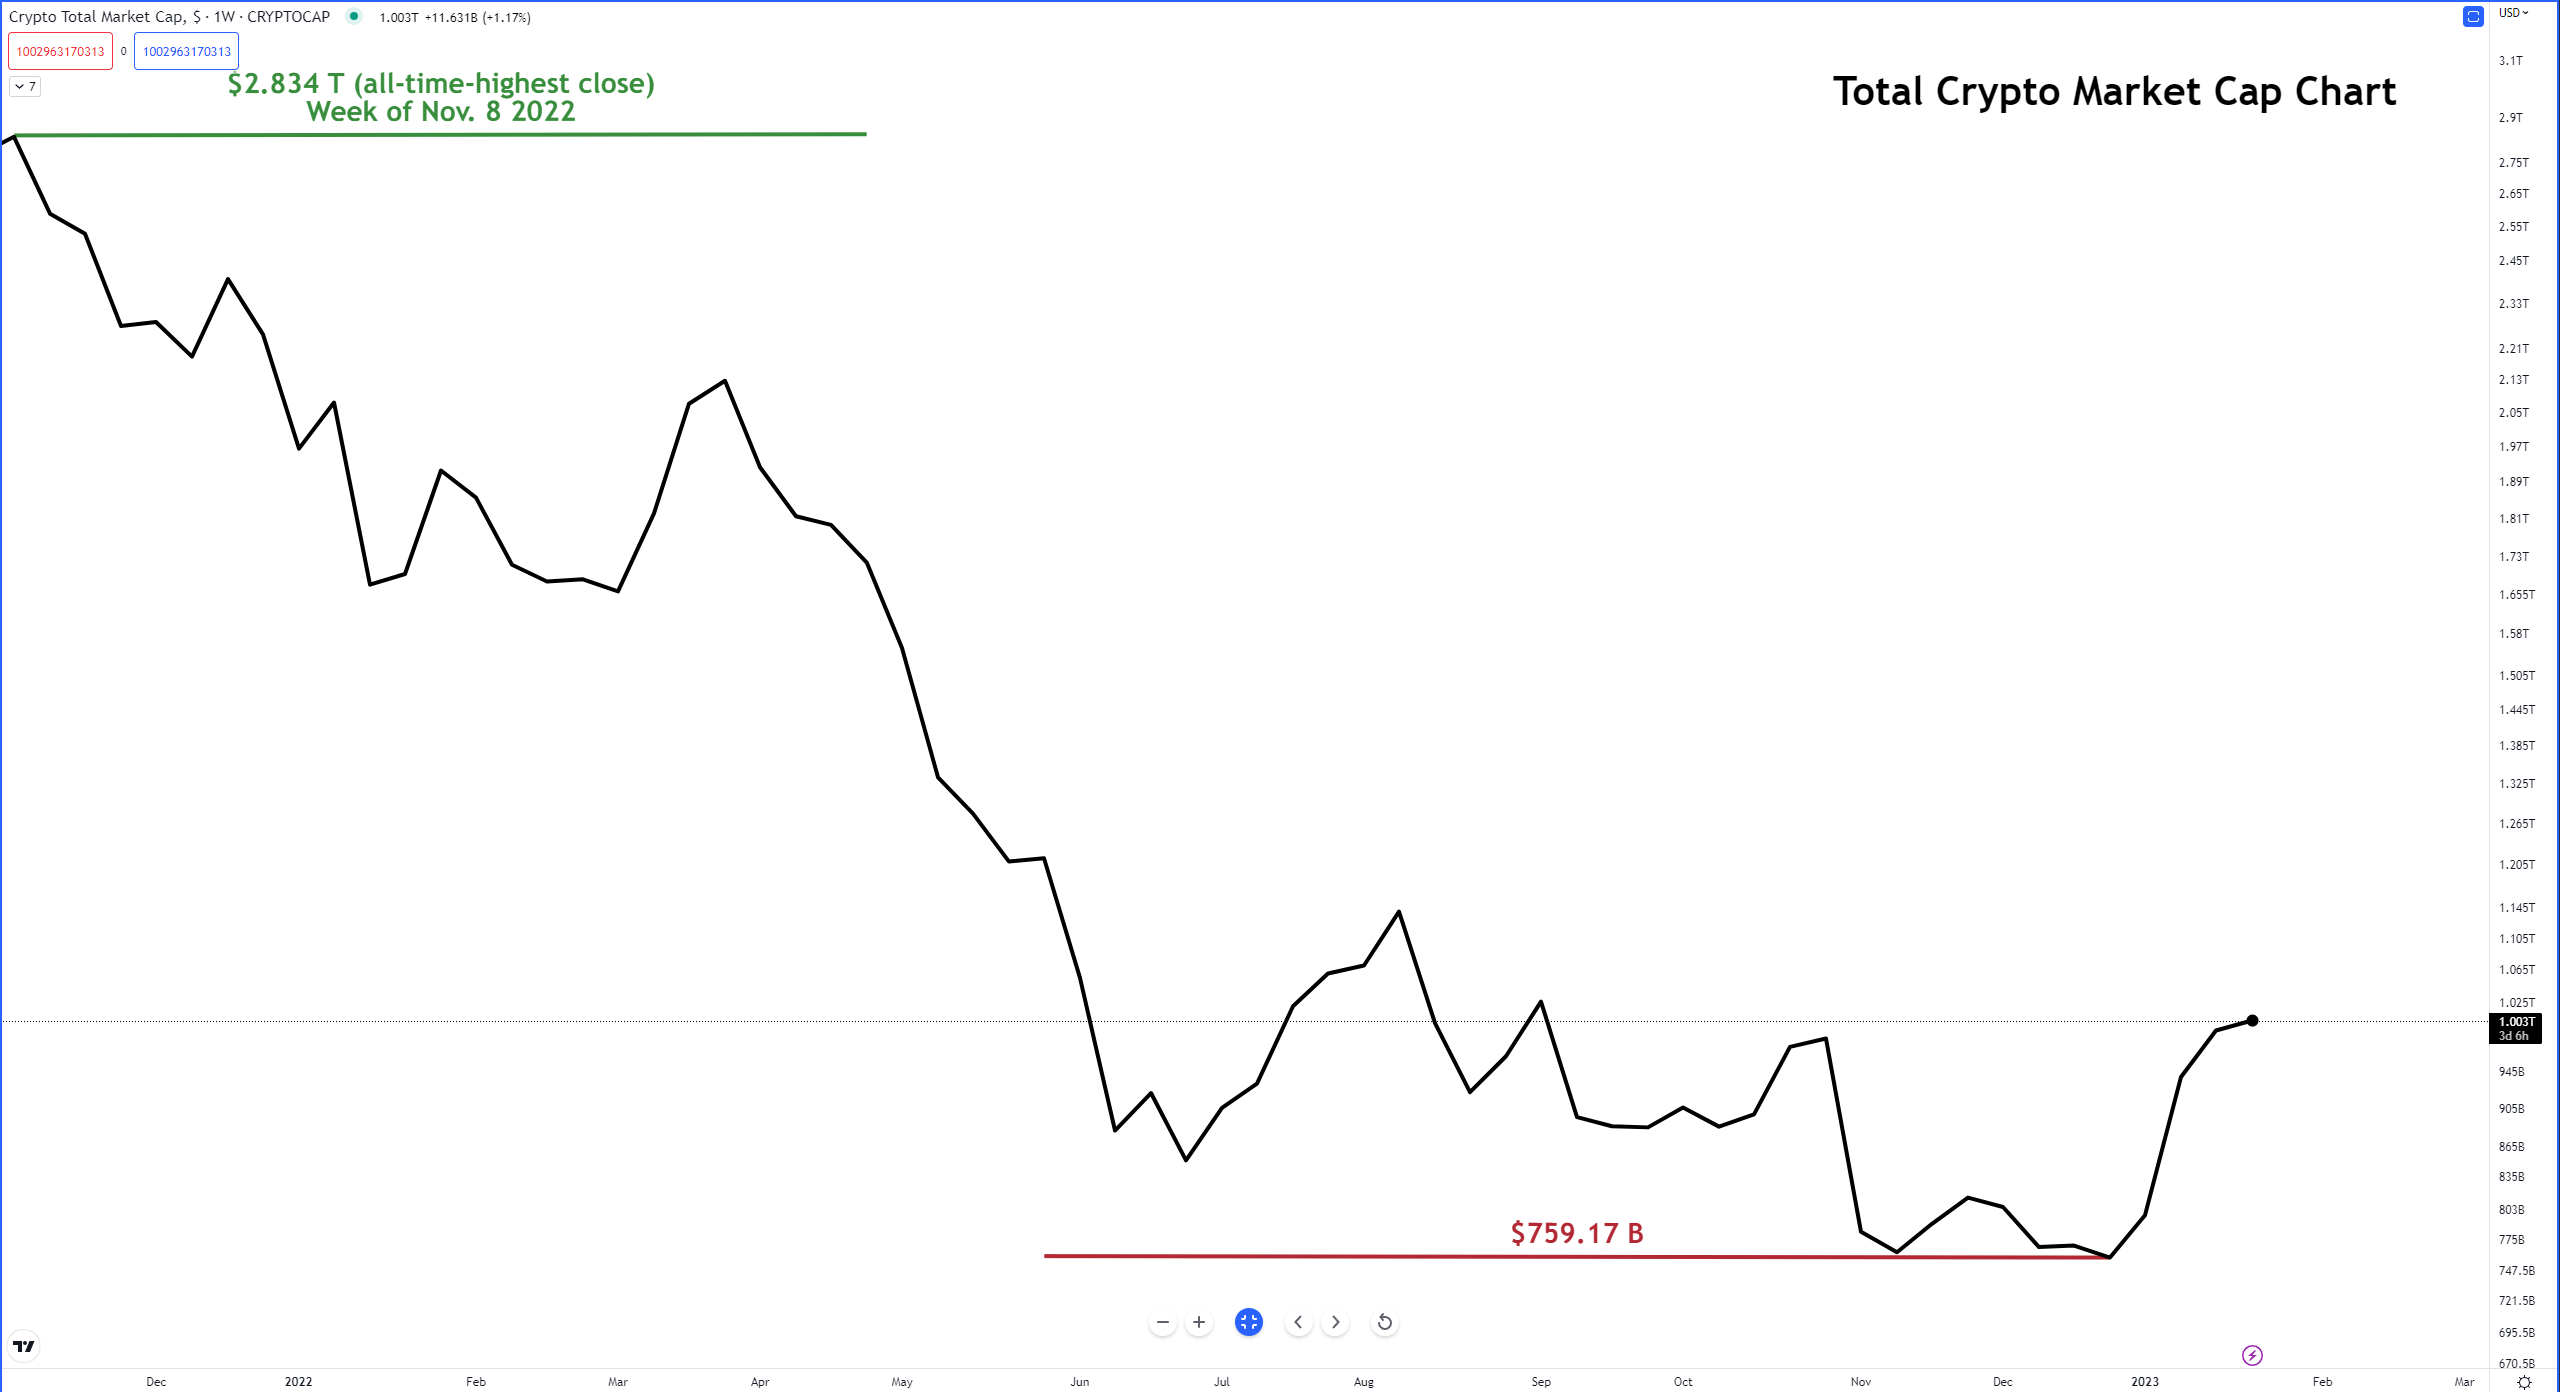
While the Total Market Cap chart doesn’t show it, the altcoin market has been mooning the past couple weeks. There are some fears that the rally in January 2023 may come to an end when February begins – but we’ll keep an eye on it. 👁️
*the price levels and performance values may be very different from what you read in your mail-box vs. what’s happening in the live market. This is especially true when crypto faces a new bull or bear run.
Top 25 Cryptocurrencies
Top 25 Cryptocurrency Update
There were six major changes this week.
$AXS.X, $BCH.X, $EOS.X, $FTM.X, $THETA.X, and $XTZ.X replaced $DOGE.X, $ETH.X, $MANA.X, $SAND.X, $TRX.X, and $XRP.X.
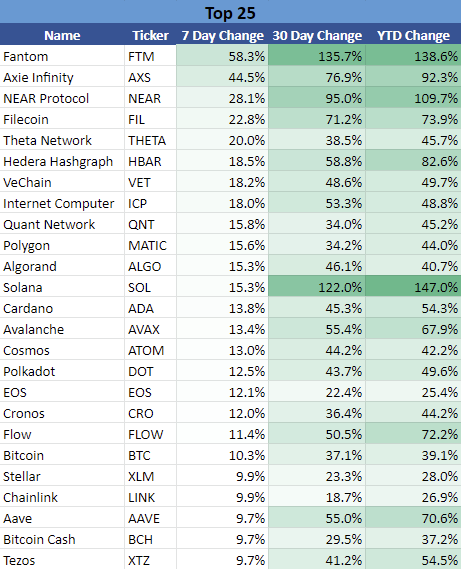
Overall, the Top 25 cryptocurrencies were positive for the week, higher by +9% versus +8.5% prior. 👍
*The universe used to construct the Top 25 list consists of all cryptocurrencies with at least $1 billion in market cap, excluding stablecoins.
Stocktwits Crypto Index RRG
Stocktwits Crypto Index RRG
Relative Rotation Graphs (RRG) are useful visual tools to identify how an instrument or a sector performs against a benchmark. The RRG image below shows eleven customized crypto indices. Each contains the top ten by market cap (excluding stablecoins and some exchange-based tokens).
They are rebalanced monthly, and the RRG tracks the last seven days’ performance.
Without going into the nitty-gritty details, the four colored sectors can be thought of like this, so imagine you’re in a race:
- Leading Quadrant (green) – You are in 1st, 2nd, or 3rd place. You are leading the pack. You’re going to medal. Anthems will be sung, tears will fall, and you may or may not pass a doping test.
- Weakening Quadrant (yellow) – You’re losing your momentum and out of breath. You just realized that your spouse or your mom didn’t show up to watch you, sapping your enthusiasm. You’re falling back and in the middle of the pack.
- Lagging Quadrant (red) – You pulled a hamstring. You pulled a Michael Scott and ate five pounds of fettuccine alfredo an hour before your race. You fell down. You’re dead last. No anthems will be sung, but tears will fall, and no one will remember your name.
- Improving Quadrant (blue) – You see your spouse or your mom in the stands. The crowd starts to see you get up. Emotional music begins, and the camera pans to the crowd in slow motion. You’re back on your feet and in the middle of the pack, gaining on the leaders.
All indices pointing higher, but the great majority remain in the Lagging Quadrant.
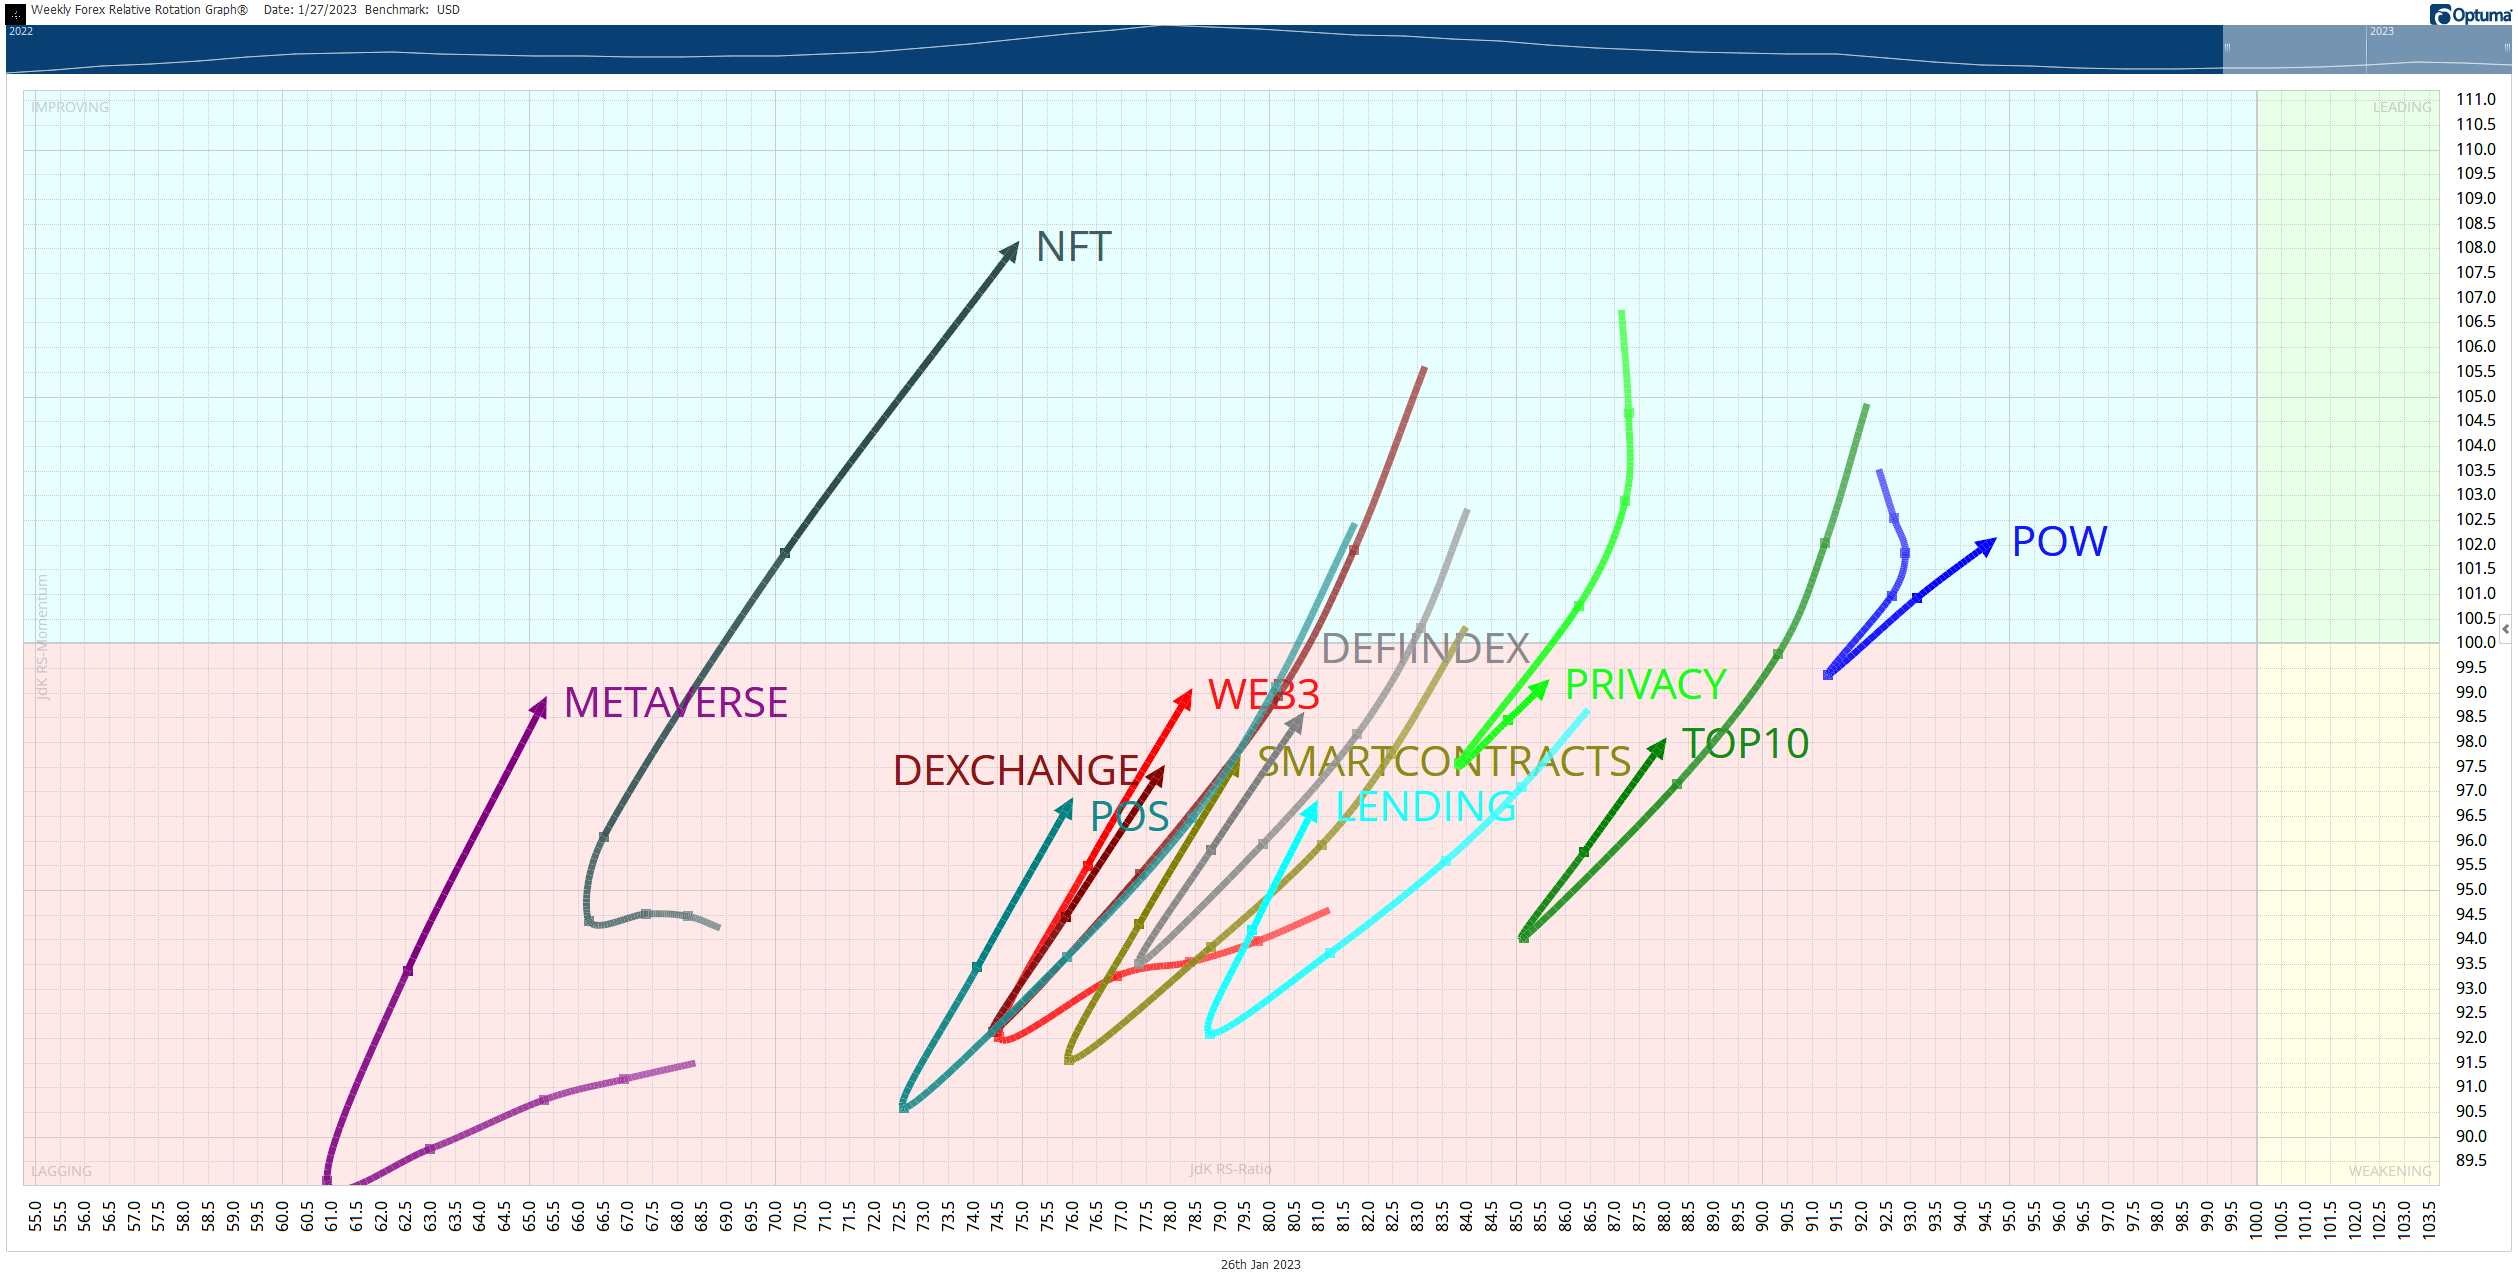
If there were just a little more ‘oomph’ in the crypto market, we would probably have seen the Web3, Privacy, and DeFi indices move into the Improving Quadrant.
As with last week, the Metaverse Index, despite its performance, continues to lag. However, it may very well take over into the crypto market’s biggest leader if its current momentum continues for another two weeks.
The GIF below shows the past seven weeks of movement on the RRG.
Metaverse
Metaverse Index
The Metaverse Index is a collection of cryptocurrencies that focuses on virtual worlds and environments, including the Play 2 Earn and gaming class of cryptocurrencies.
We construct this index by limiting the assets in this space to a minimum market cap of $10 million.
There were two major changes to the index this week.
DVI and GF replaced GOG and $PYR.X.
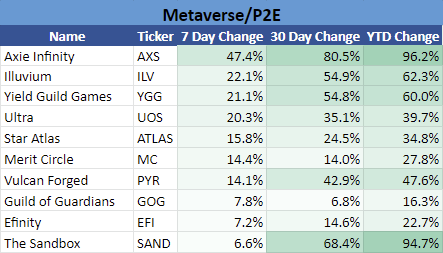
The Metaverse Index was the best performer of the week, up mind-blowing +26.3% vs. +7.9% prior. 🤯
NFT
NFT Index
The NFT Index is made up of cryptocurrencies that offer non-fungible tokens.
We construct this index by limiting the assets in this space to a minimum market cap of $50 million.
There were five major changes this week.
$AXS.X, BIT, $ILV.X, $PYR.X, and $UOS.X replaced $ALI.X, $ENJ.X, $FLOW.X, $MANA.X, and $WAXP.X.
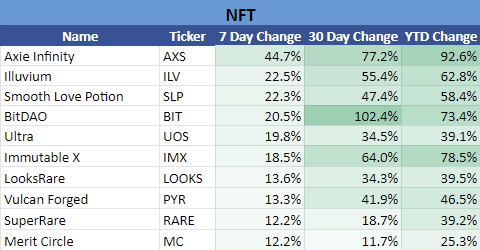
The NFT Index was the second best-performing index of the week, up +17.3%, vs. +11.9% prior. 💪
Web3
Web3 Index
The Web3 Index comprises cryptocurrencies focusing on the next generation of the internet: blockchain, publicly distributed ledgers, transparency, openness, decentralization, and tokenonomics.
We construct this index by limiting the assets in this space to a minimum market cap of $50 million.
The changes in this index were significant: seven out of ten swapped this week.
$API3.X, $AUDIO.X, BIT, $GTC.X, $LPT.X, $OCEAN.X, and $THETA.X replaced $AR.X, $CVC.X, $ENS.X, $FET.X, $HIVE.X, $HNT.X, and $STORJ.X.
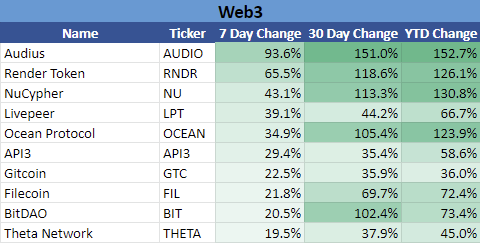
The Web3 Index was the third-best performer of the week, up +17% vs. +6.7% prior. 3️⃣
Bonus Index - Smart Contracts
Smart Contracts Index
The Smart Contracts Index includes cryptocurrencies whose blockchains allow for smart contracts. Ethereum and Cardano would be examples of cryptocurrencies that fall into this index.
We construct this index by limiting the assets in this space to a minimum market cap of $250 million.
All but two of the assets in this index changed this week.
In this week: $CELO.X, $FTM.X, $KDA.X, $MINA.X, $ONE.X, $ROSE.X, $VET.X, and $XCH.X.
Out this week: $CSPR.X, $DOT.X, $FLOW.X, $HBAR.X, $KAVA.X, $KSM.X, $SOL.X, and $XTZ.X.
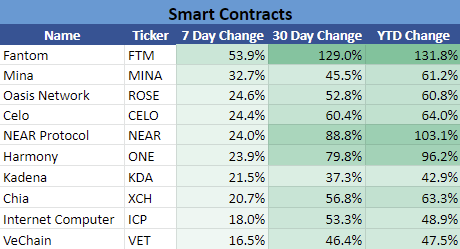
The Smart Contracts Index was the worst-performing index this week but still up +7% for the week vs. +7.6% prior. ❌
Summary
Putting It All Together
For the third week in a row, all ten Stocktwits Crypto Indices are in the green. 💚
Additionally, every asset in every index is positive for the past 7 days, the past 30 days, and YTD – the only exception is $XMR.X, which is down -11.6% for the past 30 days.
Are there warning signs of a top in this market? Certainly – but it’s been like that for a couple of weeks and every little dip keeps getting bought. As we exit January and enter February next week, that might be when we see another major move.
Again, if you didn’t get a chance to see how our custom crypto indices performed in 2022, you can read it here.
The NFT Index has been in the top 3 indices for all of 2023 so far.
See You Next Saturday!
Credits & Feedback
Today’s Litepaper was written by Jon Morgan. Let him know how he did: