Cathie Wood’s ARK Innovation ETF did little to protect investors during the recent market flood, leaving many wondering if Cathie can right the ship or if it will continue to capsize?
Our “Chart Of The Week” may help answer that question by explaining why many market participants are watching the $ARKK ETF as a signal of where the overall market is headed.
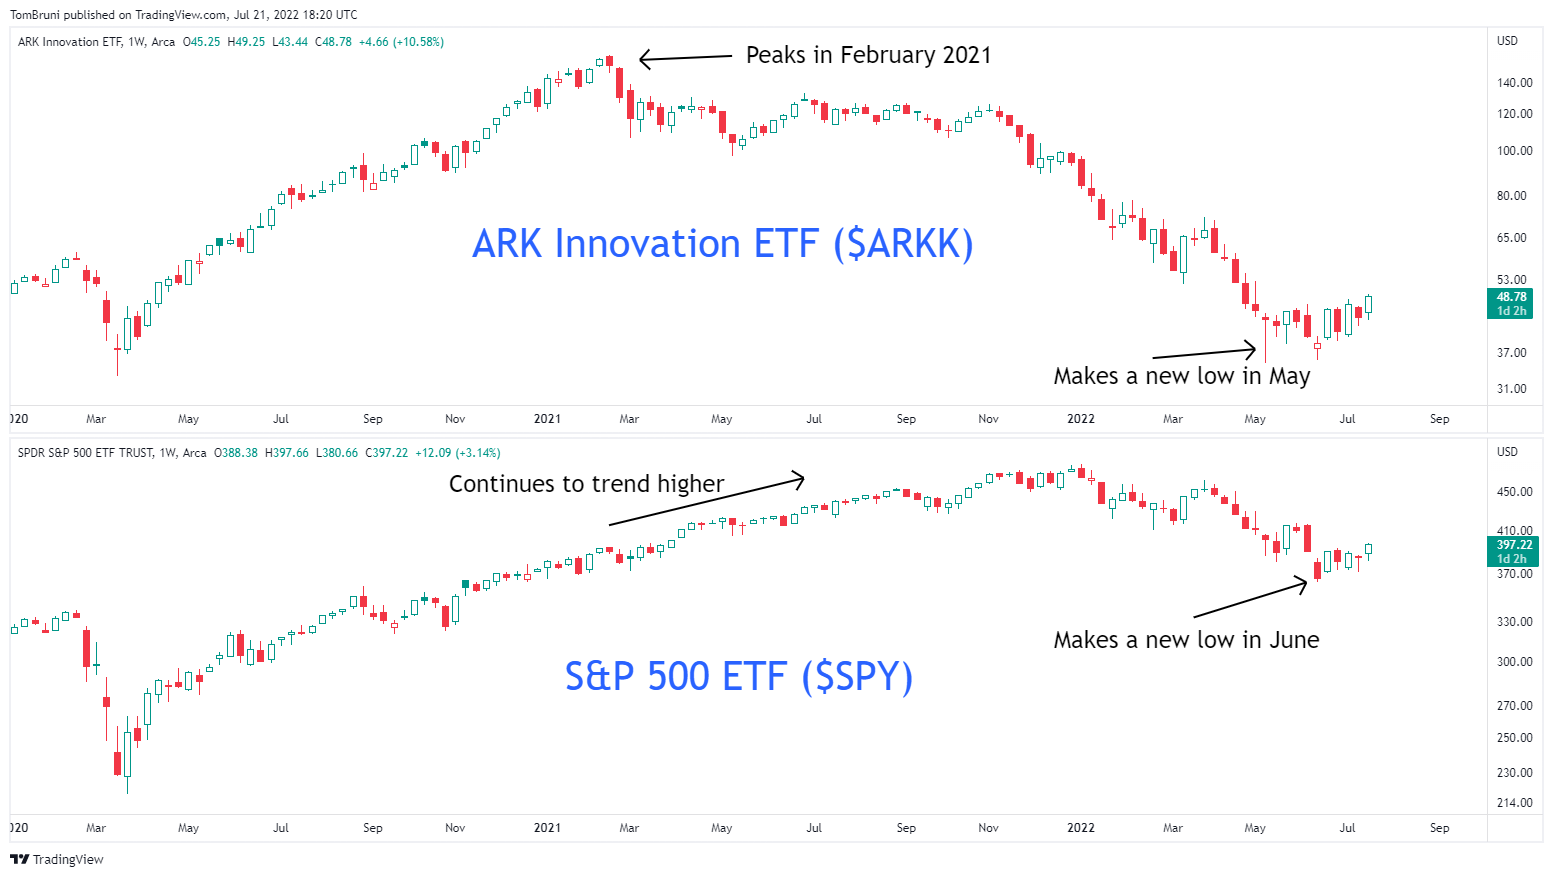
On the top panel is Cathie Wood’s flagship ARK Innovation Fund ETF $ARKK, and on the bottom is the S&P 500 ETF $SPY. Both are measured from January 1st, 2020, through today.
Necessary Background
Before we analyze the chart, it’s helpful to remember the objectives and holdings of each of these investments.
The ARK Innovation ETF primarily invests in ‘innovative’ market areas with high growth potential, like technology, healthcare, communication services, and consumer discretionary. It also invests across market-cap sizes and takes significant position sizes leading to a more concentrated portfolio of bets. Lastly, it is an actively managed portfolio with a lot of turnover among positions.
Meanwhile, the S&P 500 looks to provide investors with broad exposure to large-cap stocks across all eleven sectors. Now it is market-cap weighted, so it tends to have high exposure to tech, health care, and consumer discretionary as well, but the point is it’s far more diversified in its number of holdings and sector exposure. Lastly, it is a “largely passive” portfolio that only rebalances four times per year.
Chart Analysis
Okay, now that we’ve laid the groundwork, let’s get back to the chart and the points we’re focused on.
The first is after the COVID crash of 2020, where both the ETF and the S&P 500 soared to new highs.
However, in February 2021, $ARKK made a new high and began to fall as market participants began to price in higher inflation and interest rates. Its high concentration of Covid-related and high-growth/speculative areas of the market left it vulnerable to the higher interest rate environment the market was beginning to price in.
Meanwhile, the more diversified S&P 500 saw “value-oriented” market areas like financials, industrials, and energy help push it higher until early 2022 when stocks began to sell off more broadly.
Then, in May this year, the ARK ETF made a new low ahead of the market and began to base. Then the S&P 500 followed, creating its own low in June.
So, if ARK acted as a leading indicator of the market’s decline last year, could its recent price improvements be a leading indicator of a coming market rally?
That’s essentially the bet some market participants are making.
Arguing Both Sides
Let’s not leave it to a chart, though. Below we’ll outline some of the most prominent arguments on both sides of the aisle so you can draw your own conclusion.
The first area of disagreement is about inflation and interest rates.
The bulls argue that inflation has peaked, the market has already priced in several U.S. rate hikes for the rest of the year, and that the Federal Reserve will have to begin cutting rates sometime in 2023.
The bears argue that inflation is not under control and that the Federal Reserve will have to be even more aggressive in its tightening, leading to a deep recession. A period of low/no growth and high inflation, aka stagflation, would be bad for growth stocks (and stocks in general).
The inflation and interest rate piece of this conversation is arguably the most important, given their impact on analyst models/forecasts.
The second disagreement is about sentiment.
The bulls argue that there’s been nothing but negative news about the economy, company earnings, etc., over the last month, yet stocks have stopped going down. Data points/surveys have also shown that everyone from central bankers and government officials to business owners and Wall Street analysts is pessimistic about the economy and markets.
The bears argue that using sentiment as a market-timing mechanism is a losing strategy and that pessimism is warranted given the state of the global economy and markets.
The last disagreement is about earnings.
The bulls argue that growth stocks have gotten cheap relative to recent history and that earnings expectations have fallen enough to provide some margin of safety for investors.
The bears argue that many growth companies are still too bloated on the expense side and will see revenue decline as the global economy contracts. Additionally, the price multiple investors are willing to pay for these stocks will remain low if inflation/interest rates stay elevated.
The Cathie Wood controversy.
There’s a final disagreement about Cathie Wood’s investment abilities, but we can’t add much there. As with any controversial figure, she has her lovers and haters. Her fans believe she’s one of the most innovative market participants ever seen, while her haters think she’s a fraud.
Like most things in life, the truth is probably somewhere in the middle of those two extremes.
Conclusion
In conclusion, it’s unclear whether or not the ARK Innovation ETF has any merits as a reliable market timing indicator. However, given the number of eyeballs on it and its portfolio composition, how it performs in the coming weeks and months will tell us a lot about investor expectations about inflation, interest rates, and the environment for growth stocks in general.
If you have a view, we’d love to hear it! Hop over to the $ARK stream to share your thoughts.