There are three charts that the community has been talking about recently, so we want to highlight them below with some context.
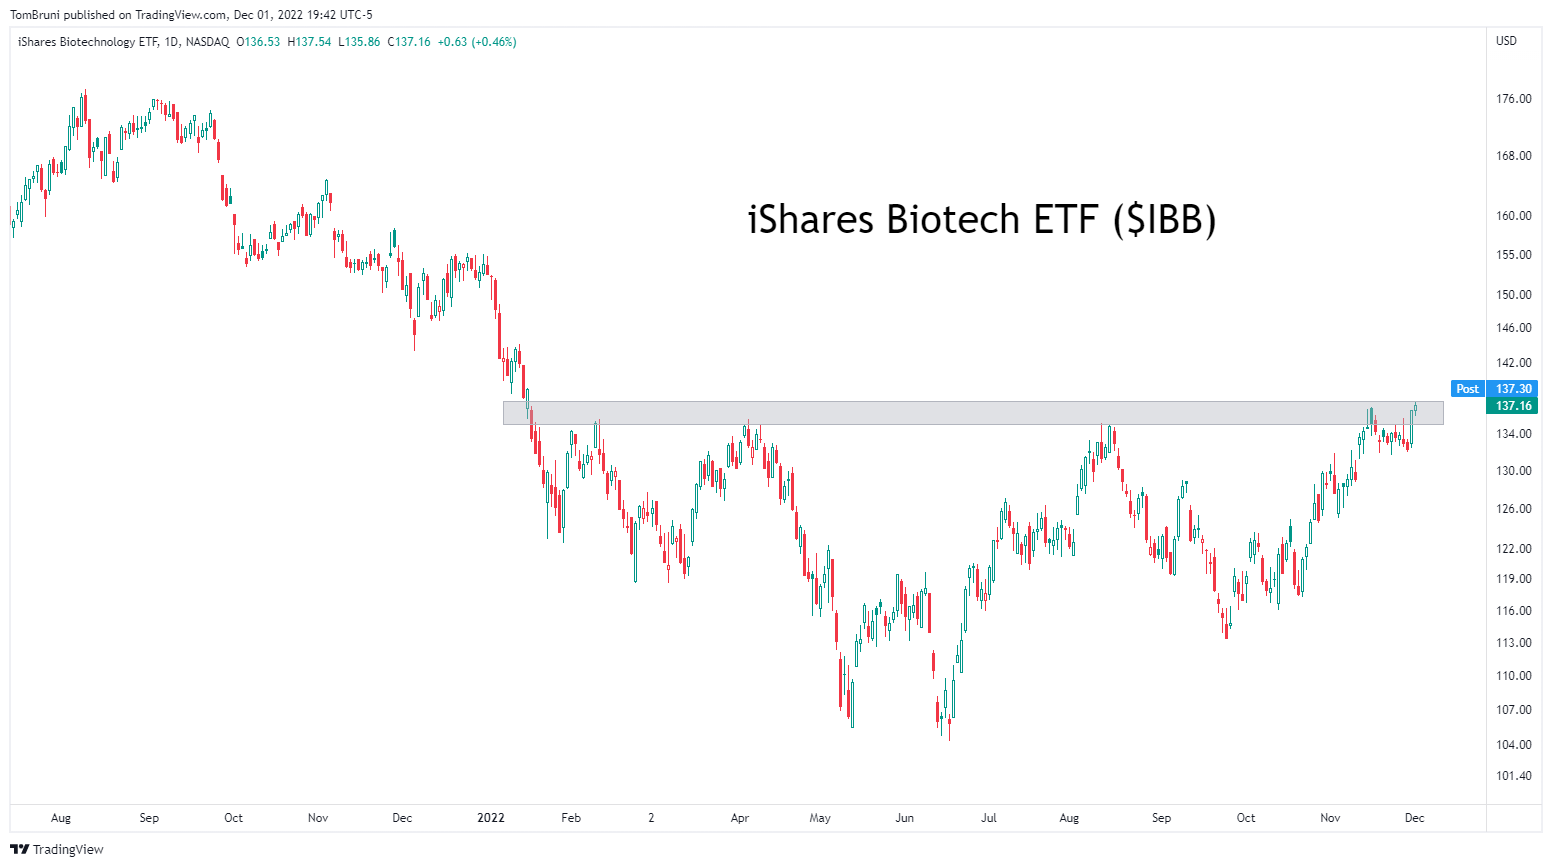
The first is the market-cap weighted iShares Biotech ETF ($IBB).
Technical analysts have pointed to the base it formed throughout 2022, with prices staying below the 135-137 level. But as of this week, many suggest a breakout is ahead for the sector as prices test that resistance level once again.
So why does this matter?
Bulls say the Biotech sector is often a leading indicator for bull markets. The theory is this higher-beta area of the market shows investor risk appetite and willingness to bet on higher prices for the overall stock market. Bears question that theory and think this breakout attempt will fail like all the last as the overall market turns lower again.
Only time will tell who is right. But for now, Biotech remains on many community members’ radars 🤷
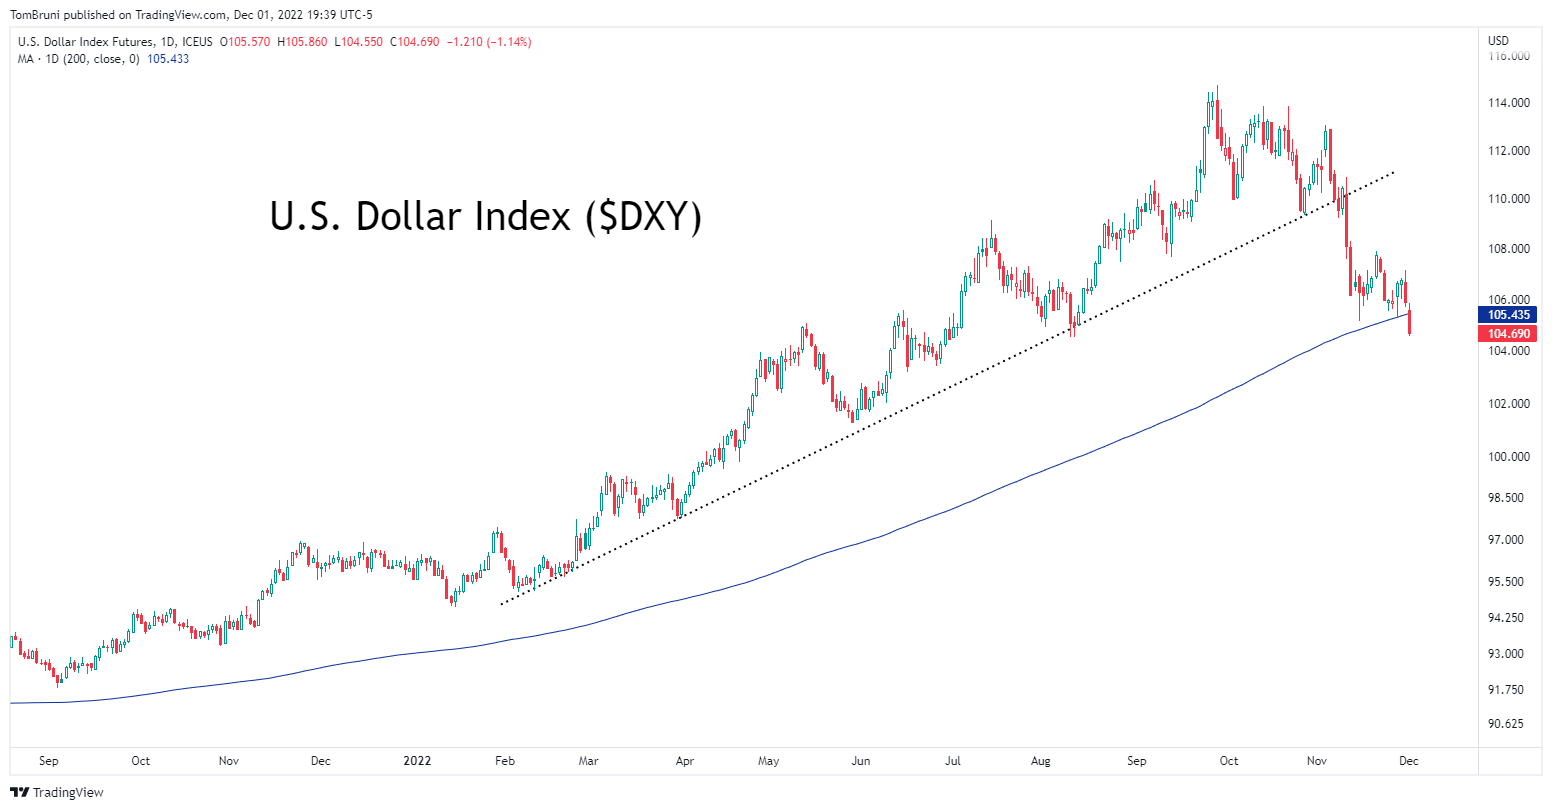
We last talked about the U.S. Dollar three weeks ago as it began to break its trend. And the theory investors’ had then seemed to have played out so far. As the “safe-haven” Dollar declines, risk assets continue to rally.
Why it’s back on people’s radars today is because prices broke below the widely-followed 200-day moving average, which technical analysts use to track the long-term trend. 👀
Some traders suggest a break of this key level will lead to further downside for prices and a continued tailwind for stocks and other risk assets. Meanwhile, others suggest that the selloff in the Dollar and rally in stocks is overdone and that a trend reversal in both is ahead.
Either way, the Dollar has been a key asset to track this year and will likely remain so. 💵
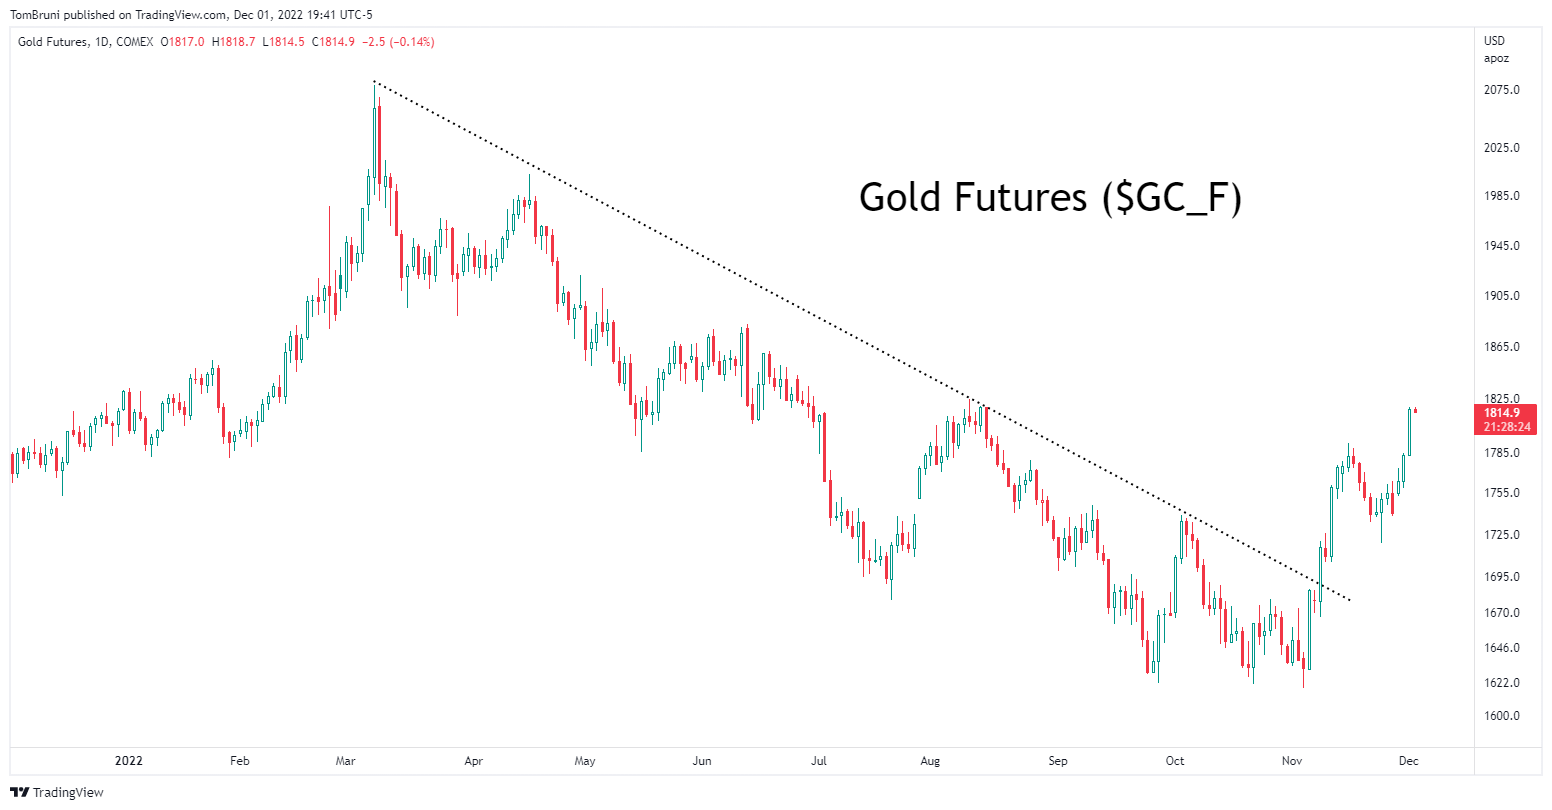
Lastly, we want to highlight Gold. After a rough eight-month stretch, the precious metal space recently caught a bid as the U.S. Dollar sold off. Breakouts in Gold, Silver, and even Platinum have caught our community’s attention as we head into year-end. 🪙